Digital Power Utility Market Size and Share
Market Overview
| Study Period | 2021 - 2031 |
|---|---|
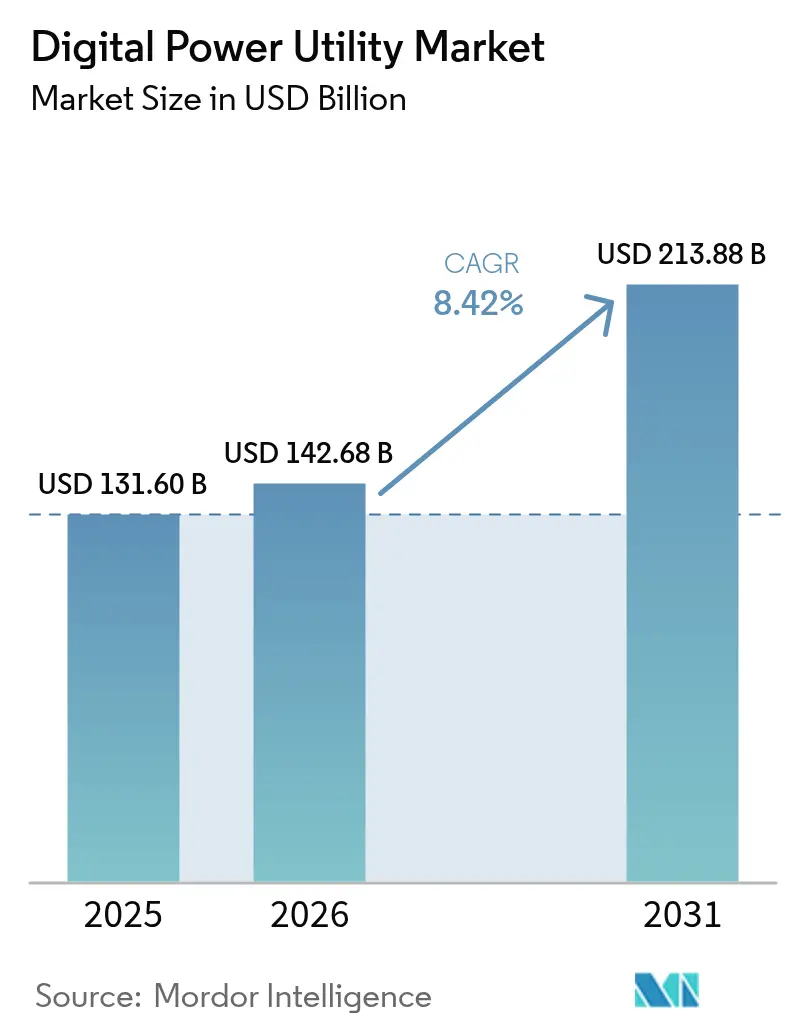
| Market Size (2026) | USD 142.68 Billion |
| Market Size (2031) | USD 213.88 Billion |
| Growth Rate (2026 - 2031) | 8.42% CAGR |
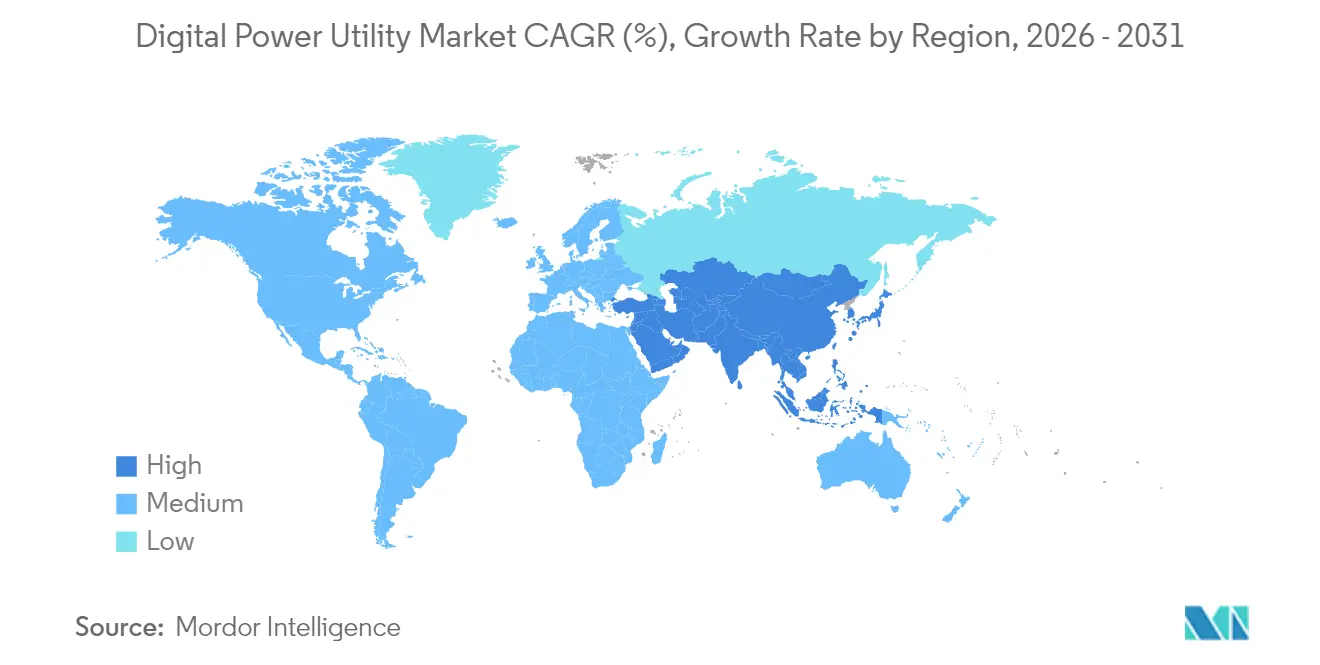
| Fastest Growing Market | Asia-Pacific |
| Largest Market | North America |
| Market Concentration | Low |
Major Players *Disclaimer: Major Players sorted in no particular order Image © Mordor Intelligence. Reuse requires attribution under CC BY 4.0. | |
Digital Power Utility Market Analysis by Mordor Intelligence
The Digital Power Utility Market size was valued at USD 131.60 billion in 2025 and estimated to grow from USD 142.68 billion in 2026 to reach USD 213.88 billion by 2031, at a CAGR of 8.42% during the forecast period (2026-2031).
The surge is rooted in utilities moving from asset-centric operations to data-centric models that accommodate fast-growing electricity demand from hyperscale data centers and steadily rising renewable penetration. Integrated platforms that merge artificial intelligence, digital twins, and IoT sensors are replacing siloed systems, allowing real-time optimisation, self-healing networks, and automated outage management. North American utilities dominate early adoption because of long-running grid-modernisation mandates, yet Asia-Pacific utilities are scaling deployment fastest as they leapfrog legacy systems with next-generation infrastructure. Hardware upgrades—chiefly smart meters and intelligent electronic devices—give the market its near-term volume momentum, while cloud-hosted analytics and edge computing yield the long-term efficiency dividend. Competitive intensity, meanwhile, is shaped by industrial incumbents defending installed bases against software majors that promise end-to-end digital transformation.
Key Report Takeaways
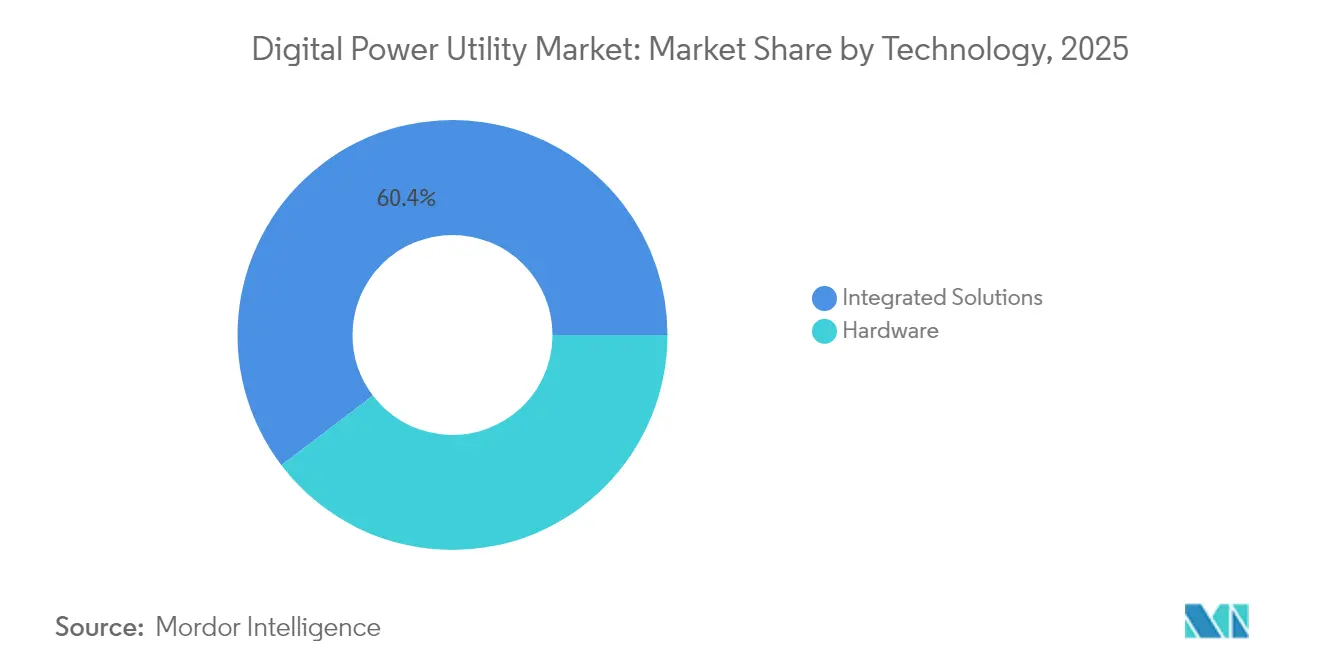
- By technology, integrated solutions captured 60.35% of 2025 revenue. Hardware components are on track for an 11.02% CAGR through 2031.
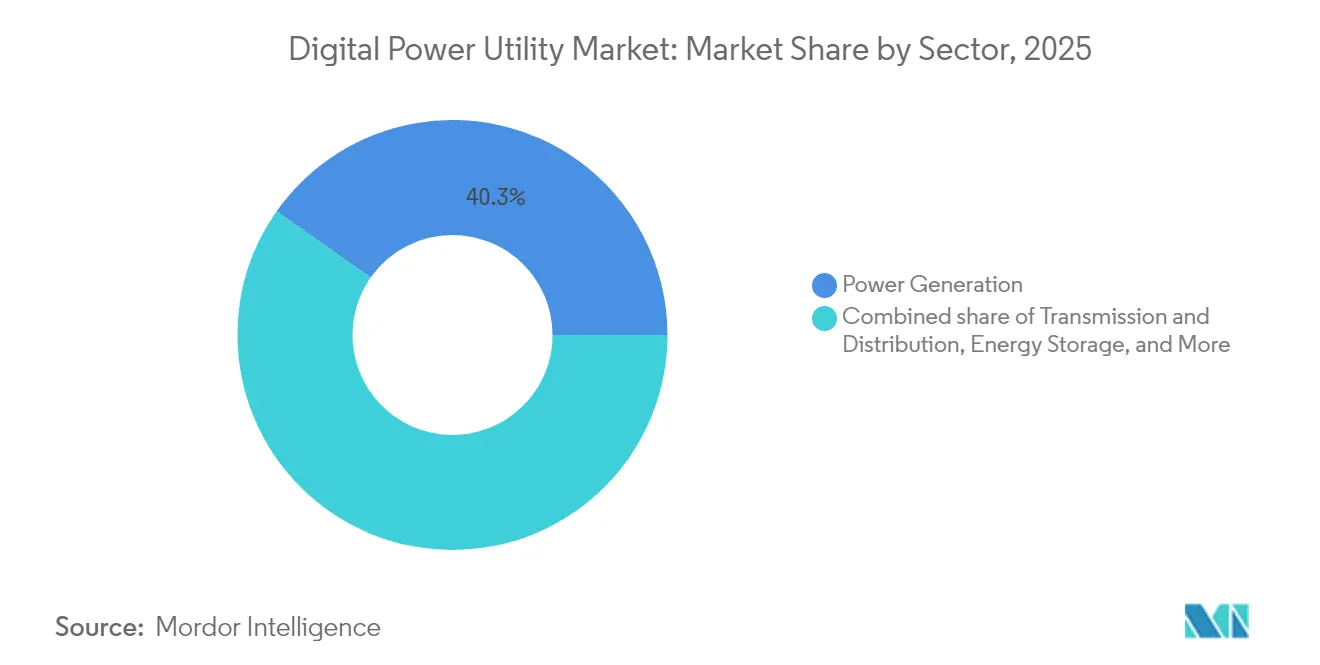
- By sector, power generation accounted for 40.25% revenue in 2025. Energy storage is projected to post a 14.2% CAGR to 2031.
- By geography, North America led with 37.45% 2025 revenue share. Asia-Pacific is anticipated to advance at a 12.25% CAGR between 2026 and 2031.
Note: Market size and forecast figures in this report are generated using Mordor Intelligence’s proprietary estimation framework, updated with the latest available data and insights as of 2026.
Global Digital Power Utility Market Trends and Insights
Drivers Impact Analysis*
| Driver | (~) % Impact on CAGR Forecast | Geographic Relevance | Impact Timeline |
|---|---|---|---|
| Accelerated smart-grid investments | +2.1% | Global; strongest in North America and EU | Medium term (2-4 years) |
| Integration of renewable energy & DERs | +1.8% | Global; strongest in APAC and EU | Long term (≥ 4 years) |
| Regulatory push for decarbonisation & efficiency | +1.5% | North America and EU | Medium term (2-4 years) |
| Edge-AI deployment for real-time grid optimisation | +1.2% | North America and APAC | Short term (≤ 2 years) |
| Data-centre flexibility procurement surge | +0.9% | Global; focused in cloud regions | Short term (≤ 2 years) |
| Cyber-resilience mandates driving digital-twin uptake | +0.8% | North America; expanding globally | Medium term (2-4 years) |
| Source: Mordor Intelligence | |||
Accelerated Smart-Grid Investments
Utilities allocated more than USD 40 billion to smart-grid upgrades during 2024, turning modernisation into the default capital-planning lens.[1]DTE Energy, “Distribution System Plan 2024,” dteenergy.com American Electric Power’s USD 350 million Ohio deployment and DTE Energy’s USD 4 billion programme illustrate the pivot from hardware replacement toward interoperable, data-rich infrastructure.[2]American Electric Power, “Ohio Grid Modernization Filing,” aep.com Investments increasingly favour platforms that fuse advanced metering, distribution automation, and situational awareness for outage mitigation. The return profile is attractive because real-time monitoring trims service-interruption minutes and curbs field-maintenance costs. Utilities also gain new revenue opportunities by monetising granular consumption data through value-added services.
Integration of Renewable Energy & DERs
FERC Order 2222 opened wholesale markets to aggregated distributed resources, demanding sophisticated orchestration that legacy systems cannot support.[3]Federal Energy Regulatory Commission, “Strategic Plan 2024-2028,” ferc.gov Millions of rooftop solar arrays, battery packs, and EV chargers now interact with the bulk grid, making bidirectional flows normal rather than exceptional. Edge devices with local processing balance micro-level variability before data flows upward to control centres. Utilities adopting these architectures report smoother renewable ramp-rates and lower curtailment. The shift also spurs customer-centric business models in which consumers receive financial incentives for flexible behaviour.
Regulatory Push for Decarbonisation & Efficiency
Order 881 obliges transmission operators to use dynamic line ratings and 10-day ambient forecasts, unlocking up to 40% latent capacity on existing conductors. State regulators increasingly link cost recovery to demonstrable efficiency improvements, making digital investments a compliance requirement. Transparency mandates drive demand for accurate asset health records and emissions reporting, further embedding analytics into day-to-day operations. Utilities that exceed emissions-reduction targets often secure preferential financing, reinforcing the positive feedback loop between digital maturity and capital access.
Edge-AI Deployment for Real-Time Grid Optimisation
Partnerships such as Utilidata and NVIDIA place machine-learning inference at distribution transformers, enabling sub-second voltage adjustments that reduce technical losses by up to 10%. Edge devices also detect harmonic distortions created by fast-charging EV stations, adjusting inverter set-points before system-wide instability forms. Falling compute costs and containerised software stacks allow smaller municipal utilities to adopt capabilities once reserved for large investor-owned peers.
Restraints Impact Analysis*
| Restraint | (~) % Impact on CAGR Forecast | Geographic Relevance | Impact Timeline |
|---|---|---|---|
| High upfront CAPEX requirements | -1.4% | Global; pronounced for small utilities | Medium term (2-4 years) |
| Legacy-system interoperability barriers | -1.1% | North America and EU | Long term (≥ 4 years) |
| Utility-grade data-scientist scarcity | -0.8% | Global; acute in APAC | Long term (≥ 4 years) |
| Rising cyber-insurance premiums | -0.6% | Global; critical infrastructure | Short term (≤ 2 years) |
| Source: Mordor Intelligence | |||
High Upfront CAPEX Requirements
Full-scale smart-grid deployments cost USD 2-5 million per thousand customers, with recovery periods stretching beyond typical regulatory cycles. Smaller cooperatives relying on municipal bonds struggle to clear financing thresholds, delaying roll-outs that could lower operating expenses in the long term. Regulatory lag—often 18 months between filing and approval—erodes purchasing power when component prices fluctuate. Emerging public-private partnerships provide partial relief, yet adoption remains sporadic.
Legacy-System Interoperability Barriers
Utilities operating mainframe billing systems or proprietary SCADA platforms face expensive middleware requirements when layering cloud analytics. Custom integration can double project budgets and lengthen commissioning timelines. Data inconsistencies, from missing time stamps to non-standard asset identifiers, diminish the accuracy of predictive models and require extensive cleansing.
*Our forecasts treat driver/restraint impacts as directional, not additive. The impact forecasts reflect baseline growth, mix effects, and variable interactions.
Segment Analysis
### By Technology: Integrated Solutions Drive Digital Transformation
Integrated platforms held 60.35% of 2025 revenue, underscoring utilities’ preference for unified systems that collapse data silos and streamline vendor management. Digital twins model asset behaviour under various loading and climate scenarios, enabling predictive maintenance that cuts unplanned outages by up to 30%. AI-driven analytics within these suites forecast component failures six to twelve months in advance, giving operators time to re-route power and schedule repairs without service disruption. The digital power utility market for hardware remains smaller today, yet it is expanding faster because millions of 5G-enabled smart meters, reclosers, and phasor measurement units are entering service across the Asia-Pacific. Communication infrastructure investments synchronize with cloud migration, laying fibre and private-LTE backbones that secure deterministic latency essential for real-time protection schemes. Middleware that processes edge data locally reduces backhaul costs while safeguarding customer privacy, a capability gaining traction as data-sovereignty regulations tighten. Although individual products still matter, the competitive edge lies in seamless orchestration, the ability to treat algorithm training, device firmware, and customer portals as one converged solution.
Hardware components are forecast to record an 11.02% CAGR through 2031, reflecting accelerated metering roll-outs and intelligent device retrofits in emerging markets. For example, utilities in India and Southeast Asia tie revenue protection to meter data integrity; intelligent devices also facilitate prepaid billing, reducing receivables risk. Meanwhile, mature markets update relay protection and substation automation to integrate renewables without compromising grid stability. The digital power utility market continues to reward vendors that embed cybersecurity features at the silicon level, satisfying regulators who now evaluate component-level attack surfaces before granting type approval. As platforms mature, open-standards APIs become default procurement requirements, so utilities are not locked into single-vendor ecosystems.


### By Sector: Energy Storage Accelerates Digital Adoption
Power generation accounted for 40.25% of 2025 spending as operators digitally retrofit gas turbines and utility-scale solar arrays to maximise heat-rate efficiency and track curtailment. Generation assets bring vast data volumes that feed fleet-wide optimisation, enabling dispatch decisions that align economic and environmental objectives. Yet the fastest growth path is energy storage, projected at a 14.2% CAGR through 2031. New battery installs in the United States leapt 89% during 2024 and are forecast to reach 140-150 GW by 2030, elevating digital-control requirements for state-of-charge, thermal management, and revenue stacking.
Transmission and distribution (T&D) segments increasingly rely on situational-awareness software that merges phasor data, weather inputs, and market prices to maintain voltage stability as inverter-based renewables surge. Though smaller in absolute dollars, the digital power utility market share for trading and retail grows rapidly because deregulated jurisdictions engage consumers through real-time pricing and personalised recommendations. Advanced customer-engagement suites replace mass-billing tactics with data-driven segmentation, converting passive rate-payers into active participants in demand-response programmes. Storage-centric virtual power plants illustrate the sector’s convergence: batteries interfaced with cloud-born optimisation software sell capacity into capacity markets daily and frequency-response by night, an operating model impossible without layered digital intelligence.
Geography Analysis
North America led with 37.45% market revenue in 2025. Investment has been sustained by measures such as National Grid’s USD 35 billion modernisation programme and FirstEnergy’s USD 1.42 billion grid enhancement initiative, aiming to fortify reliability and integrate renewables. Federal funding via the Infrastructure Investment and Jobs Act further ignites demand for advanced conductors, dynamic line-rating sensors, and sub-second protection schemes. Canada’s growing participation in cross-border power trading introduces additional complexity that fuels the adoption of trading-optimization platforms.
Asia-Pacific represents the growth engine, with the digital power utility market expected to expand at a 12.25% CAGR from 2026 to 2031. China has invested over USD 4.3 billion in smart-grid pilots incorporating AI fault-detection and blockchain-enabled peer-to-peer settlement. India is targeting 250 million smart-meter installations under nationwide utility-reform programmes. Southeast Asia builds greenfield grids designed for bidirectional flows, bypassing legacy-system limitations common in older markets. Japan and South Korea continue to pilot edge-AI voltage-control schemes, demonstrating exportable blueprints for other densely populated regions.
Europe maintains steady momentum anchored by the European Green Deal’s climate objectives. Nations accelerate HVDC interconnectors and dynamic line-rating deployment to unlock cross-border renewable trade, while resilience imperatives following geopolitical tensions spur investments in situational-awareness analytics. The Middle East and Africa’s market remains nascent but shows promise as Gulf states diversify away from hydrocarbons and sub-Saharan economies integrate off-grid solar with mini-grids. South America exhibits mixed dynamics; Brazil’s expanding transmission corridors require real-time thermal monitoring, whereas Argentina’s renewable boom drives distributed-resource management system (DERMS) procurement. Across all regions, data-governance regulations influence architectural choices, making localised cloud zones and edge compute nodes standard features.

Regulatory Landscape
Regulation is increasingly codifying digital observability and interoperability as grid requirements rather than optional modernization. In the United States, FERC Order 881 requires transmission operators to use ambient-adjusted ratings (including dynamic line ratings) and 10-day forecasts to better utilize existing lines, reinforcing spend on sensors, analytics, and operational digital twins that can operationalize rating changes. Standards guidance also continues to shape procurement, with NIST maintaining the Smart Grid Interoperability Framework as a reference for aligning utility IT/OT architectures and data exchange.
In Europe and the United Kingdom, policy is moving toward coordinated energy data architectures and measurable smart-grid performance indicators. The UK Department for Energy Security and Net Zero and Ofgem released an Energy Digitalisation Framework in March 2026 to establish a coordination function and common standards across the sector, supporting consistent data models and cross-utility interoperability. The European Commission published COM(2026) 501 in June 2026, tasking ACER with recommendations around smart grid indicators for transmission and distribution networks, alongside work on an EU catalogue of indicators. These initiatives reinforce compliance-driven demand for integrated platforms that can report grid performance, cybersecurity posture, and asset condition with auditable data lineage.
Competitive Landscape
The digital power utility market features moderate fragmentation. Industrial majors, ABB, Siemens, and Schneider Electric, leverage extensive equipment footprints to cross-sell software upgrades. ABB’s acquisition of Gamesa Electric’s power electronics division and SEAM Group strengthens its renewable and asset-performance portfolios, aligning with the market shift toward integrated offerings. Siemens pairs grid-automation hardware with EnergyHub’s distributed-resource platform, extending reach from substation to customer device. Schneider Electric unveiled its One Digital Grid Platform in March 2025, bundling AI analytics and DER management into a single interface.
Technology giants aggressively target the utility vertical. Oracle’s USD 30 billion cloud contract signals utilities’ readiness to migrate mission-critical workloads to hyperscale environments. Microsoft Azure targets predictive-maintenance analytics, while Amazon Web Services collaborates with Hitachi Energy on cloud-native grid-control applications. Smaller specialists carve niches in cybersecurity, vegetation-management AI, and feeder-level analytics, often partnering with incumbents to gain market access. Competitive differentiation increasingly hinges on open-platform credentials; utilities prefer vendors that enable interoperability, protect data sovereignty, and provide transparent roadmaps. Hardware players respond by embedding software-defined functionality to sustain relevance as procurement cycles shift toward recurring-revenue service models.
Digital Power Utility Industry Leaders
General Electric Company
ABB Ltd.
Siemens AG
Schneider Electric SE
Oracle Corporation
- *Disclaimer: Major Players sorted in no particular order

Market Opportunities and Future Outlook
A major whitespace sits in scaling grid-enhancing technologies (GETs) into repeatable, software-defined operating processes across transmission and distribution. FERC Order 881 and the European Commission's work on smart grid indicators (COM(2026) 501) reinforce the need for instrumentation, forecasting, and workflow automation that translate dynamic ratings, weather inputs, and constraint management into dispatchable capacity. GETs such as dynamic line ratings and reconductoring are commonly cited as enabling up to 40% additional network capacity, while reducing traditional expansion costs by up to 35%. That framing creates pull-through for sensor networks, analytics, and digital-twin layers utilities can use for planning-to-operations traceability.
Another opportunity area is high-fidelity modeling and orchestration for DER-heavy grids and round-the-clock (RTC) solar-plus-storage supply serving data centers and industrial loads. In July 2026, Masdar reached financial close on a 5.2 GW, 19 GWh RTC solar-plus-storage project in Abu Dhabi, an example of storage-centric operations that depend on digital control, forecasting, and performance optimization. Distribution utilities are also tying multi-year capex to digital execution at scale, illustrated by Neoenergia's announcement of a EUR 2.22 billion program (July 2026) to modernize and digitalize distribution networks in Pernambuco and Rio Grande do Norte, including new substations and extensive network buildout. This expands demand for advanced metering, outage management, grid analytics, and cybersecurity-by-design. Vendor whitespace also persists in simplifying integration for legacy environments, packaging digital twins, DERMS, and asset performance management into deployable reference architectures that shorten commissioning timelines and reduce custom middleware costs.
Recent Industry Developments
- July 2026: Neoenergia announced a EUR 2.22 billion investment plan to modernise and digitalise distribution networks in Pernambuco and Rio Grande do Norte in Brazil, including new substations and significant network expansion. The program raises near-term requirements for digital grid operations, asset monitoring, and planning tools that can manage construction-driven topology changes alongside reliability and loss-reduction targets.
- June 2025: Oracle secured a USD 30 billion cloud-infrastructure agreement, highlighting the scale at which large enterprises are committing to hyperscale cloud capacity for mission-critical workloads. For digital utilities, this supports broader migration of grid analytics, customer platforms, and data integration pipelines to cloud environments with utility-grade security and resilience controls.
- June 2024: Utilities continued accelerating smart-grid upgrades, with sector-wide spending cited at more than USD 40 billion during 2024 for modernization programs that include advanced metering, automation, and situational awareness. This sustained capex cycle expands the installed base for software, edge compute, and cybersecurity layers that convert new field data into operational outcomes such as faster restoration and reduced technical losses.


Research Methodology Framework and Report Scope
Market Definition and Coverage
This market covers revenues from digital solutions used by utilities and grid operators to plan, monitor, automate, and optimize electricity operations. It spans generation-facing control, transmission and distribution networks, and retail-facing processes.
Scope exclusions: consumer energy devices, basic electrical hardware without digital functionality, and pure EPC work are excluded unless bundled as part of a digital utility solution or related support.
Segmentation Overview
- By Technology
- Integrated Solutions
- Digital Twin Platforms
- AI and Analytics Suites
- IoT and Edge-Computing Middleware
- Hardware
- Intelligent Grid Devices (IEDs)
- Advanced Metering Infrastructure
- Communication Infrastructure
- Integrated Solutions
- By Sector
- Power Generation
- Transmission and Distribution
- Energy Storage
- Energy Trading and Retail
- By Geography
- North America
- United States
- Canada
- Mexico
- Europe
- Germany
- United Kingdom
- France
- Italy
- NORDIC Countries
- Russia
- Rest of Europe
- Asia-Pacific
- China
- India
- Japan
- South Korea
- ASEAN Countries
- Rest of Asia-Pacific
- South America
- Brazil
- Argentina
- Rest of South America
- Middle East and Africa
- Saudi Arabia
- United Arab Emirates
- South Africa
- Egypt
- Rest of Middle East and Africa
- North America
Data Sources, Market Sizing, and Validation
Desk Research
Desk research was used to set market boundaries and build the initial demand view across regions. We referenced public and official sources such as the International Energy Agency (IEA), U.S. Energy Information Administration (EIA), Eurostat, World Bank indicators, and International Renewable Energy Agency (IRENA) publications to understand grid buildout, renewable additions, and electricity demand patterns.
We also reviewed utility regulator and system operator publications, policy trackers, company annual reports, investor presentations, and press releases, plus credible trade coverage, to map grid digitalization adoption. Select paid subscriptions that aggregate company financials, news, and patent filings were used to cross-check product focus, deal momentum, and technology direction. This desk research list is illustrative, and we consulted other public sources for data collection, validation, and clarification.
Primary Interviews and Surveys
Primary work focused on checking what utilities are actually buying and how spending splits across integrated software platforms, hardware-linked digital layers, and support. We spoke with a mix of solution providers, utility teams, and channel and implementation partners across APAC, EMEA, and the Americas, so assumptions on adoption timing, pricing, and replacement cycles could be corrected when needed.
Distribution of primary research fieldwork respondents
| Company type | Respondent position | Region |
|---|---|---|
| Top tier: 26% | CXOs: 17% | APAC: 46% |
| Mid tier: 57% | Functional/Unit leaders: 26% | EMEA: 31% |
| Smaller Players: 17% | Managers: 57% | Americas: 23% |
Market-Sizing & Forecasting
Market sizing was developed using a top-down approach. We reconstructed electricity system scale and utility digitalization intensity by region, then converted that into addressable spending for digital power utility solutions. To keep totals realistic, we corroborated results using selective bottom-up approximations, including sampling vendor revenue exposure to utilities, cross-checking typical contract sizes, and validating implied spend per utility customer.
Key model inputs included grid modernization investment signals, renewable and distributed energy additions that increase control complexity, smart meter and automation rollout pace, and utility IT and OT convergence trends. We also incorporated regional policy and reliability requirements that influence upgrade timing. Where direct spend indicators were patchy, we used proxy ratios, for example digital spend as a share of grid investment, and then adjusted them after interview feedback.
Forecasting relied on scenario analysis driven by short regional demand factors, and it was anchored on consensus expectations from interviewees on budget cycles, implementation lead times, and pricing progression. Assumptions were kept consistent in USD, with careful treatment of inflation and exchange-rate timing so year-over-year comparisons stay usable.
Data Validation & Update Cycle
Validation used multiple checks that compare model outputs with independent signals such as grid capex trends, utility customer base growth, and the expected pace of modernization programs. Outliers are reviewed at the region and sector level, and if a figure looks inconsistent, we rechecked the underlying drivers and conversion factors before sign-off.
Reports are refreshed annually. Interim adjustments are triggered when material events occur, such as major policy shifts, large utility program awards, or sudden changes in utility spending conditions. Before delivery, a final analyst pass is completed so clients get the most current view aligned with the latest public data and primary feedback.
Mordor Intelligence's Digital Power Utility Market Size Compared Against Other Published Estimates
Published market sizes for digital power utility can differ widely, even when publishers appear to cover the same topic. Much of the gap comes from how each organization defines a qualifying digital utility offering, which years they use as the base, and how they translate total grid spending into recognized vendor revenue.
By tracking utility-facing software and digital layer revenues, and refreshing regional adoption assumptions through interviews, Mordor Intelligence keeps the 2025 total tied to what is implementable across power generation, transmission and distribution, storage, and trading and retail, rather than letting broader smart infrastructure spending inflate the market count.
Benchmark comparison
| Source | Market Size | Gaps in Research Methodology |
|---|---|---|
| Mordor Intelligence | USD 131.60 B (2025) | |
| Industry Research House A | USD 68.14 B (2024) | Uses an earlier base year and a narrower conversion from digitalization activity to recognized market revenue, which can undercount integrated platform and multi-year utility programs. |
| Research Publisher B | USD 36.59 B (2024) | Applies a tighter scope and slower adoption curve, and it appears to treat several utility digital categories as optional add-ons, which pulls down the implied spend per utility. |
The table shows that the biggest differences come from scope boundaries and how adoption and pricing are translated into revenue, not from one simple math step. Once the counted offerings and timing assumptions are explicit, the market size becomes easier to trace back to clear demand signals and to repeat in future updates using the same steps and checks we applied.


Key Questions Answered in the Report
What is the current value of the digital power utility market?
The market was valued at USD 142.68 billion in 2026 and is forecast to reach USD 213.88 billion by 2031.
Which region leads the digital power utility market?
North America held the largest share at 37.45% in 2025, supported by extensive grid-modernisation spending.
What technology segment is growing fastest?
Hardware components such as smart meters and intelligent electronic devices are projected to register an 11.02% CAGR through 2031.
Why is energy storage critical for digital utilities?
Battery systems require sophisticated software to optimise charge-discharge cycles and integrate with renewable generation, driving a 14.2% CAGR for the storage segment.
How are data centres influencing utility digitalisation?
Hyperscale operators offer up to 200 MW of flexible capacity per site, prompting utilities to adopt API-driven platforms for demand response and grid support.
Who are the key players in the digital power utility space?
ABB, Siemens, Schneider Electric, Oracle, Microsoft and IBM lead the field, with specialised firms providing niche analytics, cybersecurity and edge-AI solutions.
Page last updated on:


