Market Overview
| Study Period | 2021 - 2031 |
|---|---|
| Forecast Data Period | 2026 - 2031 |
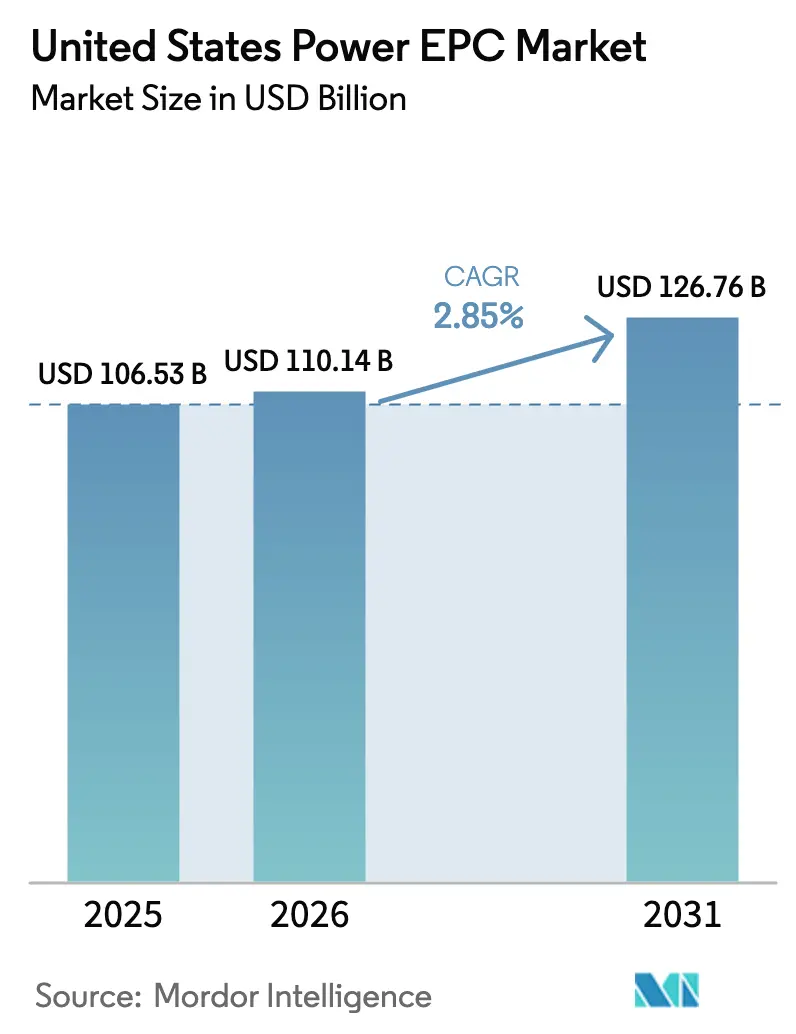
| Base Year Market Size (2025) | USD 106.53 Billion |
| Market Size (2026) | USD 110.14 Billion |
| Market Size (2031) | USD 126.76 Billion |
| Growth Rate (2026 - 2031) | 2.85% CAGR |
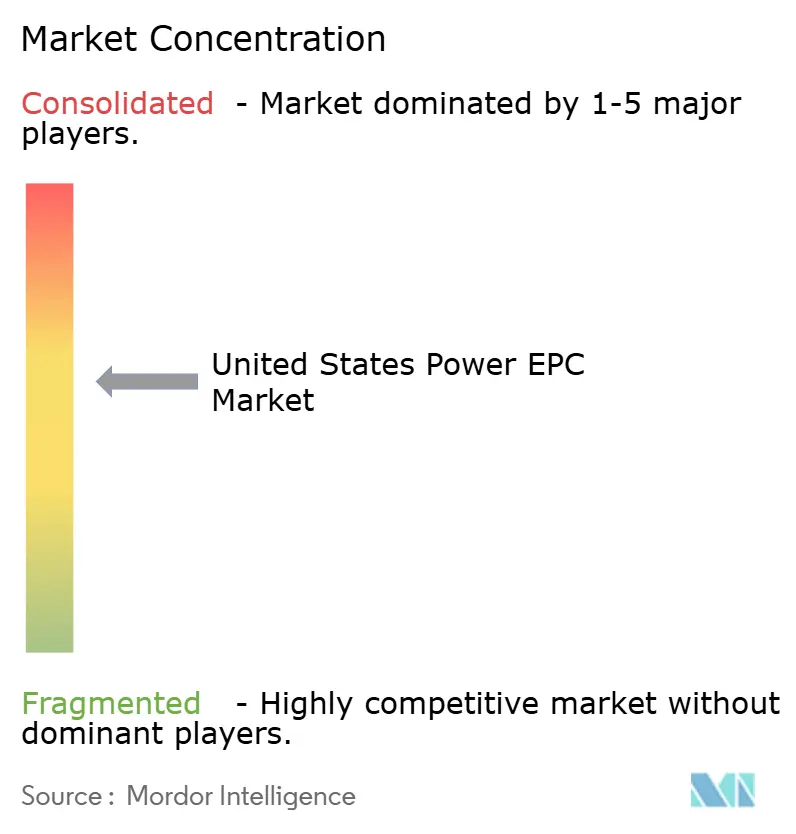
| Market Concentration | Medium |
Major Players *Disclaimer: Major Players sorted in no particular order Image © Mordor Intelligence. Reuse requires attribution under CC BY 4.0. | |
United States Power EPC Market Analysis by Mordor Intelligence
The United States Power EPC Market size is projected to expand from USD 106.53 billion in 2025 and USD 110.14 billion in 2026 to USD 126.76 billion by 2031, registering a CAGR of 2.85% between 2026 to 2031.
Robust federal tax incentives, a multi-gigawatt wave of data-center and green-hydrogen demand, and an aging coal fleet poised for retirement are steering capital toward renewable generation and grid upgrades, while craft-labor scarcity, surety-bond tightening, and high-voltage equipment shortages temper growth. Utility efforts to meet 100% clean-energy mandates are widening the opportunity set for lump-sum turnkey contracts, whereas merchant developers favor cost-reimbursable EPCM models that contain market-price risk. Contractors with prefabrication capacity and domestic-content supply chains are winning bids that capture Inflation Reduction Act bonuses, and standardized small-modular-reactor (SMR) balance-of-plant designs are opening a parallel niche. Transmission bottlenecks and interconnection delays continue to redistribute project activity toward regions with surplus line capacity, reinforcing the importance of early equipment procurement and phased construction sequencing across the US power EPC market.
Key Report Takeaways
- The United States' power EPC market is segmented into power generation EPC and power transmission and distribution (T&D) EPC. Power generation EPC accounted for 63.06% of the market in 2025, and the same is projected to grow at a 3.27% CAGR through 2031.
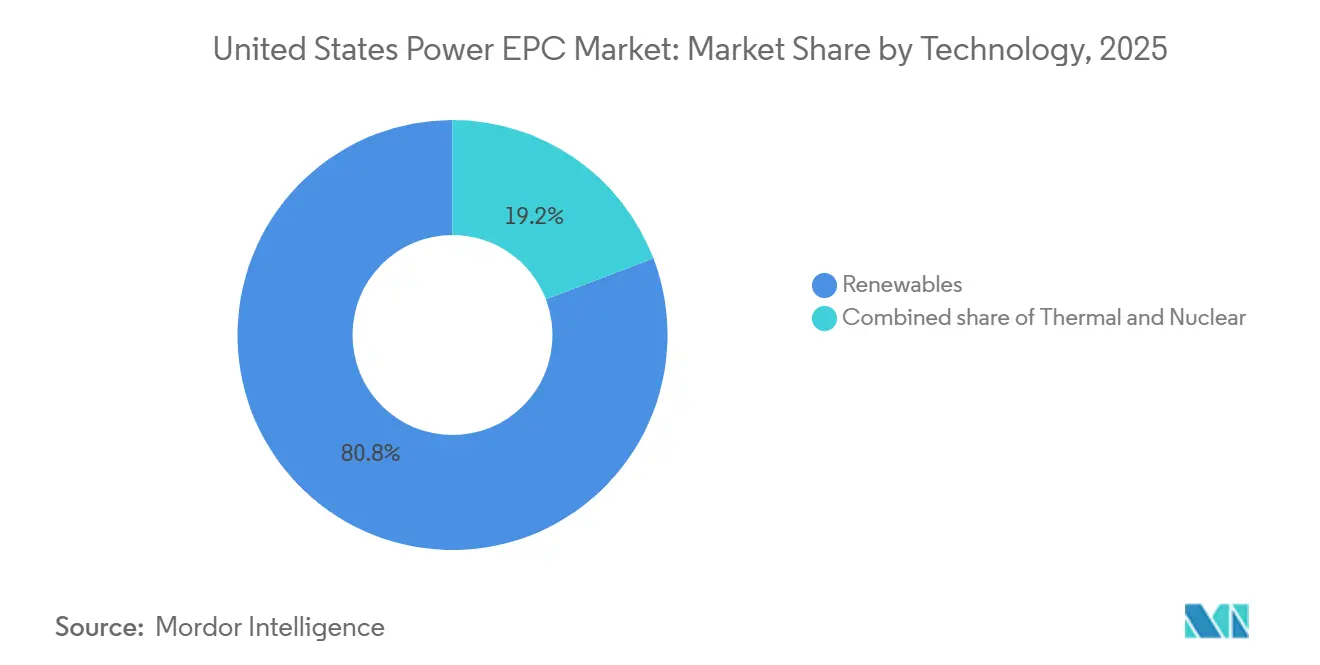
- By technology, renewables commanded 80.8% of 2025 power generation EPC spending and are advancing at a 5.8% CAGR to 2031, far outpacing thermal and nuclear segments.
- By capacity band, projects above 500 MW held 71.5% of the United States power generation EPC market size in 2025, while distributed energy resources below 100 MW are projected to post the fastest 5.3% CAGR through 2031.
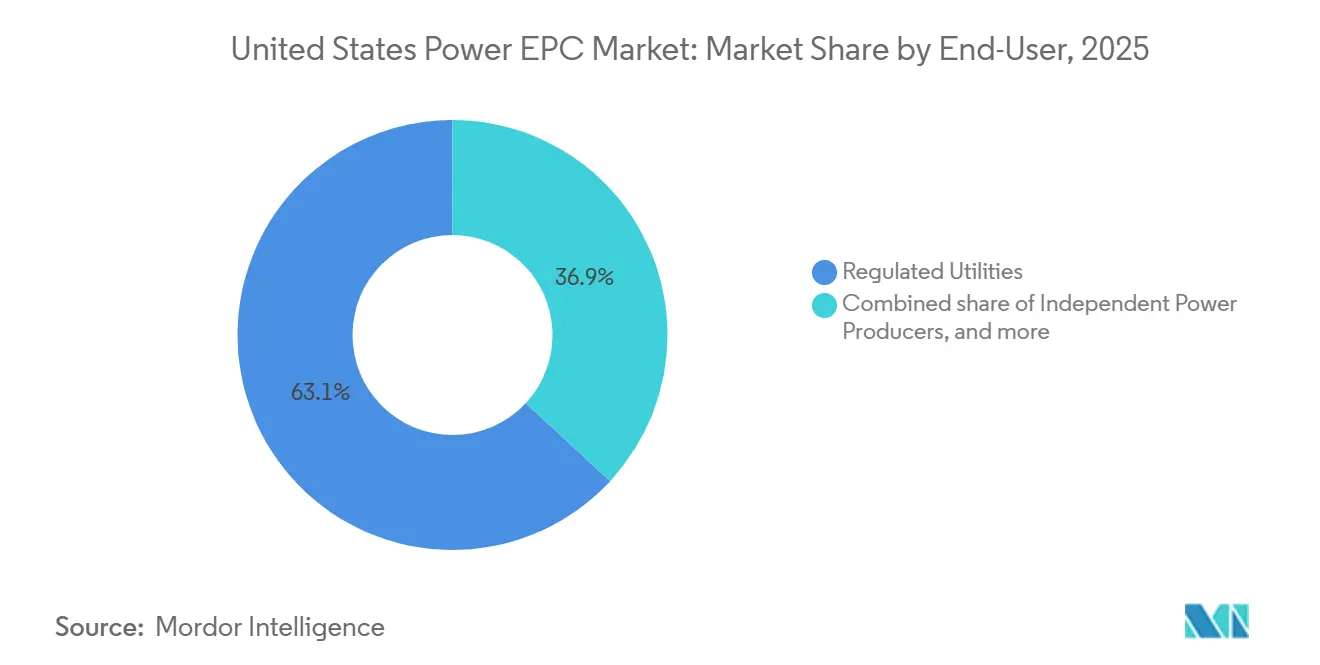
- By end user, regulated utilities represented 63.1% of the United States power generation EPC market size in 2025 and led growth at a 3.7% CAGR on the back of state decarbonization mandates.
Note: Market size and forecast figures in this report are generated using Mordor Intelligence’s proprietary estimation framework, updated with the latest available data and insights as of January 2026.
United States Power EPC Market Trends and Insights
Drivers Impact Analysis*
| Driver | (~) % Impact on CAGR Forecast | Geographic Relevance | Impact Timeline |
|---|---|---|---|
| Inflation Reduction Act–linked clean-energy CAPEX boom | 0.90% | National, centered in Texas, California, Midwest wind corridor | Medium term (2-4 years) |
| Multi-GW data-center and green-hydrogen load additions | 0.60% | Texas, Virginia, California, Pacific Northwest | Short term (≤ 2 years) |
| Replacement wave for >40-yr coal fleet | 0.50% | Midwest, Southeast, Appalachia | Long term (≥ 4 years) |
| Utility decarbonization mandates beyond RPS targets | 0.40% | California, New York, Washington, Colorado, Illinois | Medium term (2-4 years) |
| SMR-ready balance-of-plant standardization | 0.20% | Idaho, Tennessee, Wyoming | Long term (≥ 4 years) |
| Green-steel OEM turnkey contracting emergence | 0.30% | Gulf Coast, Great Lakes | Medium term (2-4 years) |
| Source: Mordor Intelligence | |||
Inflation Reduction Act–Linked Clean-Energy CAPEX Boom Reshapes Project Finance
A cumulative USD 89 billion in clean-energy announcements during 2024-2025 compressed procurement cycles to 12-15 months, requiring EPC firms active in the US power EPC market to order inverters and transformers before debt close.[1]U.S. Department of the Treasury, “Inflation Reduction Act Tax Credit Guidance,” treasury.gov Liquidated-damages bonds linked to commercial-operation milestones now place schedule risk squarely on contractor balance sheets. Domestic-content bonuses encourage suppliers such as Fluor and Kiewit to lock in U.S.-made modules, narrowing vendor pools and favoring firms with long-term purchase agreements. Modular construction that parallelizes site work with factory fabrication is gaining prominence because it mitigates late-stage delivery slippage. These dynamics reinforce a shift toward lump-sum turnkey structures that guarantee price but reward execution certainty across the US power EPC market.
Multi-GW Data-Center and Green-Hydrogen Load Additions Drive Behind-the-Meter EPC
Hyperscale operators signed more than 15 GW of PPAs in 2025, frequently co-locating 200-500 MW solar-plus-storage systems on adjacent parcels to bypass utility queues.[2]Bloomberg News, “Tech Giants Sign Record Energy Deals,” bloomberg.com EPC contractors are packaging design-build-operate offerings with 20-year availability guarantees, generating 12-15% margins, double typical utility-scale levels. Green-hydrogen projects mirror this model; electrolyzer additions reached 2.5 GW in 2025, and turnkey scopes now bundle power-island design with compression, storage, and pipeline tie-ins. Firms with combined petrochemical and renewable portfolios, such as Bechtel, Zachry, and McDermott, hold an execution advantage in the rapidly expanding US power EPC market.
Replacement Wave for Coal Fleet Over 40 Years Old Accelerates Renewable Conversions
The average US coal unit hit 47 years in 2025, prompting 38 GW of retirements by 2030, concentrated in MISO, PJM, and the Southeast.[3]U.S. Energy Information Administration, “Solar and Wind Generation Continue to Grow in 2025,” eia.gov Converting coal sites to solar cuts EPC outlays 15-20% by reusing interconnection and substation assets and trims permitting to roughly 18-24 months. Indiana Michigan Power’s Rockport conversion illustrates how legacy 765 kV ties can underpin 1+ GW solar-storage complexes. Political support in swing states accelerates approvals, while community retraining programs blunt local opposition, bolstering renewable uptake in the US power EPC market.
Utility Decarbonization Mandates Beyond RPS Targets Create Captive Demand
Carbon-neutrality statutes in California, New York, and Washington oblige utilities to secure 25-30 GW of incremental clean capacity by 2040-2045. Regulated utilities can rate-base assets and earn 9-11% returns, encouraging multi-year master service agreements that stabilize workstreams for EPC partners. Southern California Edison’s 5 GW solar-storage RFP in 2025 weighted bids toward domestic content and union labor, signaling the procurement direction likely to persist across the US power EPC market.
Restraints Impact Analysis*
| Restraint | (~) % Impact on CAGR Forecast | Geographic Relevance | Impact Timeline |
|---|---|---|---|
| Scarcity of EPC labor and craft supervision | -0.40% | National, acute in Texas, California, Midwest | Short term (≤ 2 years) |
| Supply-chain bottlenecks for HV equipment | -0.30% | National, longest in ERCOT and CAISO territories | Medium term (2-4 years) |
| ERCOT queue curtailments and interconnection delays | -0.20% | Texas, spillover to SPP and MISO | Short term (≤ 2 years) |
| Surety-bond tightening post-megaproject overruns | -0.20% | National, severe for nuclear and FOAK projects | Long term (≥ 4 years) |
| Source: Mordor Intelligence | |||
Scarcity of EPC Labor and Craft Supervision Compresses Margins
The power-construction workforce shrank 12% between 2020 and 2025, triggering 8-10% annual wage inflation for electricians, pipefitters, and operators. Contractors increasingly pivot to cost-reimbursable structures to pass wage risk to owners, yet margin compression still hits 150-200 basis points. Prefabrication facilities, exemplified by Burns & McDonnell’s 200,000 ft² Kansas City plant, lower field-labor intensity by 25-30% and cut onsite schedules to 12-15 months, making modularization central to competitiveness in the US power EPC market.
Supply-Chain Bottlenecks for HV Equipment Extend Project Schedules
Lead times for 345 kV-plus transformers stretched to 28-36 months in 2025 because domestic capacity lags demand, and only four US manufacturers hold relevant capability. EPC firms now reserve slots 18-24 months ahead of financial close, accepting 10-15% cancellation penalties to secure delivery. Federal loans under the Defense Production Act will not add meaningful capacity until 2027-2028, maintaining a short-term drag on the US power EPC market.
*Our forecasts treat driver/restraint impacts as directional, not additive. The impact forecasts reflect baseline growth, mix effects, and variable interactions.
Segment Analysis
By Technology: Renewables Consolidate Dominance Across Generation EPC
Renewables captured 80.8% of Power Generation EPC value in 2025, and this share is forecast to widen on a 5.8% CAGR through 2031, underpinning the largest slice of the US power generation EPC market size for generation.[4]U.S. Energy Information Administration, “Solar and Wind Generation Continue to Grow in 2025,” eia.gov IRA incentives lower solar and wind LCOE to USD 25-35/MWh, squeezing combined-cycle gas economics. Battery storage turned into the fastest-growing sub-segment as standalone BESS reached 8 GW in 2025, creating a need for contractors versed in NFPA 855 compliance. Offshore wind will expand after 2027 once Jones Act–compliant vessels enter service, although near-term revenue remains modest. Geothermal and SMR niches add diversity but stay sub-scale before 2030.
Thermal generation accounted for 15% of 2025 spend and will inch forward at only 1.2% CAGR because coal-to-gas switching has largely played out, while nuclear sits at 4.2% share and relies mainly on SMR demonstrations and license extensions. Contractors that master modular nuclear construction and high-temperature gas-turbine retrofits stand to capture incremental value but will contribute a smaller fraction to overall US power generation EPC market share growth.


By Capacity Band: Utility-Scale Projects Anchor Value, DERs Lead Growth
Projects above 500 MW controlled 71.5% of the 2025 spend, representing the deepest pool within the US power generation EPC market size for capacity bands. Unit costs of USD 900-1,100/kW and streamlined FERC permitting sustain their economic edge. The 100-499 MW bracket captures 18% share, serving midsize IPPs and municipal utilities. Distributed assets under 100 MW account for 10.5% of the 2025 value yet are poised for a 5.3% CAGR, the swiftest across bands, as manufacturers and data-center operators hedge congestion risk with on-site solar-plus-storage.
California and Texas lead DER adoption thanks to time-of-use pricing that rewards behind-the-meter dispatch. EPC contractors are monetizing premium 12-15% margins by bundling O&M guarantees. Accelerated depreciation under IRA Section 48 further brightens the growth trajectory for these smaller projects inside the US power generation EPC market.
By End User: Regulated Utilities Sustain Largest Share and Growth Momentum
Regulated utilities held 63.1% of 2025 outlays and are projected to increase at a 3.7% CAGR through 2031, preserving the largest segment of the US power generation EPC market share. State commissions allow cost recovery plus an authorized return, making renewables an earnings driver. IPPs occupy a 22% share but face merchant-price volatility that curbs appetite for lengthy builds, steering them toward flexible hybrid plants. Industrial captive power absorbs 9.5% of spend, notably in chemicals, steel, and tech, where reliability premiums justify microgrid investments. Public entities round out 5.4%, often using turnkey EPC to streamline procurement. FERC Order 1920’s long-range planning adds substantial transmission work for all utility classes and reinforces demand depth throughout the US power generation EPC market.
Geography Analysis
Texas, California, and the Midwest generated roughly 55-60% of 2025 capacity additions, anchoring regional leadership within the US power EPC market. ERCOT brought 8.5 GW online, mainly in West Texas and the Panhandle, where 345 kV corridors carry surplus capacity. CAISO added 4.2 GW, but solar curtailment during spring days has popularized hybrid plants that shift energy to evening peaks. MISO delivered 3.8 GW, benefiting from wind resources and coal-plant retirements even though network upgrades valued at USD 15-20 billion remain essential.
PJM logged 3.1 GW in 2025, with Atlantic offshore wind poised for mid-term growth once vessel constraints ease. The Southeast added 2.7 GW, leveraging land availability and 4-6 hour batteries to manage intermittency. The Pacific Northwest’s 1.9 GW expansion leverages hydro balancing but contends with lengthy NEPA reviews that extend schedules. High land costs kept the Northeast to 1.2 GW, yet FERC Order 2023 reforms promise to unlock 5-7 GW of delayed projects by 2028.
Labor and material costs vary sharply by region. Texas and California command 15-20% wage premiums, pressuring margins, while the Midwest enjoys cheaper labor and robust apprenticeship pipelines. Transmission investment tilts toward MISO and SPP, which plan USD 30 billion of upgrades, whereas ERCOT and CAISO require USD 20 billion combined. These disparities influence bidding strategies and capital allocation patterns in the US power EPC market.
Competitive Landscape
The five largest contractors, Fluor, Bechtel, Kiewit, Black & Veatch, and Burns & McDonnell, collectively control 35-40% of revenue, signifying moderate concentration across the US power EPC market. Scale delivers purchasing power for scarce HV equipment and the balance-sheet strength to absorb lump-sum risk. Regional specialists such as Mortenson, Gemma, and Zachry thrive in 100-500 MW projects where local permitting knowledge and labor networks offset smaller balance sheets.
Prefabrication is a key differentiator: Burns & McDonnell’s Kansas City facility and Bechtel’s digital-twin deployment cut engineering hours by 12% and field labor by nearly one-third. Equipment OEMs like Siemens Energy and Mitsubishi Power are encroaching with packaged generation-plus-service offerings that compress procurement cycles and carve away EPC scope.
Emerging disruptors include autonomous grading fleets and drone-based surveys that slash earthwork costs 10-15%. Mortenson’s 300 MW Arizona solar job came in 90 days early, underscoring how modular trackers and pre-wired harnesses can outpace conventional builds. Although incumbents hold procurement and bonding advantages, niche capabilities in data-center microgrids, hydrogen balance-of-plant, and offshore-wind installation offer entry points for agile competitors, preserving a dynamic yet moderately concentrated US power EPC market.
United States Power EPC Industry Leaders
Fluor Corporation
Bechtel Corporation
Kiewit Corporation
Black & Veatch Holdings
Burns & McDonnell
- *Disclaimer: Major Players sorted in no particular order

Recent Industry Developments
- November 2025: Fluor won a USD 1.2 billion lump-sum EPC award from NuScale Power for a 462 MW SMR in Utah, marking a cautious return to nuclear EPC after a 2024 pullback.
- August 2025: Siemens Energy and Mitsubishi Power created a turnkey hydrogen-balance-of-plant alliance targeting 5 GW of electrolyzers by 2030.
- June 2025: Efficient Power Conversion Corporation (EPC) has introduced the EPC91109, a high-performance evaluation board featuring eGaN® FETs. Designed for USB Power Delivery (USB-PD 3.1) applications up to 180 W, it is optimized for compact, thermally efficient designs in laptops, portable devices, and battery-powered systems.
- February 2025: Mortenson finished a 300 MW Arizona solar project 90 days ahead of schedule by leveraging factory-fabricated assemblies.


United States Power EPC Market Report Scope
The power EPC market encompasses the global industry of companies that provide comprehensive execution of power generation, transmission, and distribution projects on a turnkey basis. EPC contractors handle engineering design, equipment procurement, construction, installation, testing, and commissioning of power infrastructure, ensuring project delivery aligns with agreed cost, time, and performance requirements.
The US power EPC market is segmented into power generation EPC and power transmission and distribution EPC. By power generation EPC, the market is segmented into technology, capacity band, and end-user. These segments are further divided as technology- thermal, nuclear, and renewables; capacity band- Up to 100 MW, 100-499 MW, Above 500 MW; end-user- regulated utilities, IPPs, industrial captive power, and public sector/SOE. For each segment, the market sizing and forecasts have been done based on revenue (USD Billion) for all the above segments.
Power Generation EPC
| By Technology | Thermal |
| Nuclear | |
| Renewables | |
| By Capacity Band | Up to 100 MW (DER, micro-grid) |
| 100 to 499 MW | |
| Above 500 MW | |
| By End-User | Regulated Utilities |
| Independent Power Producers | |
| Industrial Captive Power | |
| Public Sector and SOE |
| Power Generation EPC | By Technology | Thermal |
| Nuclear | ||
| Renewables | ||
| By Capacity Band | Up to 100 MW (DER, micro-grid) | |
| 100 to 499 MW | ||
| Above 500 MW | ||
| By End-User | Regulated Utilities | |
| Independent Power Producers | ||
| Industrial Captive Power | ||
| Public Sector and SOE | ||


Key Questions Answered in the Report
How large is the US power EPC market today?
The US power EPC market size reached USD 110.14 billion in 2026 and is forecast to hit USD 126.76 billion by 2031.
Which segment grows fastest through 2031?
Renewable generation EPC expands at a 5.8% CAGR, the quickest among all technology classes.
Why are distributed energy resources attracting attention?
Sub-100 MW projects grow at a 5.3% CAGR because industrial and data-center owners value resilience and congestion-charge avoidance.
What risks are EPC contractors facing in 2026?
Craft-labor shortages, 28-36 month transformer lead times, and higher surety-bond premiums are compressing margins and extending schedules.
How concentrated is contractor competition?
The five largest firms hold about 37% of revenue, indicating moderate concentration and room for regional specialists.
What role does the Inflation Reduction Act play?
IRA tax credits and domestic-content bonuses accelerate project timelines and favor contractors with U.S. supply chains, adding roughly 0.9 percentage points to forecast CAGR.
Page last updated on:


