Market Overview
| Study Period | 2019 - 2031 |
|---|---|
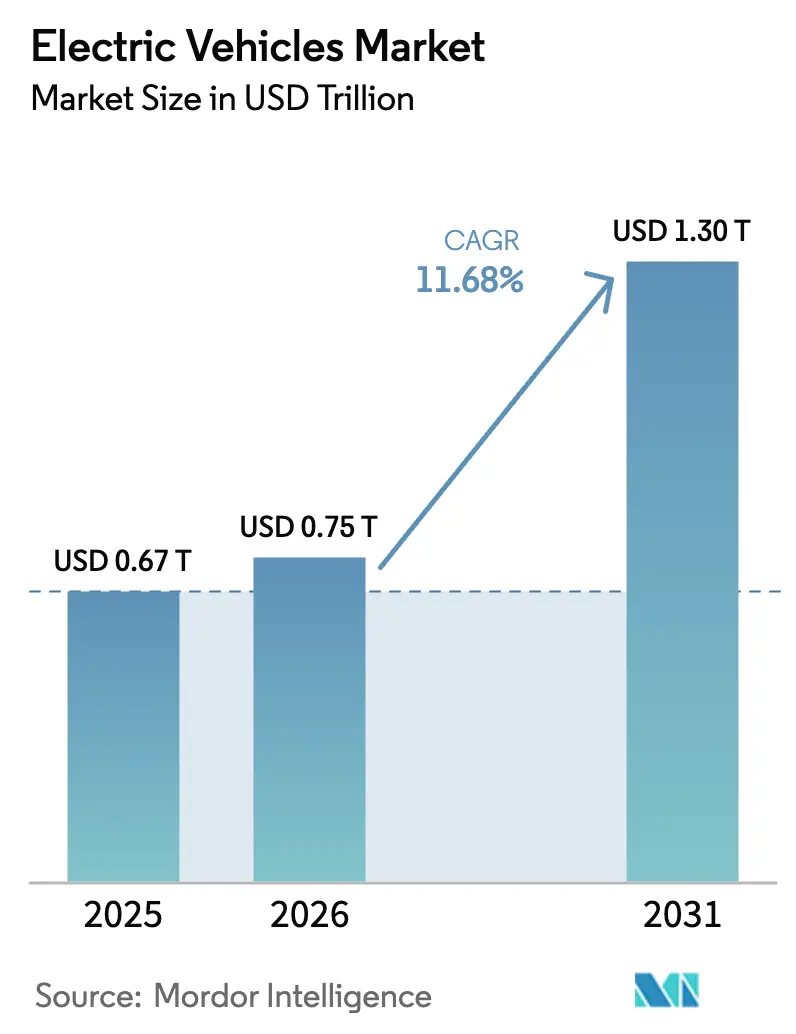
| Market Size (2026) | USD 0.75 Trillion |
| Market Size (2031) | USD 1.30 Trillion |
| Growth Rate (2026 - 2031) | 11.68% CAGR |
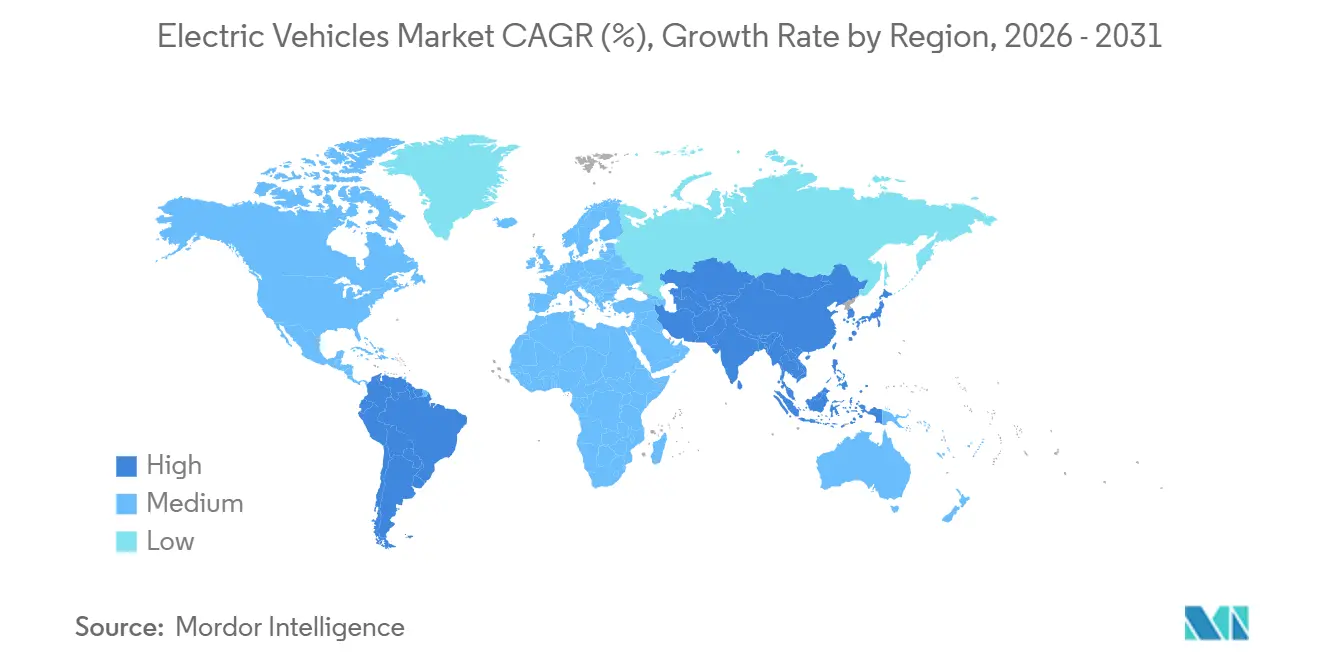
| Fastest Growing Market | Asia Pacific |
| Largest Market | Asia-Pacific |
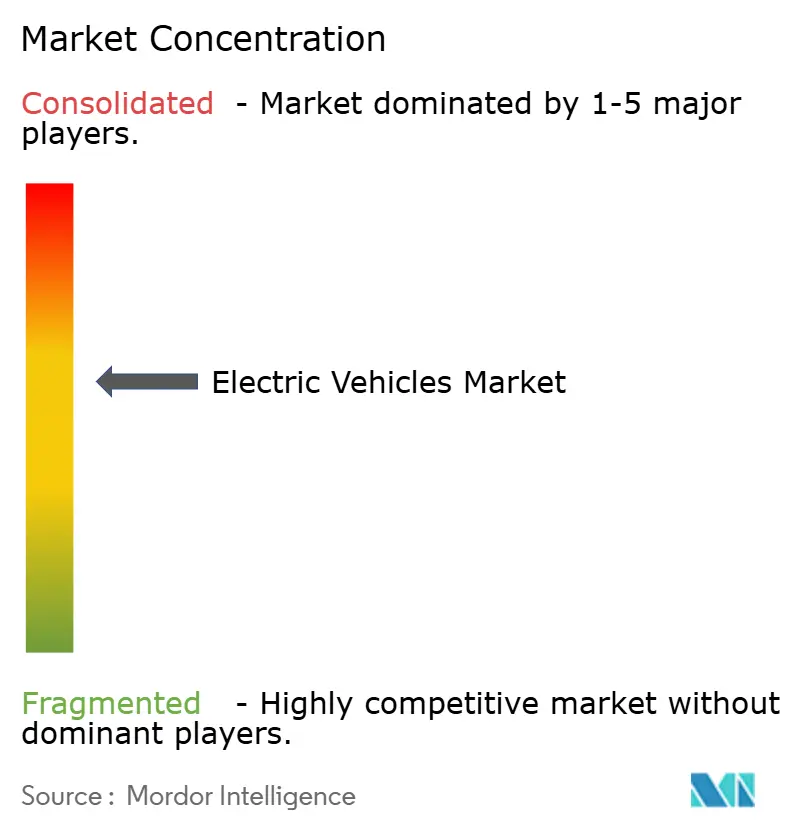
| Market Concentration | Medium |
Major Players *Disclaimer: Major Players sorted in no particular order Image © Mordor Intelligence. Reuse requires attribution under CC BY 4.0. | |
Electric Vehicles Market Analysis by Mordor Intelligence
The electric vehicle market size is expected to grow from USD 0.67 trillion in 2025 to USD 0.75 trillion in 2026 and is forecast to reach USD 1.30 trillion by 2031 at an 11.68% CAGR over 2026–2031. Falling battery-pack prices, the rapid build-out of charging corridors exceeding 350 kW, and stricter fleet-average CO₂ limits in China, the European Union, and the United States support this expansion. Battery electric vehicles already account for more than seven in every ten unit sales, while Asia-Pacific anchors over half of global demand on the back of China’s lithium-iron-phosphate scale-up. Automakers are standardizing 400–800 volt platforms to compress sub-20-minute fast-charge sessions, and commercial fleets are accelerating procurement as total cost of ownership drops below diesel parity. Competitive intensity is moderate: BYD, Tesla, and SAIC together hold roughly one-third of the global market share, yet productive capacity from legacy manufacturers is rising quickly to avoid costly emissions penalties.
Key Report Takeaways
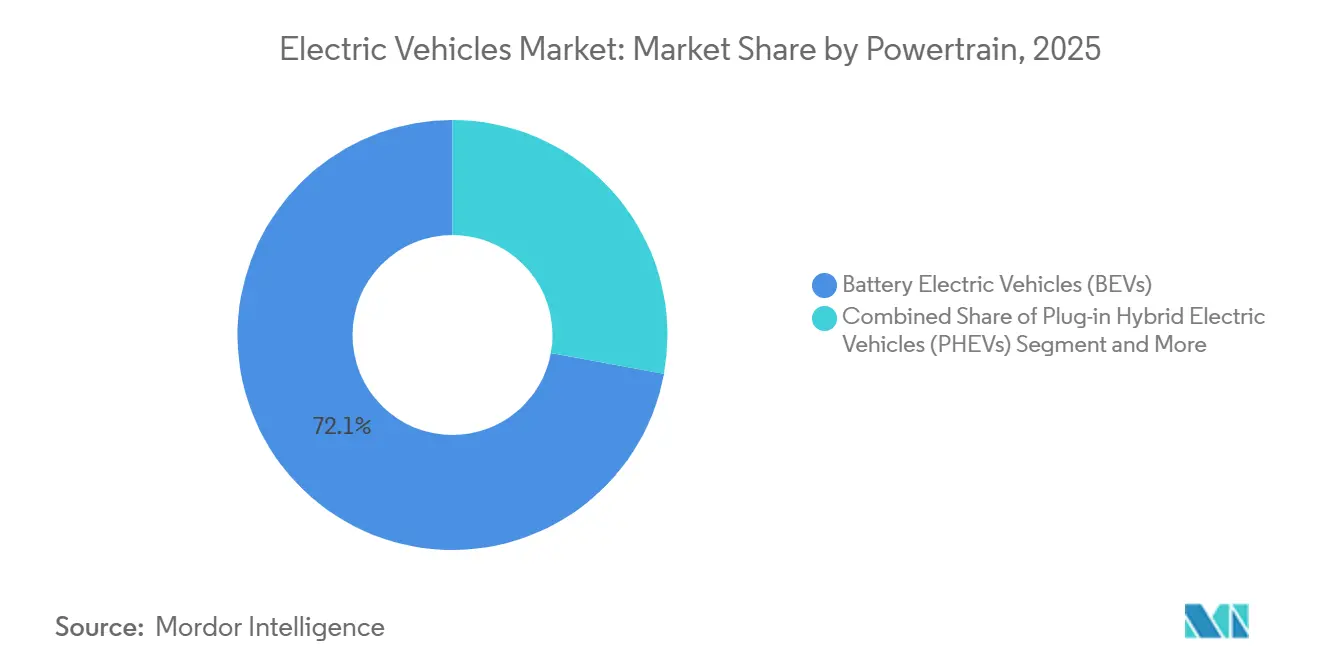
- By powertrain, battery electric vehicles captured a 72.12% electric vehicle market share in 2025 and are projected to expand at a 13.43% CAGR through 2031.
- By vehicle type, passenger cars accounted for 79.28% of 2025 revenue, while commercial vehicles are expected to grow at the fastest rate, with a 12.83% CAGR through 2031 in the electric vehicle market.
- By battery chemistry, Lithium Nickel Manganese Cobalt Oxide (NMC) commanded 42.38% of the electric vehicle market size in 2025, whereas Lithium Iron Phosphate (LFP) is the pace-setter with a 14.93% CAGR to 2031.
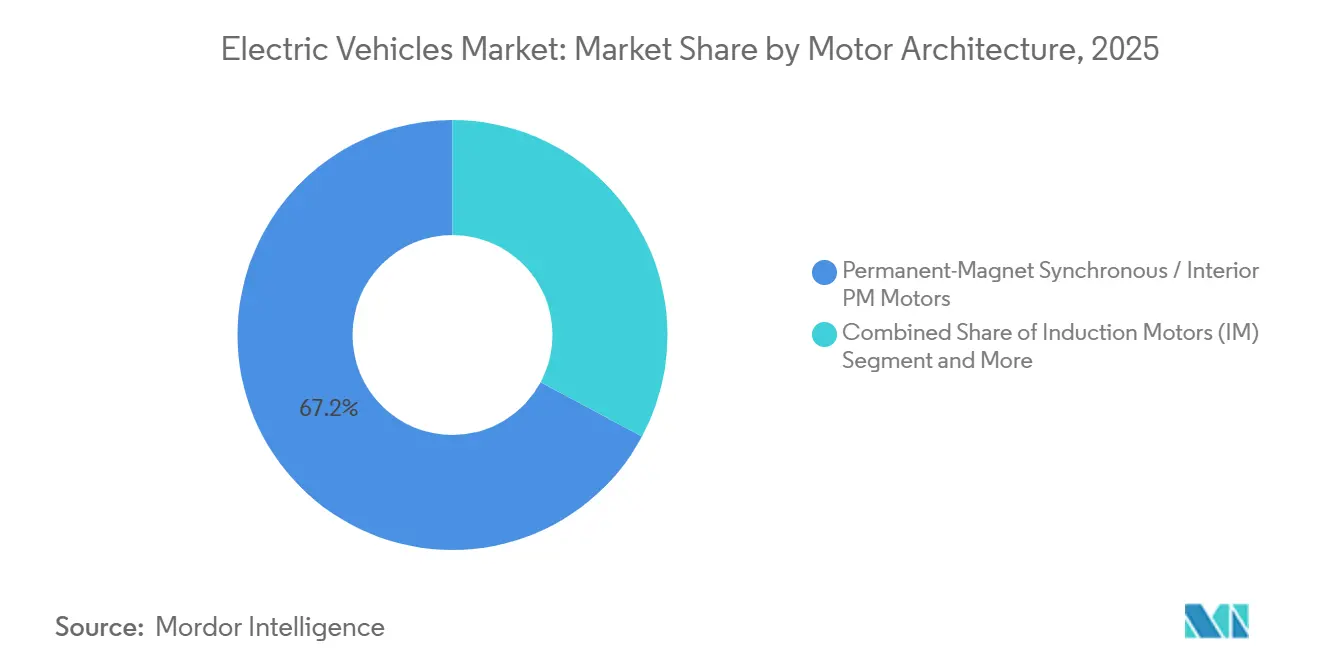
- By motor architecture, Permanent-Magnet Synchronous Motors (PMSM) led with a 67.18% share in 2025 and are projected to progress at a 13.44% CAGR through 2031.
- By range, 200–400 kilometer mid-range models accounted for 40.61% share in 2025, while 400–600 kilometer long-range variants are climbing at a 12.38% CAGR to 2031, reflecting evolving buyer preferences in the electric vehicle market.
- By voltage, 200–400 volt platforms retained a 47.42% share in 2025, and 400–800 volt systems are the fastest risers, with a 15.21% CAGR through 2031.
- By geography, the Asia-Pacific region dominated with a 52.73% share in 2025 and is also the fastest-growing region, with a 13.81% CAGR to 2031.
Note: Market size and forecast figures in this report are generated using Mordor Intelligence’s proprietary estimation framework, updated with the latest available data and insights as of January 2026.
Global Electric Vehicles Market Trends and Insights
Drivers Impact Analysis*
| Driver | (~) % Impact on CAGR Forecast | Geographic Relevance | Impact Timeline |
|---|---|---|---|
| Battery-Pack Cost Below USD 80 /kWh by 2027 | +2.8% | Global, earliest in China and Europe | Medium term (2-4 years) |
| Tightening Fleet-Average CO₂ Standards | +2.3% | China, Europe, California ZEV states | Short term (≤2 years) |
| Ultra-Rapid Above 350 kW Corridor Charging | +1.9% | North America, Europe, rising in Asia-Pacific | Medium term (2-4 years) |
| Corporate-Fleet Decarbonization Mandates | +1.5% | Global, OECD core | Short term (≤2 years) |
| Silicon-Anode Penetration Above 600 km Range | +1.2% | Premium segments, United States, Europe | Long term (≥4 years) |
| Secondary-Use Battery Value Chains | +1.1% | Europe, Japan, global rollout | Long term (≥4 years) |
| Source: Mordor Intelligence | |||


Battery-Pack Cost Deflation Approaching USD 80 /kWh Threshold
Lithium-ion pack prices have declined significantly and are expected to drop further in the coming years. This reduction is attributed to the adoption of cell-to-pack designs, which eliminate module housings, and the scaling up of Chinese LFP output [1]“Cell-to-Pack Technology White Paper,”, CATL, catl.com. Leading manufacturers are already supplying packs at lower costs through long-term contracts. This pricing strategy allows automakers to offer more affordable models without relying on subsidies. With costs approaching parity with internal-combustion powertrains, adoption is accelerating in price-sensitive regions such as Southeast Asia and Latin America. Additionally, solid-state pilot lines from key players are targeting even lower costs by the end of the decade, supporting premium offerings with extended range. As these cost trends continue, electric vehicles are set to maintain a substantial price advantage over traditional drivetrains.
Tightening Fleet-Average CO₂ Standards Across Major Markets
China increased its dual-credit quota, while the EU tightened its emissions limit. Meanwhile, California's Advanced Clean Cars II is set to take effect soon[2]“Regulation on Alternative Fuels Infrastructure,”, European Commission, ec.europa.eu. These measures are driving significant investments into zero-emission initiatives. In Europe, non-compliance penalties have risen significantly, creating a substantial threat that is shifting R&D priorities for automotive giants like Volkswagen, Stellantis, and General Motors. As a result, these legacy OEMs are accelerating the development of skateboard platforms and shelving plans for new internal-combustion projects. Regulatory pressures have become a key factor shaping the direction of the electric vehicle market.
Ultra-Rapid Charging Infrastructure Along Freight Corridors
The United States has recently seen the activation of numerous new high-capacity charging stations. Meanwhile, IONITY expanded its presence in Europe, strategically placing chargers at regular intervals along TEN-T routes[3]“Network Progress Update 2024,”, IONITY, ionity.eu. Tesla's latest Supercharger model significantly enhances range while charging in a short time. Concurrently, the EU's Alternative Fuels Regulation has set a firm deadline for ensuring corridor coverage. Logistics fleets are now optimizing operations, aligning partial top-ups with mandated driver rest breaks, effectively reducing downtime. This extensive network expansion not only alleviates range anxiety but also supports the projected growth rate for commercial electrification.
Silicon-Anode Penetration Enabling Ultra-Long-Range Segments
Mercedes-Benz's EQXX prototype achieved a significant range on a single charge, thanks to silicon-carbon composite anodes that boosted energy density substantially without expanding pack volume. Sila Nanotechnologies delivered production-grade material, aiming for a notable increase in energy density in the future. Concerns about early-cycle life have diminished as nano-structured silicon, paired with polymer binders, surpasses a critical performance benchmark. With commercialization gaining momentum, an extended range is now standard in mid-segment crossovers, alleviating range anxiety and steering buyers towards higher-range variants across the electric vehicle market.
Restraints Impact Analysis*
| Restraint | (~) % Impact on CAGR Forecast | Geographic Relevance | Impact Timeline |
|---|---|---|---|
| Critical-Minerals Concentration Risk | -1.8% | Global, acute in Europe and United States | Medium term (2-4 years) |
| Grid-Upgrade Bottlenecks | -1.4% | North America, Europe, Asia-Pacific metros | Short term (≤2 years) |
| Residual-Value Uncertainty in Emerging Markets | -0.9% | South America, South-east Asia, Middle East and Africa | Medium term (2-4 years) |
| Cybersecurity and OTA Compliance Cost | -0.7% | Global, strict in Europe | Short term (≤2 years) |
| Source: Mordor Intelligence | |||
Critical-Minerals Supply-Chain Concentration Risk
Indonesia and the Democratic Republic of the Congo, which hold the majority of nickel and cobalt reserves, have been the epicenter of price fluctuations in response to policy shifts shaping the electric vehicle market. Nickel prices surged significantly due to export restrictions from Indonesia, only to drop sharply afterward. As OEMs race to meet the Inflation Reduction Act's stipulations, they're turning to sources under free-trade agreements. Notably, General Motors has made a significant move, investing heavily in Lithium Americas’ Thacker Pass project. Yet, despite these diversification efforts, China continues to dominate, refining a substantial portion of the world's lithium and cobalt. This dominance not only renders the supply chain susceptible but also tempers anticipated margin increases.
Grid-Upgrade Bottlenecks at Distribution Level
California utilities recorded numerous pending interconnection requests for commercial fast-charge sites, with median wait times exceeding several months, creating bottlenecks in the electric vehicle market. Urban transformers, typically designed for low peak household loads, face challenges when a single dispenser demands as many as dozens of homes. While smart-charging tariffs help alleviate some peak demands, they can compromise user convenience, particularly for residents in apartments. The Infrastructure Investment and Jobs Act has allocated significant funding for grid resilience. However, with distribution build-outs extending far into the future, there's a limitation on near-term adoption in the high-density areas of Europe and North America.
*Our forecasts treat driver/restraint impacts as directional, not additive. The impact forecasts reflect baseline growth, mix effects, and variable interactions.
Segment Analysis
By Powertrain: BEVs Consolidate Leadership
Battery electric vehicles held 72.12% electric vehicle market share in 2025 and are tracking a 13.43% CAGR through 2031. Pure-electric architectures capitalize on falling LFP costs and corridor charging, while plug-in hybrids plateau as dual-powertrain complexity loses favor. Fuel-cell formats remain constrained by a scarcity of hydrogen stations, delivering fewer than 15,000 global units in 2024. Phase-out timelines in China and California reduce regulatory credits for hybrids beyond 2030, thereby cementing the primacy of BEVs.
Plug-in hybrids still serve rural areas with sparse charging stations, but the price delta erodes as silicon-anode BEVs reach a 600 km range. Fleet buyers show a limited appetite for maintaining two drivetrains per vehicle, which curbs volume growth. Fuel cell units may find long-haul niches once green hydrogen costs fall, yet that scenario sits outside the forecast window. Net effect: The electric vehicle market continues its shift toward dedicated battery platforms on a larger scale.


By Vehicle Type: Commercial Growth Outpaces Passenger Dominance
Passenger cars accounted for 79.28% of 2025 revenue, while commercial vehicles posted the fastest 12.83% CAGR to 2031 in the electric vehicle market. Parcel operators and municipal bus fleets lock in multi-year contracts, insulating production from consumer cycles. Light commercial vans, such as the Ford E-Transit and Mercedes-Benz eSprinter, achieve 40–50% lower running costs per kilometer compared to their diesel rivals, accelerating corporate fleet conversions.
Medium- and heavy-duty trucks are crossing the economic threshold as battery costs decline and urban zero-emission zones expand across the electric vehicle market. BYD’s 12-meter electric bus already anchors 90% of new urban bus sales in China. Passenger SUVs maintain volume leadership due to consumer preference for cargo versatility; however, sedans and hatchbacks see shrinking model lineups as OEMs redirect capital to crossovers and commercial chassis.
By Battery Chemistry: LFP Accelerates, NMC Holds Premium Niche
Lithium Nickel Manganese Cobalt Oxide (NMC) chemistry safeguarded a 42.38% share of the electric vehicle market size in 2025. Still, Lithium Iron Phosphate (LFP) is growing at a 14.93% CAGR, driven by its cost and thermal stability advantages. BYD’s Blade Battery powers sub-USD 10,000 models in China, while Tesla adopted LFP for standard-range trims in 2024. NMC remains favored in premium segments requiring a range of over 500 km, yet high cobalt content and ESG scrutiny hinder rapid expansion.
Innovation is narrowing LFP’s density gap, with silicon-anode overlays pushing 180–200 Wh/kg at pack level, eroding NMC’s historical range edge. Sodium-ion and LMFP chemistries stay in pilot phases but demonstrate the industry’s hunt for cobalt-free options. On current trajectories, NMC is likely to fall below a 35% share by 2031, making LFP the mainstream default for mass-volume electric vehicles in the market.
By Motor Architecture: PMSM Efficiency Keeps It in Front
Permanent-Magnet Synchronous Motors (PMSM) units held a 67.18% share in 2025 and are expected to retain a 13.44% CAGR, as rare-earth-lean designs maintain a 40 Nm/kg torque density. Induction motors, free of rare earths, power Tesla rear axles and performance trims but consume 3–5% more highway energy. Dual-motor layouts, pairing a PMSM front with an induction rear, balance efficiency and peak power, a formula that has spread to VW and Hyundai nameplates.
Switched reluctance and axial-flux designs reside in low-volume niches where packaging or cost constraints govern the selection. Mercedes-Benz’s axial-flux YASA units show promise for ultra-slim sports cars but await larger manufacturing scale. Regulators’ tighter energy-consumption labels favor PMSM’s superior partial-load efficiency, anchoring its dominant role in the electric vehicle market.
By Range: Long-Range 400–600 km Segment Surges
Mid-range 200–400 km models captured a 40.61% share in 2025, while vehicles offering 400–600 km surged at a 12.38% CAGR, thanks to gains in silicon-anode density. Short-range city cars are losing ground as pack costs fall and buyers prioritize flexibility for occasional long trips. Ultra-long nameplates exceeding 600 km, such as the Lucid Air, cater to luxury segments but may face diminishing utility where 350 kW chargers are spread.
Volkswagen’s MEB platform and Tesla’s 4680 cell enable OEMs to market multiple range steps off a single architecture, skewing the mix toward longer-range SKUs. As public charger density exceeds one dispenser per ten EVs in mature markets, the optimal cost-benefit ratio gravitates towards the 400–600 km sweet spot, shaping product planning across the electric vehicle market.
By Voltage: 400–800 V Platforms Go Mainstream
Mid-voltage 200–400 V systems still account for 47.42% of 2025 builds, but 400–800 V designs are growing at a 15.21% CAGR, delivering top-ups of 10–80% in under 18 minutes. Hyundai’s E-GMP, GM’s Ultium, and Porsche’s 800 V architecture lead adoption, while silicon-carbide inverter prices fall on expanding wafer output.
Ultra-high-voltage layouts reduce harness weight significantly, primarily focusing on premium SUVs and sports sedans. Meanwhile, low-voltage legacy platforms face obsolescence as users now demand faster charging speeds. This voltage division solidifies a dual-tier supply chain in the electric vehicle market: cost-effective LFP models and high-end NMC flagship vehicles.
Geography Analysis
The Asia-Pacific region commanded 52.73% of the 2025 volume and is projected to track a 13.81% CAGR reinforcing its leadership in the electric vehicle market, as China’s LFP blade battery and India’s Production Linked Incentive program add domestic capacity. China led the charge with a significant number of EVs sold, while South Korea's Hyundai and Kia exported a substantial volume of units. Japan, with relatively low market penetration, is increasing subsidies to boost demand. Meanwhile, Thailand and Indonesia are emerging as key assembly hubs in Southeast Asia, luring OEMs with tax breaks and easy access to raw materials, solidifying their dominance in the electric vehicle arena.
North America accounted for a notable share of the market. Policy measures are poised to boost local assembly and component sourcing. Tesla commands a significant portion of the United States BEV market, but GM, Ford, and Stellantis are on track to achieve higher production rates in the coming years. Canada's ZEV mandate is in sync with California's schedule, and Mexico's upcoming Gigafactory is capitalizing on regional trade advantages. While rural charging gaps and distribution grid challenges pose hurdles, substantial federal and state incentives are helping to accelerate infrastructure development.
Europe secured a considerable market share, spearheaded by Norway's high new-car penetration and Germany's notable progress. Stricter CO₂ targets and the "fit-for-55" initiative are shaping OEM strategies. Volkswagen, Stellantis, and Renault are eyeing a combined annual output of a significant number of EVs in the near future. The United Kingdom is pushing for a high percentage of zero-emission sales within the decade, and Eastern Europe is rapidly installing corridor chargers with EU funds. In the Middle East and Africa, while still in nascent stages, Saudi Arabia's investment in Lucid and Dubai's move to electrify taxis hint at a burgeoning electric vehicle landscape.

Competitive Landscape
The electric vehicle market is moderately concentrated, with BYD, Tesla, and SAIC collectively accounting for a significant share of the global volume. Leveraging its vertical integration, BYD enjoys a substantial cost advantage, enabling it to profitably offer an affordable hatchback in China. Meanwhile, Tesla, with its expansive multi-continent Gigafactory network, aims to significantly increase production. However, it is facing challenges as competitive pricing pressures diminish its market share in both Europe and its home market of China.
To avoid hefty regulatory fines, legacy OEMs are accelerating their platform rollouts. Volkswagen is making a significant investment, committing heavily to both battery supply chains and the development of software-defined vehicles. Concurrently, Hyundai is strategically combining its domestic production with assembly lines in the U.S., ensuring they qualify for lucrative tax credits. Looking ahead, General Motors has set an ambitious goal of achieving a complete transition to zero-emission light-duty vehicles and is bolstering its mineral supplies through projects based in North America.
New players, such as Rivian, Lucid, Xpeng, and NIO, are carving out premium niches for themselves. They're capitalizing on advanced ADAS technologies and the lucrative market for over-the-air feature sales. However, the industry isn't without its challenges. Rising capital burn rates and the costs associated with cybersecurity compliance are putting pressure on less robust players. A case in point is Fisker, which succumbed to these pressures and declared bankruptcy. On the innovation front, patent filings for solid-state batteries have surged significantly. Yet, the landscape hints at a wave of consolidation, especially as some OEMs, under-capitalized and stretched thin, grapple with funding non-recurring engineering across diverse platforms.
Electric Vehicles Industry Leaders
Stellantis N.V.
Tesla Inc.
Toyota Motor Corporation
Volkswagen AG
BYD Company Ltd.
- *Disclaimer: Major Players sorted in no particular order

Recent Industry Developments
- December 2025: Mercedes-Benz has introduced its latest electric SUV, the GLB. The GLB 250+ and the GLB 350 4MATIC, both equipped with EQ Technology, are set to hit the market in spring 2026. Following their debut, the GLB lineup will expand to include a budget-friendly electric variant and a cutting-edge hybrid model featuring 48-volt technology.
- December 2025: Following the introduction of the Oli concept in 2022, Citroen has now unveiled the ELO concept car, showcasing its vision for the future of mobility. The ELO, a fully electric vehicle, draws inspiration from compact MPVs. Built on a dedicated EV architecture, it features a rear-axle motor. This design choice enables the ELO's compact 4.10-meter exterior footprint to house an exceptionally spacious and ultra-modular interior, accommodating up to six occupants.
- December 2025: Ford Pro has unveiled significant enhancements to its E-Transit Custom electric van in Europe. Key upgrades include the introduction of an all-wheel-drive (AWD) system and a larger battery, promising an extended range and quicker charging times. These updates are set to roll out in early 2026. The revamped E-Transit Custom will offer three power options: 100 kW, 160 kW, and 210 kW.


Global Electric Vehicles Market Report Scope
The scope inludes segmentation by powertrain (BEV, PHEV, and FCEV), vehicle type (passenger car, and commercial vehicle), battery chemistry (LFP, NMC, and More), motor architecture (PMSM, induction, and others), range (short, mid, long, and ultra-long), voltage (low, mid, high, and ultra-high), and geography. The market forecasts are provided in both value (USD) and volume (Units).
By Powertrain
| Battery Electric Vehicles (BEVs) |
| Plug-in Hybrid Electric Vehicles (PHEVs) |
| Fuel Cell Electric Vehicles (FCEVs) |
By Vehicle Type
| Passenger Car | Hatchback |
| Sedan | |
| Sports Utility Vehicle/Crossover | |
| Multi-purpose Vehicle | |
| Commercial Vehicle | Light Commercial Vehicle |
| Medium and Heavy-duty Truck | |
| Bus |
By Battery Chemistry
| Lithium Iron Phosphate (LFP) |
| Lithium Nickel Manganese Cobalt Oxide (NMC) |
| Lithium Nickel Cobalt Aluminum Oxide (NCA) |
| Others |
By Motor Architecture
| Permanent-Magnet Synchronous Motors (PMSM/IPM) |
| Induction Motors (IM) |
| Others (SRM, Axial Flux, etc.) |
By Range
| Short (0-200 km) |
| Mid (200-400 km) |
| Long (400-600 km) |
| Ultra-Long (Above 600 km) |
By Voltage
| Low Voltage (Below 200 V) |
| Mid Voltage (200-400 V) |
| High Voltage (400-800 V) |
| Ultra-High Voltage (Above 800 V) |
By Geography
| North America | United States |
| Canada | |
| Rest of North America | |
| South America | Brazil |
| Argentina | |
| Rest of South America | |
| Europe | Germany |
| United Kingdom | |
| France | |
| Italy | |
| Spain | |
| Rest of Europe | |
| Asia-Pacific | China |
| India | |
| Japan | |
| South Korea | |
| Rest of Asia-Pacific | |
| Middle-East and Africa | United Arab Emirates |
| Saudi Arabia | |
| South Africa | |
| Turkey | |
| Rest of Middle-East and Africa |
| By Powertrain | Battery Electric Vehicles (BEVs) | |
| Plug-in Hybrid Electric Vehicles (PHEVs) | ||
| Fuel Cell Electric Vehicles (FCEVs) | ||
| By Vehicle Type | Passenger Car | Hatchback |
| Sedan | ||
| Sports Utility Vehicle/Crossover | ||
| Multi-purpose Vehicle | ||
| Commercial Vehicle | Light Commercial Vehicle | |
| Medium and Heavy-duty Truck | ||
| Bus | ||
| By Battery Chemistry | Lithium Iron Phosphate (LFP) | |
| Lithium Nickel Manganese Cobalt Oxide (NMC) | ||
| Lithium Nickel Cobalt Aluminum Oxide (NCA) | ||
| Others | ||
| By Motor Architecture | Permanent-Magnet Synchronous Motors (PMSM/IPM) | |
| Induction Motors (IM) | ||
| Others (SRM, Axial Flux, etc.) | ||
| By Range | Short (0-200 km) | |
| Mid (200-400 km) | ||
| Long (400-600 km) | ||
| Ultra-Long (Above 600 km) | ||
| By Voltage | Low Voltage (Below 200 V) | |
| Mid Voltage (200-400 V) | ||
| High Voltage (400-800 V) | ||
| Ultra-High Voltage (Above 800 V) | ||
| By Geography | North America | United States |
| Canada | ||
| Rest of North America | ||
| South America | Brazil | |
| Argentina | ||
| Rest of South America | ||
| Europe | Germany | |
| United Kingdom | ||
| France | ||
| Italy | ||
| Spain | ||
| Rest of Europe | ||
| Asia-Pacific | China | |
| India | ||
| Japan | ||
| South Korea | ||
| Rest of Asia-Pacific | ||
| Middle-East and Africa | United Arab Emirates | |
| Saudi Arabia | ||
| South Africa | ||
| Turkey | ||
| Rest of Middle-East and Africa | ||


Market Definition
- Vehicle Type - The category includes passenger cars, commercial vehicles, and two-wheelers.
- Vehicle Body Type - TUnder Passenger Cars, the category includes Hatchbacks, Sedans, Sports Utility Vehicles, and Multi-purpose Vehicles; for Commercial Vehicles, it covers Light Commercial Pick-up Trucks, Light Commercial Vans, Medium-duty Commercial Trucks, Heavy-duty Commercial Trucks, and Medium and Heavy Duty Buses; and for Two-Wheelers, it encompasses Scooters and Motorcycles.
- Fuel Category - The category exclusively covers electric propulsion systems, including various types such as HEV (Hybrid Electric Vehicles), PHEV (Plug-in Hybrid Electric Vehicles), BEV (Battery Electric Vehicles), and FCEV (Fuel Cell Electric Vehicles).
| Keyword | Definition |
|---|---|
| Electric Vehicle (EV) | A vehicle which uses one or more electric motors for propulsion. Includes cars, buses, and trucks. This term includes all-electric vehicles or battery electric vehicles and plug-in hybrid electric vehicles. |
| BEV | A BEV relies completely on a battery and a motor for propulsion. The battery in the vehicle must be charged by plugging it into an outlet or public charging station. BEVs do not have an ICE and hence are pollution-free. They have a low cost of operation and reduced engine noise as compared to conventional fuel engines. However, they have a shorter range and higher prices than their equivalent gasoline models. |
| PEV | A plug-in electric vehicle is an electric vehicle that can be externally charged and generally includes all-electric vehicles as well as plug-in hybrids. |
| Plug-in Hybrid EV | A vehicle that can be powered either by an ICE or an electric motor. In contrast to normal hybrid EVs, they can be charged externally. |
| Internal combustion engine | An engine in which the burning of fuels occurs in a confined space called a combustion chamber. Usually run with gasoline/petrol or diesel. |
| Hybrid EV | A vehicle powered by an ICE in combination with one or more electric motors that use energy stored in batteries. These are continually recharged with power from the ICE and regenerative braking. |
| Commercial Vehicles | Commercial vehicles are motorized road vehicles designed for transporting people or goods. The category includes light commercial vehicles (LCVs) and medium and heavy-duty vehicles (M&HCV). |
| Passenger Vehicles | Passenger cars are electric motor– or engine-driven vehicles with at least four wheels. These vehicles are used for the transport of passengers and comprise no more than eight seats in addition to the driver’s seat. |
| Light Commercial Vehicles | Commercial vehicles that weigh less than 6,000 lb (Class 1) and in the range of 6,001–10,000 lb (Class 2) are covered under this category. |
| M&HDT | Commercial vehicles that weigh in the range of 10,001–14,000 lb (Class 3), 14,001–16,000 lb (Class 4), 16,001–19,500 lb (Class 5), 19,501–26,000 lb (Class 6), 26,001–33,000 lb (Class 7) and above 33,001 lb (Class 8) are covered under this category. |
| Bus | A mode of transportation that typically refers to a large vehicle designed to carry passengers over long distances. This includes transit bus, school bus, shuttle bus, and trolleybuses. |
| Diesel | It includes vehicles that use diesel as their primary fuel. A diesel engine vehicle have a compression-ignited injection system rather than the spark-ignited system used by most gasoline vehicles. In such vehicles, fuel is injected into the combustion chamber and ignited by the high temperature achieved when gas is greatly compressed. |
| Gasoline | It includes vehicles that use gas/petrol as their primary fuel. A gasoline car typically uses a spark-ignited internal combustion engine. In such vehicles, fuel is injected into either the intake manifold or the combustion chamber, where it is combined with air, and the air/fuel mixture is ignited by the spark from a spark plug. |
| LPG | It includes vehicles that use LPG as their primary fuel. Both dedicated and bi-fuel LPG vehicles are considered under the scope of the study. |
| CNG | It includes vehicles that use CNG as their primary fuel. These are vehicles that operate like gasoline-powered vehicles with spark-ignited internal combustion engines. |
| HEV | All the electric vehicles that use batteries and an internal combustion engine (ICE) as their primary source for propulsion are considered under this category. HEVs generally use a diesel-electric powertrain and are also known as hybrid diesel-electric vehicles. An HEV converts the vehicle momentum (kinetic energy) into electricity that recharges the battery when the vehicle slows down or stops. The battery of HEV cannot be charged using plug-in devices. |
| PHEV | PHEVs are powered by a battery as well as an ICE. The battery can be charged through either regenerative breaking using the ICE or by plugging into some external charging source. PHEVs have a better range than BEVs but are comparatively less eco-friendly. |
| Hatchback | These are compact-sized cars with a hatch-type door provided at the rear end. |
| Sedan | These are usually two- or four-door passenger cars, with a separate area provided at the rear end for luggage. |
| SUV | Popularly known as SUVs, these cars come with four-wheel drive, and usually have high ground clearance. These cars can also be used as off-road vehicles. |
| MPV | These are multi-purpose vehicles (also called minivans) designed to carry a larger number of passengers. They carry between five and seven people and have room for luggage too. They are usually taller than the average family saloon car, to provide greater headroom and ease of access, and they are usually front-wheel drive. |


Research Methodology
Mordor Intelligence follows a four-step methodology in all its reports.
- Step-1: Identify Key Variables: To build a robust forecasting methodology, the variables and factors identified in Step-1 are tested against available historical market numbers. Through an iterative process, the variables required for market forecast are set and the model is built based on these variables.
- Step-2: Build a Market Model: Market-size estimations for the historical and forecast years have been provided in revenue and volume terms. Market revenue is calculated by multiplying the sales volume with their respective average selling price (ASP). While estimating ASP factors like average inflation, market demand shift, manufacturing cost, technological advancement, and varying consumer preference, among others have been taken into account.
- Step-3: Validate and Finalize: In this important step, all market numbers, variables, and analyst calls are validated through an extensive network of primary research experts from the market studied. The respondents are selected across levels and functions to generate a holistic picture of the market studied.
- Step-4: Research Outputs: Syndicated Reports, Custom Consulting Assignments, Databases & Subscription Platforms.


