United Arab Emirates Hybrid And Electric Vehicles Market Size and Share
Market Overview
| Study Period | 2019 - 2031 |
|---|---|
| Forecast Data Period | 2026 - 2031 |
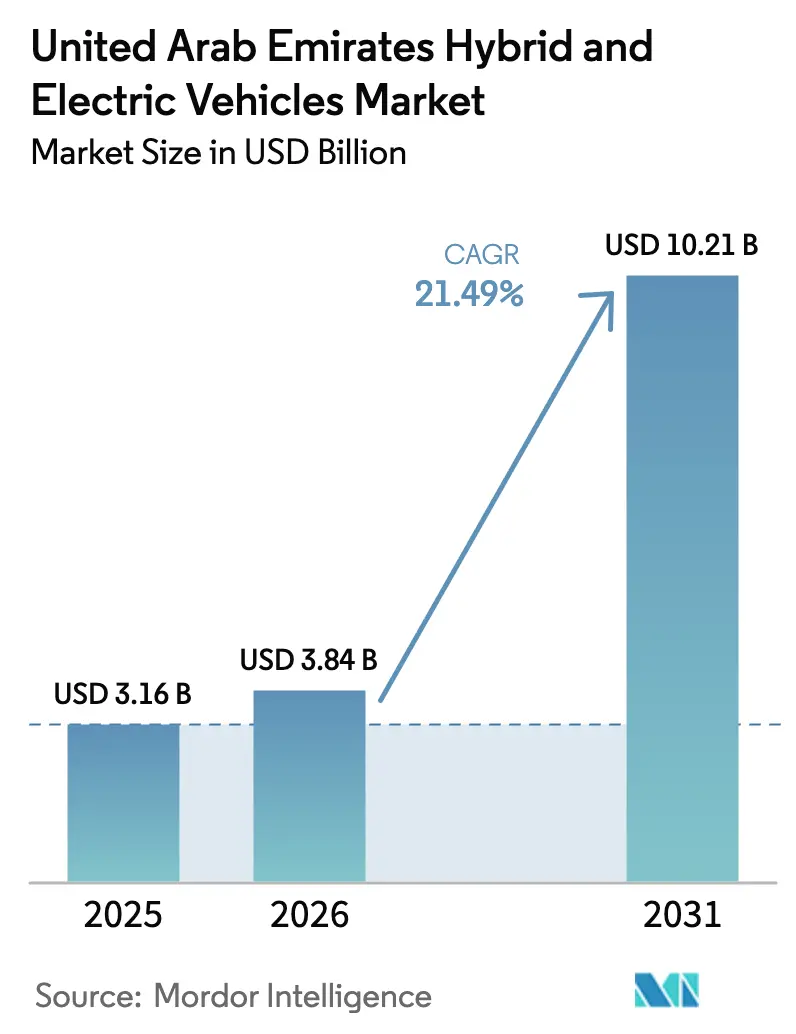
| Base Year Market Size (2025) | USD 3.16 Billion |
| Market Size (2026) | USD 3.84 Billion |
| Market Size (2031) | USD 10.21 Billion |
| Growth Rate (2026 - 2031) | 21.49% CAGR |
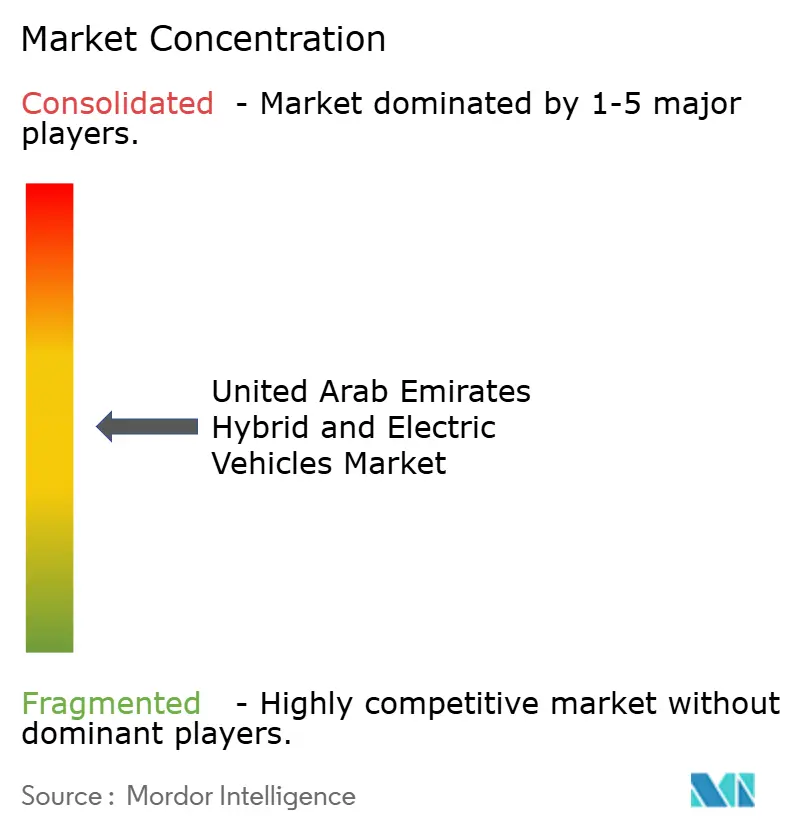
| Market Concentration | Medium |
Major Players
*Disclaimer: Major Players sorted in no particular order Image © Mordor Intelligence. Reuse requires attribution under CC BY 4.0. |
|
United Arab Emirates Hybrid And Electric Vehicles Market Analysis by Mordor Intelligence
The UAE hybrid and electric vehicles market size is expected to grow from USD 3.16 billion in 2025 to USD 3.84 billion in 2026 and is forecast to reach USD 10.21 billion by 2031 at a 21.49% CAGR over 2026–2031. Adoption is accelerating because sovereign climate pledges have been translated into binding vehicle-efficiency rules, Cabinet-level thermal-management standards, and transparent charging tariffs. At the same time, public fast-charging density in Dubai and Abu Dhabi is approaching levels seen in many European capitals, reducing driver anxiety during the scorching summer months. Battery chemistries that favor superior heat tolerance, alongside 800 V power-electronics platforms that cut replenishment time to 10 minutes, are improving fleet economics for taxis, ride-hailing operators, and logistics firms. Competitive pressure is intensifying as Chinese brands use local assembly, battery-swap stations, and multi-tier brand architectures to undercut traditional European and Japanese producers on price while matching them on thermal performance.
Key Report Takeaways
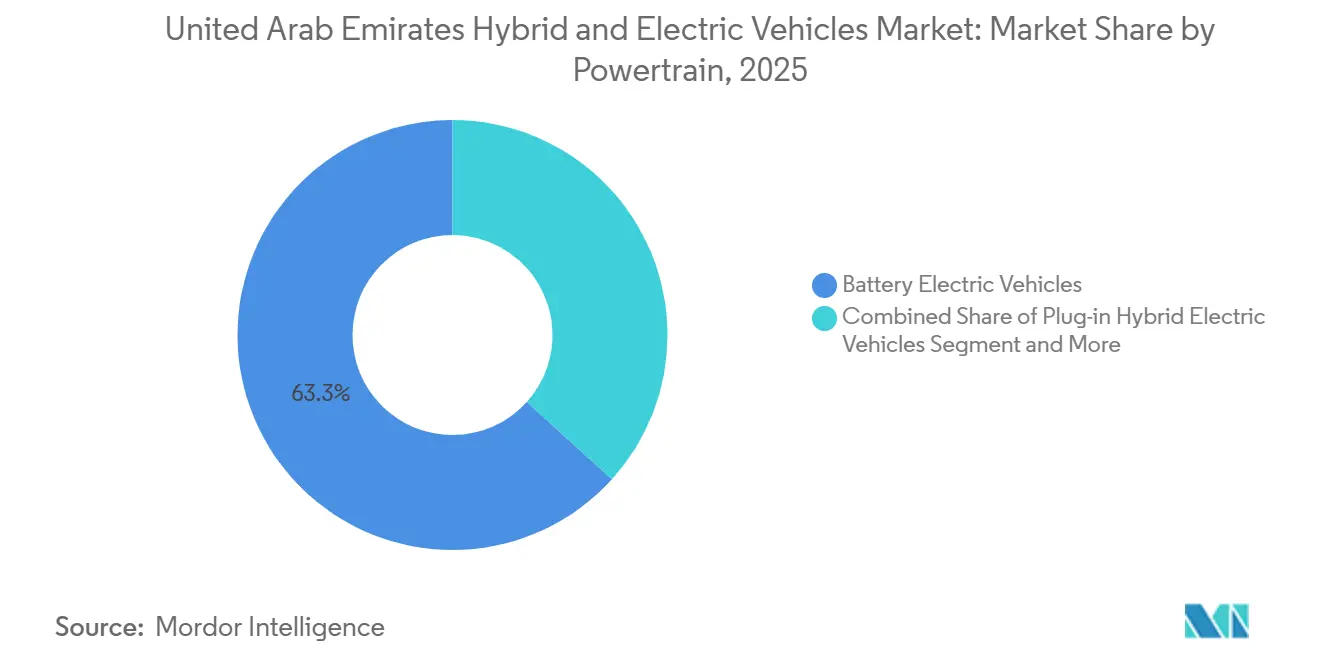
- By powertrain, battery electric vehicles held 63.27% of the UAE hybrid and electric vehicles market share in 2025; fuel-cell electric vehicles are projected to expand at a 37.84% CAGR to 2031.
- By vehicle type, SUVs and crossovers captured 46.58% revenue share in 2025, whereas light commercial vehicles are advancing at a 28.63% CAGR through 2031.
- By battery chemistry, nickel-manganese-cobalt accounted for a 54.41% share of the hybrid and electric vehicles market size in 2025; lithium-iron-phosphate is slated to grow at a 32.76% CAGR during the same period.
- By motor architecture, permanent-magnet synchronous motors led with 71.36% hybrid and electric vehicles market share in 2025, while axial-flux designs are forecast to grow at 29.48% through 2031.
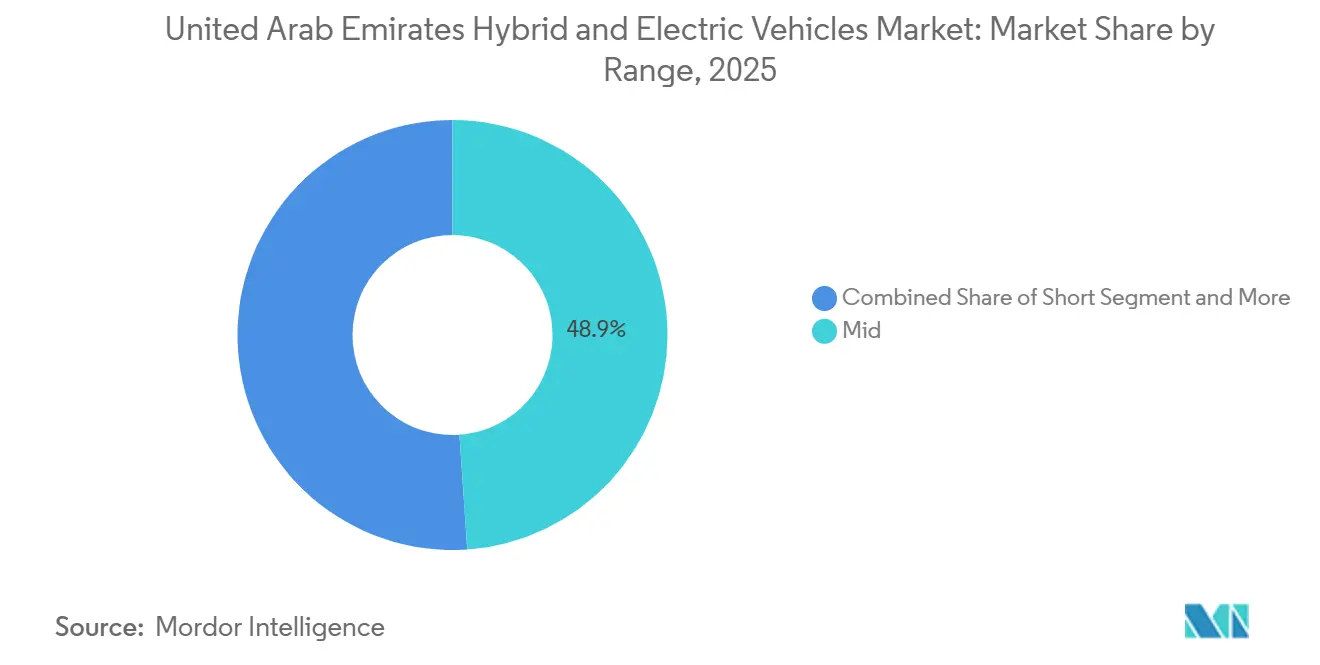
- By driving range, the mid (200–400) km bracket commanded 48.92% of the hybrid and electric vehicles market size in 2025, and models exceeding 600 km are registering a 35.67% CAGR to 2031.
- By voltage platform, the mid voltage (200–400) V systems retained a 52.38% share in 2025, but architectures above 800 V are tracking a 33.29% CAGR up to 2031.
Note: Market size and forecast figures in this report are generated using Mordor Intelligence’s proprietary estimation framework, updated with the latest available data and insights as of January 2026.
United Arab Emirates Hybrid And Electric Vehicles Market Trends and Insights
Drivers Impact Analysis*
| Driver | (~) % Impact on CAGR Forecast | Geographic Relevance | Impact Timeline |
|---|---|---|---|
| Robust Government Incentives | +5.2% | Dubai and Abu Dhabi | Medium term (2–4 years) |
| Rapid Battery-Pack Cost Deflation | +4.8% | Nationwide, amplified by Chinese OEM partnerships | Short term (≤ 2 years) |
| Expanding OEM Model Range | +3.9% | Nationwide, spillover to broader GCC | Medium term (2–4 years) |
| Corporate Fleet-Electrification Pledges (Road 2.0) | +3.1% | Dubai logistics corridors, Abu Dhabi Government fleets | Short term (≤ 2 years) |
| Domestic EV Assembly Initiatives | +2.7% | Nationwide, export potential to GCC and East Africa | Long term (≥ 4 years) |
| AI-Optimized Charger Siting | +1.6% | Pilot deployments in Dubai smart-city zones | Medium term (2–4 years) |
| Source: Mordor Intelligence | |||


Robust Government Incentives and Charging Build-Out
Public chargers in Dubai exceeded 1,270 units by mid-2025[1]Waheed Abbas, "Dubai: Over 1,270 EV charging points serve more than 40,600 cars," Khaleej Times, khaleejtimes.com. and the ADNOC-TAQA joint venture has committed to 500 additional installations by 2028, on its way to a national target of 70,000 by 2030. Cabinet Resolution 81 of 2024 harmonized tariffs at AED 0.305 per kWh for home charging, AED 0.70 for slow AC, and AED 1.20 for fast DC, eliminating the price opacity that previously discouraged fleet managers. The November 2025 Salik–Schneider Electric–Vcharge agreement will add 1,800 locations using real-time toll-gate traffic data to raise utilization above 60%. Dubai’s Road 2.0 program compels 17 large fleets to publish binding zero-emission procurement schedules, giving charge-point investors predictable throughput. These converging policies shorten the charger payback period to under 5 years on high-traffic corridors.
Rapid Battery-Pack Cost Deflation and LFP Adoption
BloombergNEF pegged average lithium-ion pack prices at USD 108 per kWh in 2025[2]"Lithium-Ion Battery Pack Prices Fall to $108 Per Kilowatt-Hour, Despite Rising Metal Prices: BloombergNEF, BloombergNEF, bnef.com. down from USD 115 a year earlier, moving mass-market price parity forward to 2027 for compact cars. Lithium-iron-phosphate offers a further 15–20% cost edge and superior thermal stability, attributes showcased by BYD’s Blade Battery, which survived nail-penetration tests without ignition. M Glory’s locally assembled Al Damani DMV300, using a 52.7 kWh LFP pack, retails from AED 127,500, proving that domestic production plus Chinese supply chains can deliver sub-AED 130,000 sticker prices. Longer cycle life beyond 3,000 charge-discharge events mitigates residual-value concerns and supports second-owner demand, a key factor for the used-car-heavy UAE market.
Expanding OEM Model Range Tailored for GCC Climate
Tesla’s late-2025 Model Y facelift added ventilated seats, revised suspension, and enhanced thermal management to withstand sustained 50 °C ambient temperatures. Hyundai’s IONIQ 5 ships with a heat-pump capable of retaining efficiency above 40 °C while its 800 V platform enables a 10–80% recharge in under 18 minutes. Smart Automobile’s #5 EHD hybrid blends a 250 km electric range[3]Mark Rainford, "insidechinaauto.com," Inside China Auto, insidechinaauto.com. with a generator extending total range past 1,600 km and supports 400 kW charging, a hedge against sparse rural infrastructure. Changan’s Deepal S05, introduced by Al Tayer Motors in 2025, offers both BEV and range-extended variants coupled with augmented-reality infotainment to meet local tech expectations. These adaptations demonstrate that manufacturers now treat the UAE as a launch market requiring dedicated hot-climate validation rather than simple export specification tweaks.
Corporate Fleet-Electrification Pledges (Road 2.0)
Road 2.0 obliges participating logistics, ride-hailing, and utility fleets to shift a set share of light-duty vehicles to zero-emission drivetrains by 2027, generating annual demand that industry analysts place at roughly 12,000 units. Emirates Flight Catering plans to electrify 53 aircraft-service trucks, and an electric high-loader prototype is scheduled for summer 2026 trials. DSV has begun operating heavy-duty e-trucks with 65-tonne payloads and 7-minute battery swaps, driving total-cost-of-ownership parity at about 80,000 km per year. Evocargo’s Level 4 autonomous electric trucks entered service at RAK Ceramics in October 2025, combining driverless operation with zero local emissions to trim logistics costs. These anchored volumes give OEMs the confidence to allocate GCC-tuned production slots and invest in aftermarket parts hubs.
Restraints Impact Analysis*
| Restraint | (~) % Impact on CAGR Forecast | Geographic Relevance | Impact Timeline |
|---|---|---|---|
| High Ambient-Temperature Range Degradation | -2.9% | Interior emirates during May–September | Short term (≤ 2 years) |
| Up-Front Vehicle Cost and Insurance Premium Gap | -2.4% | Expat buyers without access to subsidised green financing | Medium term (2–4 years) |
| Patchy Fast-Charging Availability outside Dubai | -1.8% | Fujairah, Ras Al Khaimah, Umm Al Quwain, inter-city routes | Short term (≤ 2 years) |
| Limited EV-Specific Consumer Finance | -1.3% | Nationwide | Medium term (2–4 years) |
| Source: Mordor Intelligence | |||
High Ambient-Temperature Range Degradation
Peer-reviewed Kuwaiti studies measuring battery performance at desert temperatures recorded a 22% range drop at 40 °C and 32% at 50 °C, equivalent to a 100 km shortfall on a 450 km pack. Elevated internal resistance accelerates electrolyte breakdown, so capacity loss can reach 8–10% within three years, versus roughly half that in temperate climates. Tesla’s heat-pump-equipped Model Y and Hyundai’s IONIQ 5 address the issue, but the added hardware costs roughly USD 1,000, which is hard to absorb in budget segments. Lithium-iron-phosphate chemistries lower thermal-runaway risk yet trade away up to 15% energy density, so no universally optimal solution exists for the Gulf’s climatic extremes.
Up-Front Vehicle Cost and Insurance Premium Gap
Even after tariff exemptions, sticker prices for mass-market EVs remain 10–15% above similar internal-combustion cars because battery packs still cost USD 6,000–10,000 depending on chemistry and capacity. Insurance underwriters charge higher premiums due to limited historical loss data on high-voltage repairs and battery-fire liability, widening monthly cost differences for middle-income expatriates. Tesla’s year-end 2026 Murabaha financing, launched with Dubai Islamic Bank, bundles complimentary coverage and zero profit margin to narrow the gap for credit-eligible drivers. Broader relief will depend on domestic pack-repair capability and insurer confidence that warranty programs mitigate catastrophic loss exposure.
*Our forecasts treat driver/restraint impacts as directional, not additive. The impact forecasts reflect baseline growth, mix effects, and variable interactions.
Segment Analysis
By Powertrain: Hydrogen Bets Hedge Battery Constraints
Battery electric vehicles commanded 63.27% of the UAE hybrid and electric vehicles market share in 2025, supported by Tesla, BYD, and Hyundai models that comply with Cabinet Resolution 50’s thermal standards. Fuel-cell electric vehicles, although starting from a small base, are forecast to grow at a 37.84% CAGR through 2031, as Abu Dhabi’s Bee’ah plant supplies 18,000 kg of green hydrogen each day for municipal fleets, creating a ready-made refueling network. Plug-in hybrids occupy a narrow middle ground for buyers who remain wary of inter-emirate charging gaps but still want lower fuel bills.
Momentum is polarizing: corporate fleets bound by Road 2.0 mandates lean heavily into battery electrics for predictable urban routes, while premium OEMs such as BMW and Toyota view hydrogen as a strategic hedge for long-haul and heavy-duty applications. NIO’s battery-swap model offers a third pathway by decoupling vehicle and pack ownership, although success hinges on dense station coverage. If Abu Dhabi expands public hydrogen pumps along the E11 corridor, FCEV uptake could accelerate; otherwise, batteries will maintain dominance through most of the forecast period.


By Vehicle Type: Commercial Fleets Outpace Retail Adoption
SUVs and crossovers led with 46.58% of 2025 registrations, mirroring local demand for high ground clearance and cabin space. Light commercial vehicles, however, are advancing at a 28.63% CAGR as logistics operators adopt BYD’s ETM6 and T5 trucks, which pair seven-minute battery swaps with lower diesel exposure. Public-transport authorities are reinforcing the trend by adding 40 fully electric Zhongtong buses to Dubai’s 636-unit low-emission order book.
Fleet economics favor electrification when vehicles cover 80,000 km a year, because maintenance intervals stretch from 10,000 km for diesel to 30,000 km for battery drivetrains. Private sedan and hatchback buyers remain price-sensitive, waiting for lower insurance premiums and faster rural chargers before switching. No OEM yet offers a seven-seat electric MPV tailored to large Emirati families, leaving a conspicuous gap that local assemblers could target. As depot charging proliferates, commercial uptake is set to widen the performance gap over retail adoption through 2031.
By Battery Chemistry: LFP Closes the Cost and Safety Gap
Nickel-manganese-cobalt retained a 54.41% share in 2025 because of its energy-density advantage, but lithium-iron-phosphate is expanding at 32.76% CAGR as Chinese brands wield its 15–20% cost edge to price mass-market models below AED 130,000. LFP’s thermal-runaway resistance also suits Gulf parking conditions where interior temperatures reach 70 °C, a critical safety differentiator.
The UAE hybrid and electric vehicles market size for LFP-based models is set to surge once M Glory’s Dubai Industrial City plant scales to 55,000 units a year, wiping 18% off landed costs versus imports. Cabinet Resolution 50 indirectly supports this shift by making liquid-cooled NMC packs more expensive to certify, while LFP often meets the specification with passive air cooling. Premium buyers chasing 600 km-plus range will still pay for NMC or NCA energy density, but mainstream demand is swinging decisively toward LFP as pack prices drop under USD 100 per kWh.
By Motor Architecture: Axial Flux Emerges as Niche Disruptor
Permanent-magnet synchronous motors dominated with 71.36% share in 2025, valued for 95% efficiency and compact packaging. Axial-flux designs are projected to grow at 29.48% CAGR because they deliver 30% higher torque density and cut weight by 20%, attributes prized in high-performance and space-constrained platforms.
Rare-earth price volatility, driven by Chinese export quotas, is nudging OEMs to architectures that reduce neodymium content per kilowatt, further enhancing axial-flux appeal. Mass-market diffusion remains gated by scale economics: production must exceed 50,000 units annually to amortize specialized tooling, a threshold Mercedes-Benz will cross with YASA motors in the EQS facelift. Until then, PMSMs will keep their lead in the UAE hybrid and electric vehicles market share, while axial-flux captures premium niches and slowly migrates downstream over the decade.
By Range: Ultra-Long Variants Address Psychological Barriers
Vehicles offering 200–400 km per charge took 48.92% of 2025 sales because the Dubai-to-Abu Dhabi commute sits comfortably inside that envelope. Models exceeding 600 km are advancing at a 35.67% CAGR as buyers pay extra to eliminate inter-city charging stops; Tesla’s facelifted Model Y now delivers up to 551 km, narrowing that perceived gap.
Ultra-long packs above 100 kWh add roughly 300 kg and USD 15,000, limiting them to luxury or fleet segments where downtime has high opportunity costs. Mid-range remains the sweet spot for corporate pools and second-car households, while Smart’s #5 EHD hybrid extends total range past 1,600 km through an onboard generator, hedging infrastructure risk. Short-range sub-200 km vehicles stay confined to campus and depot environments, leaving the mainstream battle squarely between mid-range affordability and ultra-range confidence.
By Voltage: 800 V Architecture Redefines Fleet Economics
Platforms running 200–400 V still accounted for 52.38% of 2025 deliveries, but above-800 V systems are growing at a 33.29% CAGR as fleets chase ten-minute fast-charging, which lifts driver utilization by up to 18%. Hyundai proved the concept locally when the IONIQ 5 achieved a 10–80% top-up in just 18 minutes during July 2025 field trials.
Silicon-carbide inverters, essential for these voltages, cost roughly twice the price of silicon IGBTs, yet scale is cutting the premium and enabling trickle-down to mid-segment models after 2028. Cabinet Resolution 50’s interoperability clause effectively sidelines low-voltage architectures by mandating high-power DC compatibility. As the charger network adds more 350 kW and 400 kW units, fleet operators will migrate rapidly to 800 V, while private buyers may follow once component premiums narrow and high-speed chargers reach the northern emirates.
Competitive Landscape
The top five brands (Tesla, BYD, Hyundai, BMW, and Mercedes-Benz) controlled a significant share of 2025 registrations. Tesla’s zero-profit Murabaha plan with Dubai Islamic Bank, bundling free insurance, targets expatriates who make up 88% of the population and often lack access to subsidized green loans. BYD’s four-layer portfolio (core BYD, premium Denza, ultra-luxury Yangwang, and off-road Fangchengbao) launches sequentially through 2026 to cover price points from AED 130,000 to AED 600,000.
NIO opened its first battery-swap station in February 2025 and formed a joint venture with CYVN Holdings for an Abu Dhabi R&D hub, signaling a long-term regional commitment. Import data show Chinese EV shipments to the UAE rising more than 50% year-on-year during early 2025, putting margin pressure on European incumbents. White-space niches remain: no seven-seat electric MPV caters to extended Emirati families, payload losses still hamper electric trucks above 12 tons on inter-city freight, and ultra-luxury FCEVs remain on 2028 model cycles.
M Glory’s domestically built DMV300 cracked the AED 130,000 barrier, but distribution is limited to five showrooms, versus Tesla’s eight and BYD’s twelve. Engineering differentiation around thermal management and 400 kW ultra-fast charging is becoming the main moat, especially after Cabinet Resolution 50 codifies Gulf-specific validation, effectively screening out budget imports that merely rebadge global platforms.
United Arab Emirates Hybrid And Electric Vehicles Industry Leaders
-
Hyundai Motor Company
-
Toyota Motor Corporation
-
Tesla Inc.
-
BYD
-
Bayerische Motoren Werke AG (BMW)
- *Disclaimer: Major Players sorted in no particular order

Recent Industry Developments
- November 2025: Al-Futtaim Electric Mobility (AFEM) partnered with Udrive to integrate BYD’s hybrid vehicles into the UAE’s largest on-demand rental fleet, with plans to expand to 500 BYD hybrid units, marking one of the biggest shared mobility electrification moves in the region.
- December 2024: From January 2025, the UAE phased out free public EV charging and introduced standardized tariffs for electric vehicle users nationwide, with charges set at AED 1.2/kWh plus VAT for DC fast chargers and AED 0.70/kWh plus VAT for AC chargers. Alongside the tariff rollout, the UAE Government launched a user-friendly mobile app and 24/7 support services to enhance the charging experience and encourage EV adoption under the UAEV initiative.


United Arab Emirates Hybrid And Electric Vehicles Market Report Scope
Commercial Vehicles, Passenger Vehicles, Two-Wheelers are covered as segments by Vehicle Type. FCEV, HEV, PHEV are covered as segments by Fuel Category.| Battery Electric Vehicles (BEVs) |
| Plug-in Hybrid Electric Vehicles (PHEVs) |
| Fuel Cell Electric Vehicles (FCEVs) |
| Passenger Car | Hatchback |
| Sedan | |
| SUV (Sport Utility Vehicle)/Crossover | |
| MPV (Multi-Purpose Vehicle) | |
| Commercial Vehicle | Light Commercial Vehicle |
| Medium and Heavy-Duty Truck | |
| Bus |
| Lithium Iron Phosphate (LFP) |
| Lithium Nickel Manganese Cobalt Oxide (NMC) |
| Lithium Nickel Cobalt Aluminum Oxide (NCA) |
| Others |
| Permanent Magnet Synchronous Motors (PMSM/PM) |
| Induction Motors (IM) |
| Others (SRM, Axial Flux, etc.) |
| Short (0–200 km) |
| Mid (200–400 km) |
| Long (400–600 km) |
| Ultra-Long (More than 600 km) |
| Low Voltage (Less than 200 V) |
| Mid Voltage (200–400 V) |
| High Voltage (400–800 V) |
| Ultra-High Voltage (More than 800 V) |
| By Powertrain | Battery Electric Vehicles (BEVs) | |
| Plug-in Hybrid Electric Vehicles (PHEVs) | ||
| Fuel Cell Electric Vehicles (FCEVs) | ||
| By Vehicle Type | Passenger Car | Hatchback |
| Sedan | ||
| SUV (Sport Utility Vehicle)/Crossover | ||
| MPV (Multi-Purpose Vehicle) | ||
| Commercial Vehicle | Light Commercial Vehicle | |
| Medium and Heavy-Duty Truck | ||
| Bus | ||
| By Battery Chemistry | Lithium Iron Phosphate (LFP) | |
| Lithium Nickel Manganese Cobalt Oxide (NMC) | ||
| Lithium Nickel Cobalt Aluminum Oxide (NCA) | ||
| Others | ||
| By Motor Architecture | Permanent Magnet Synchronous Motors (PMSM/PM) | |
| Induction Motors (IM) | ||
| Others (SRM, Axial Flux, etc.) | ||
| By Range | Short (0–200 km) | |
| Mid (200–400 km) | ||
| Long (400–600 km) | ||
| Ultra-Long (More than 600 km) | ||
| By Voltage | Low Voltage (Less than 200 V) | |
| Mid Voltage (200–400 V) | ||
| High Voltage (400–800 V) | ||
| Ultra-High Voltage (More than 800 V) | ||


Market Definition
- Vehicle Type - The category includes passenger cars, commercial vehicles, and two-wheelers.
- Vehicle Body Type - TUnder Passenger Cars, the category includes Hatchbacks, Sedans, Sports Utility Vehicles, and Multi-purpose Vehicles; for Commercial Vehicles, it covers Light Commercial Pick-up Trucks, Light Commercial Vans, Medium-duty Commercial Trucks, Heavy-duty Commercial Trucks, and Medium and Heavy Duty Buses; and for Two-Wheelers, it encompasses Scooters and Motorcycles.
- Fuel Category - The category exclusively covers electric propulsion systems, including various types such as HEV (Hybrid Electric Vehicles), PHEV (Plug-in Hybrid Electric Vehicles), BEV (Battery Electric Vehicles), and FCEV (Fuel Cell Electric Vehicles).
| Keyword | Definition |
|---|---|
| Electric Vehicle (EV) | A vehicle which uses one or more electric motors for propulsion. Includes cars, buses, and trucks. This term includes all-electric vehicles or battery electric vehicles and plug-in hybrid electric vehicles. |
| BEV | A BEV relies completely on a battery and a motor for propulsion. The battery in the vehicle must be charged by plugging it into an outlet or public charging station. BEVs do not have an ICE and hence are pollution-free. They have a low cost of operation and reduced engine noise as compared to conventional fuel engines. However, they have a shorter range and higher prices than their equivalent gasoline models. |
| PEV | A plug-in electric vehicle is an electric vehicle that can be externally charged and generally includes all-electric vehicles as well as plug-in hybrids. |
| Plug-in Hybrid EV | A vehicle that can be powered either by an ICE or an electric motor. In contrast to normal hybrid EVs, they can be charged externally. |
| Internal combustion engine | An engine in which the burning of fuels occurs in a confined space called a combustion chamber. Usually run with gasoline/petrol or diesel. |
| Hybrid EV | A vehicle powered by an ICE in combination with one or more electric motors that use energy stored in batteries. These are continually recharged with power from the ICE and regenerative braking. |
| Commercial Vehicles | Commercial vehicles are motorized road vehicles designed for transporting people or goods. The category includes light commercial vehicles (LCVs) and medium and heavy-duty vehicles (M&HCV). |
| Passenger Vehicles | Passenger cars are electric motor– or engine-driven vehicles with at least four wheels. These vehicles are used for the transport of passengers and comprise no more than eight seats in addition to the driver’s seat. |
| Light Commercial Vehicles | Commercial vehicles that weigh less than 6,000 lb (Class 1) and in the range of 6,001–10,000 lb (Class 2) are covered under this category. |
| M&HDT | Commercial vehicles that weigh in the range of 10,001–14,000 lb (Class 3), 14,001–16,000 lb (Class 4), 16,001–19,500 lb (Class 5), 19,501–26,000 lb (Class 6), 26,001–33,000 lb (Class 7) and above 33,001 lb (Class 8) are covered under this category. |
| Bus | A mode of transportation that typically refers to a large vehicle designed to carry passengers over long distances. This includes transit bus, school bus, shuttle bus, and trolleybuses. |
| Diesel | It includes vehicles that use diesel as their primary fuel. A diesel engine vehicle have a compression-ignited injection system rather than the spark-ignited system used by most gasoline vehicles. In such vehicles, fuel is injected into the combustion chamber and ignited by the high temperature achieved when gas is greatly compressed. |
| Gasoline | It includes vehicles that use gas/petrol as their primary fuel. A gasoline car typically uses a spark-ignited internal combustion engine. In such vehicles, fuel is injected into either the intake manifold or the combustion chamber, where it is combined with air, and the air/fuel mixture is ignited by the spark from a spark plug. |
| LPG | It includes vehicles that use LPG as their primary fuel. Both dedicated and bi-fuel LPG vehicles are considered under the scope of the study. |
| CNG | It includes vehicles that use CNG as their primary fuel. These are vehicles that operate like gasoline-powered vehicles with spark-ignited internal combustion engines. |
| HEV | All the electric vehicles that use batteries and an internal combustion engine (ICE) as their primary source for propulsion are considered under this category. HEVs generally use a diesel-electric powertrain and are also known as hybrid diesel-electric vehicles. An HEV converts the vehicle momentum (kinetic energy) into electricity that recharges the battery when the vehicle slows down or stops. The battery of HEV cannot be charged using plug-in devices. |
| PHEV | PHEVs are powered by a battery as well as an ICE. The battery can be charged through either regenerative breaking using the ICE or by plugging into some external charging source. PHEVs have a better range than BEVs but are comparatively less eco-friendly. |
| Hatchback | These are compact-sized cars with a hatch-type door provided at the rear end. |
| Sedan | These are usually two- or four-door passenger cars, with a separate area provided at the rear end for luggage. |
| SUV | Popularly known as SUVs, these cars come with four-wheel drive, and usually have high ground clearance. These cars can also be used as off-road vehicles. |
| MPV | These are multi-purpose vehicles (also called minivans) designed to carry a larger number of passengers. They carry between five and seven people and have room for luggage too. They are usually taller than the average family saloon car, to provide greater headroom and ease of access, and they are usually front-wheel drive. |


Research Methodology
Mordor Intelligence follows a four-step methodology in all its reports.
- Step-1: Identify Key Variables: To build a robust forecasting methodology, the variables and factors identified in Step-1 are tested against available historical market numbers. Through an iterative process, the variables required for market forecast are set and the model is built based on these variables.
- Step-2: Build a Market Model: Market-size estimations for the historical and forecast years have been provided in revenue and volume terms. Market revenue is calculated by multiplying the sales volume with their respective average selling price (ASP). While estimating ASP factors like average inflation, market demand shift, manufacturing cost, technological advancement, and varying consumer preference, among others have been taken into account.
- Step-3: Validate and Finalize: In this important step, all market numbers, variables, and analyst calls are validated through an extensive network of primary research experts from the market studied. The respondents are selected across levels and functions to generate a holistic picture of the market studied.
- Step-4: Research Outputs: Syndicated Reports, Custom Consulting Assignments, Databases & Subscription Platforms.


