Powersports Market Size and Share
Market Overview
| Study Period | 2019 - 2031 |
|---|---|
| Market Size (2026) | USD 43.04 Billion |
| Market Size (2031) | USD 58.94 Billion |
| Growth Rate (2026 - 2031) | 6.49% CAGR |
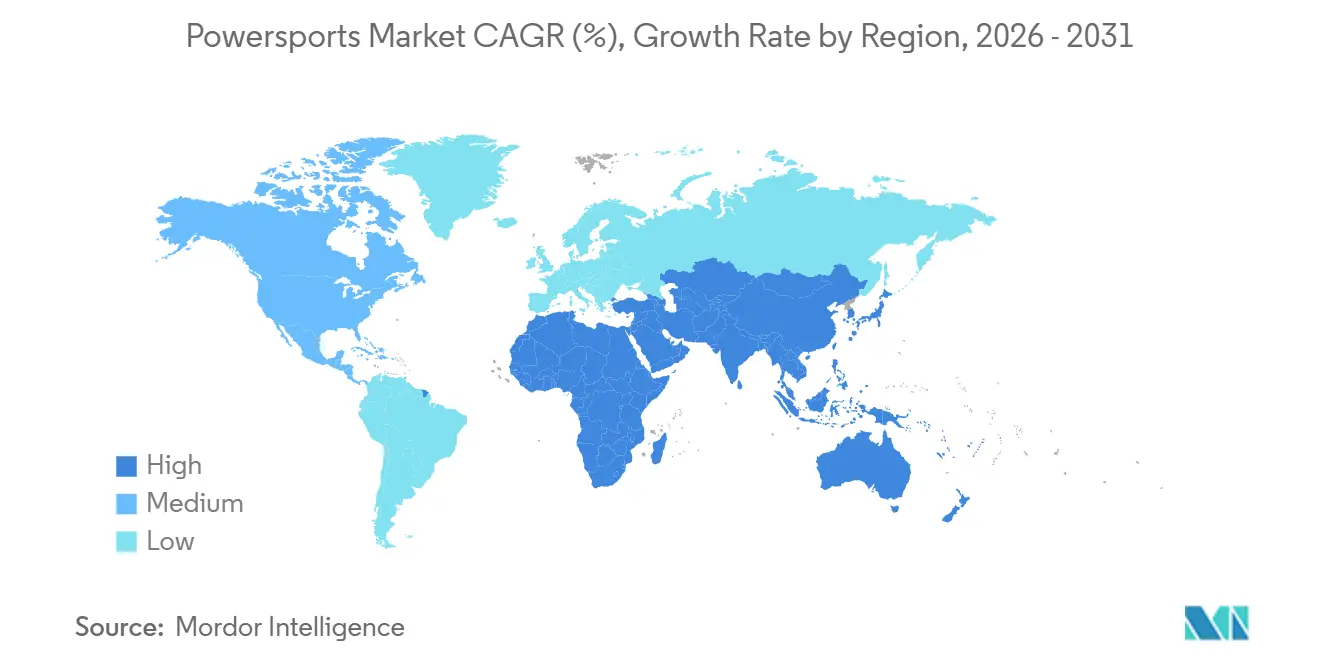
| Fastest Growing Market | Asia Pacific |
| Largest Market | North America |
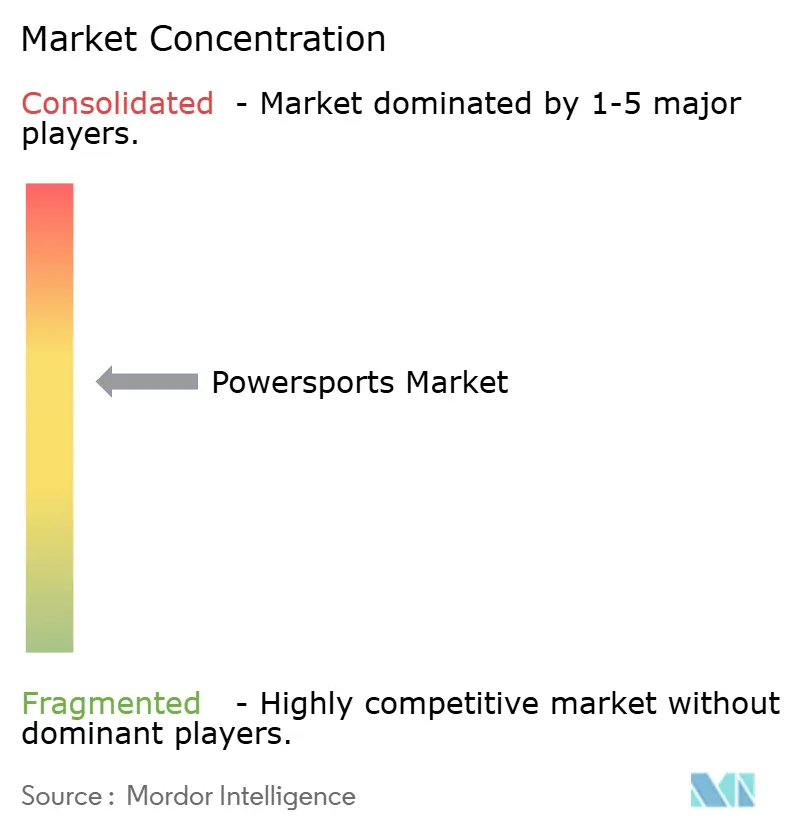
| Market Concentration | Medium |
Major Players
*Disclaimer: Major Players sorted in no particular order Image © Mordor Intelligence. Reuse requires attribution under CC BY 4.0. |
|
Powersports Market Analysis by Mordor Intelligence
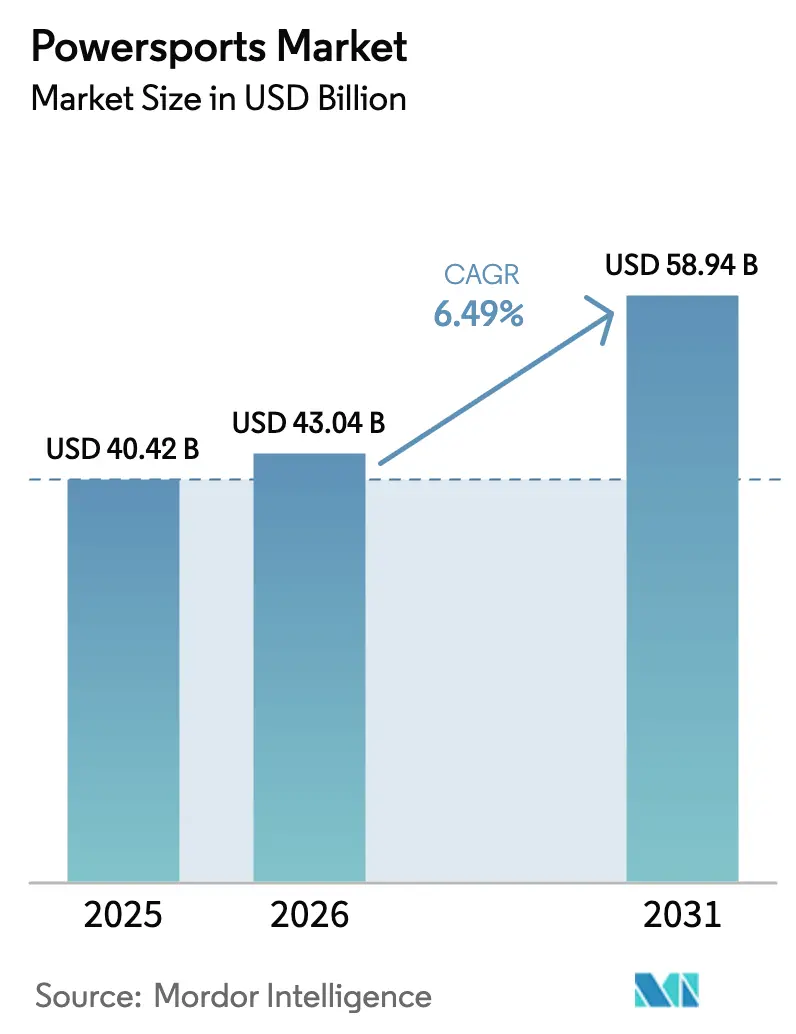
The powersports market size was valued at USD 40.42 billion in 2025 and estimated to grow from USD 43.04 billion in 2026 to reach USD 58.94 billion by 2031, at a CAGR of 6.49% during the forecast period (2026-2031). Momentum springs from a steady pivot toward utility-driven deployments in defense, agriculture, and last-mile logistics, while electrification, connected-vehicle software, and flexible access models compound demand. North America retained leadership with 46.06% revenue in 2025, yet Asia-Pacific’s 7.72% CAGR underscores how emerging buyers are bypassing gasoline by opting straight for electric or hybrid machines. Rental and subscription platforms, advancing at an 11.98% CAGR, validate a behavioral shift in which riders favor episodic access over ownership to avoid storage and financing burdens. Competitive pressure intensifies as Chinese entrants undercut prices and established OEMs counter with faster product refreshes, vertical battery supply deals, and data-rich service ecosystems anchored in telematics.
Key Report Takeaways
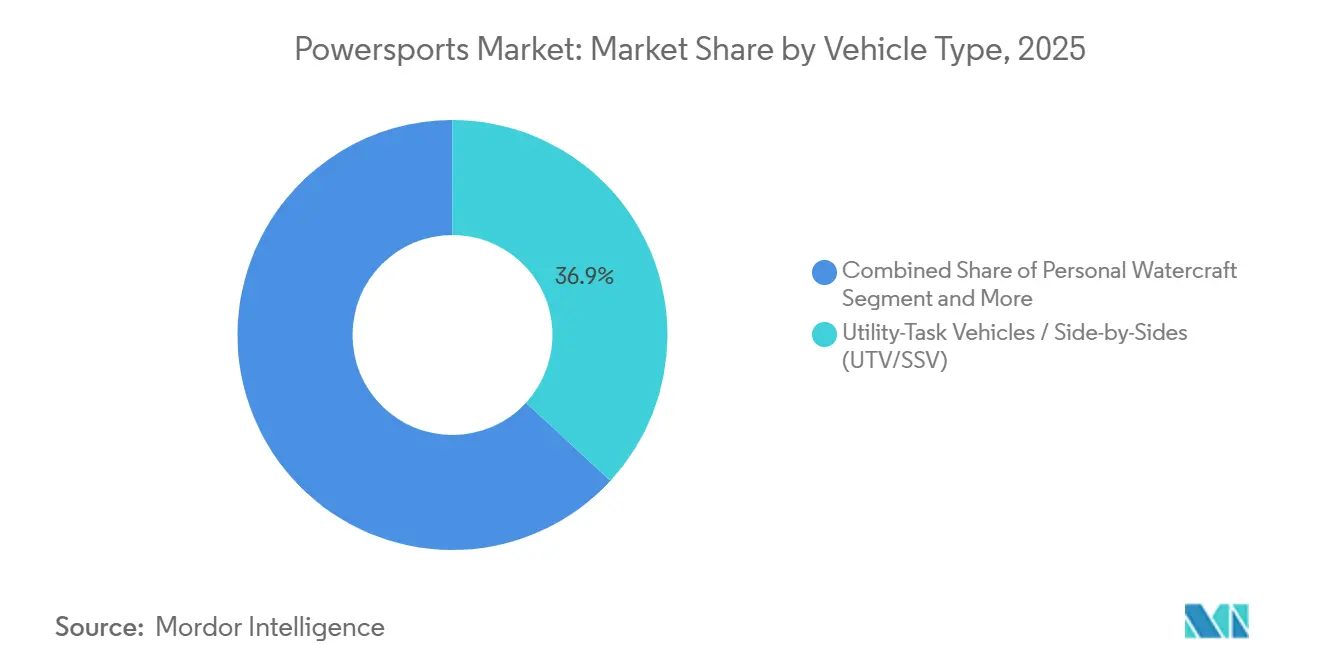
- By vehicle type, Utility Task Vehicle (UTV) / Side-by-Side (SSV) led with 36.85% revenue share in 2025, while the same platform class is forecast to expand at a 10.62% CAGR through 2031.
- By propulsion, gasoline commanded 83.01% of the 2025 powersports market share; electric and hybrid units exhibited the fastest growth trajectory, increasing at a 13.29% CAGR through 2031.
- By application, off-road recreation contributed 48.39% of 2025 sales; utility and commercial uses chart the highest recorded growth at 8.46% CAGR.
- By sales channel, OEM dealerships retained 70.36% control in 2025, while rental and subscription solutions are expected to accelerate at an 11.98% CAGR.
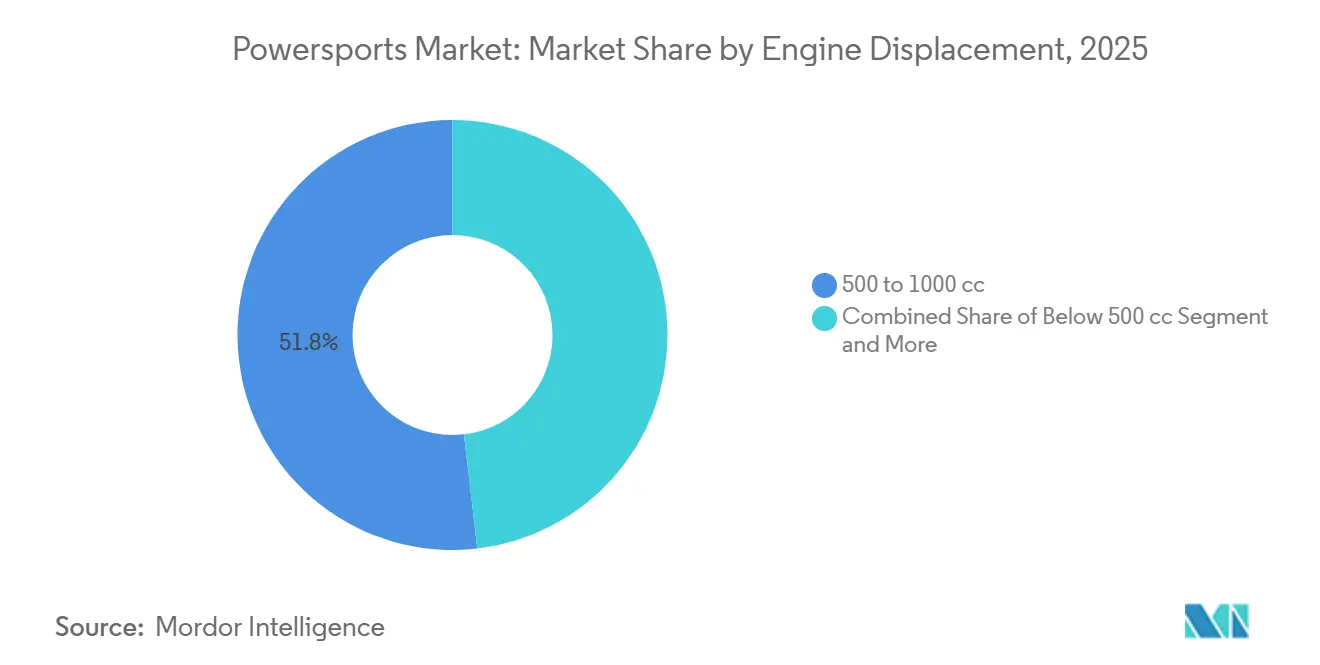
- By engine displacement, 500–1,000 cc systems accounted for 51.83% of 2025 units; below-500 cc platforms, buoyed by compact electrics, are expected to surge at an 11.07% CAGR.
- By price tier, mid-range models between USD 10,000 and USD 20,000 generated 54.67% of revenue in 2025; premium models above USD 20,000 show the swiftest growth at a 6.93% CAGR.
- By geography, North America retained its leadership position with 46.06% of 2025 sales, while the Asia-Pacific region is the fastest-growing at a 7.72% CAGR.
Note: Market size and forecast figures in this report are generated using Mordor Intelligence’s proprietary estimation framework, updated with the latest available data and insights as of January 2026.
Global Powersports Market Trends and Insights
Drivers Impact Analysis*
| Driver | (~) % Impact on CAGR Forecast | Geographic Relevance | Impact Timeline |
|---|---|---|---|
| Rapid OEM Electrification & Connected Powersport Platforms | +1.8% | Global, led by North America and Europe | Medium term (2-4 years) |
| Expansion of Rental and Subscription Models | +1.3% | North America, Europe, rising in Asia-Pacific | Short term (≤ 2 years) |
| Off-Road Racing Leagues | +1.1% | North America, Australia, spill-over to Middle East | Medium term (2-4 years) |
| E-Commerce Boom in Aftermarket Parts | +0.9% | Global, strongest in North America and Europe | Short term (≤ 2 years) |
| Defense and Law-Enforcement | +0.8% | North America, Middle East, Asia-Pacific | Long term (≥ 4 years) |
| Disposable Income and Tourism-Led Adventure Sports | +0.7% | Asia-Pacific core, spill-over to South America and Africa | Medium term (2-4 years) |
| Source: Mordor Intelligence | |||
Rapid OEM Electrification and Connected-Powersport Platforms
OEMs now embed telematics, over-the-air updates, and subscription-based diagnostics in new models, shifting value from one-time hardware margins to lifelong data services. Polaris launched RIDE COMMAND+ with the 2023 model-year lineup and expanded/enhanced features for 2024, enabling fleet owners to geofence operational zones, track health, and schedule predictive maintenance, slashing downtime for agricultural and municipal users[1]U.S. Department of Energy, “Inflation Reduction Act EV Tax Credits,” energy.gov. Electric snowmobiles unveiled for the 2025 season demonstrate that lithium-iron-phosphate packs can retain capacity in sub-zero environments, expanding their use beyond temperate trails. Patents for swappable battery cassettes filed in 2024 hint at five-minute refuels that could alleviate range anxiety on multi-day expeditions. Connected dashboards further upsell OEM-branded accessories, capturing aftermarket revenue that once leaked to independent dealers.
Expansion of Rental and Subscription Models
Peer-to-peer apps and dealership-backed fleets unlock premium machines without the capital burden of ownership, reinforcing episodic usage habits. U.S. urban riders reserve side-by-sides for weekend desert runs, sidestepping garage storage rents and insurance fees. Fleet operators in national parks placed multi-million-dollar orders for electric UTVs in 2024, banking on quieter drivetrains and zero-tailpipe emissions to satisfy land managers. Subscription bundles fold maintenance and liability coverage into flat monthly rates, crystallizing the total cost of access and shortening decision cycles. Dealerships increasingly spin up in-house rental arms to defend walk-in traffic, offering incentive credits that convert renters into buyers.
Growing Popularity of Off-Road Racing Leagues and Events
Sanctioned series, such as GNCC and Ultra4, draw larger media rights, pushing powersports from a fringe hobby to a mainstream motorsport. GNCC reported 21,021 unique racers in 2024, an increase of 1,146 from the prior year (~5.8%), demonstrating how televised events drive aspirational purchases. Factory-backed teams use desert enduros as rolling laboratories, validating drivetrain cooling and suspension algorithms before retail launches. Prize purses topping USD 1 million are luring grassroots builders to upgrade stock vehicles, boosting parts demand. Tourism boards also court flagship events—California’s King of the Hammers organizers cite ~80,000 attendees—creating a spillover of hotel and service income that ingrains political support for trail access.
E-Commerce Boom in Aftermarket Parts and Accessories
Online marketplaces aggregate long-tail SKUs, allowing riders to source winches, skid plates, and LED arrays that are otherwise absent from local outlets. Same-day fulfillment in major U.S. metros condenses the click-to-install cycle, favoring impulse upgrades. Digital configurators superimpose parts on 3-D vehicle models, lifting basket sizes while driving down returns. Niche fabricators scale nationally without brick-and-mortar overhead, while dealers pivot toward value-added installation labor rather than inventory turns. Price transparency pressures OEMs to bundle accessory vouchers inside new-unit promotions.
Restraints Impact Analysis*
| Restraint | (~) % Impact on CAGR Forecast | Geographic Relevance | Impact Timeline |
|---|---|---|---|
| Stringent Emissions and Safety Regulations | -1.2% | North America, Europe, emerging Asia-Pacific | Medium term (2-4 years) |
| Lithium and Rare-Earth Supply-Chain Risks | -0.9% | Global, acute in North America and Europe | Long term (≥ 4 years) |
| High Acquisition and Upkeep Costs | -0.7% | Global, most pronounced in emerging markets | Short term (≤ 2 years) |
| Restricted Land-Use and Conservation Policies | -0.6% | North America, Europe, Australia | Long term (≥ 4 years) |
| Source: Mordor Intelligence | |||
Stringent Emissions and Safety Regulations
The EPA finalized Tier 4 emission standards for nonroad diesel engines in 2004, mandating the use of catalytic converters and closed-loop fuel injection on gasoline engines exceeding 50 horsepower, resulting in an incremental material cost per unit. EU Regulation (EU) No 168/2013 sets Euro 5 as mandatory for new types from 1 Jan 2020 for in-scope L-category vehicles, increasing engineering complexity through onboard diagnostics and evaporative-emission controls[2]U.S. Environmental Protection Agency, "Tier 4 Emission Standards for Off-Road Vehicles," epa.gov. California’s proposal to ban new gasoline recreational vehicles with engines under 1,000 cc from 2027 accelerates the timeline for electric vehicles, forcing parallel production lines for compliant and non-compliant markets. Safety mandates also tightened in 2024, with rollover-protection upgrades increasing curb weight and eroding payload capacity. Smaller importers struggle to amortize engineering expenses, prompting acquisitions by larger OEMs and nudging the market toward greater concentration.
Lithium and Rare-Earth Supply-Chain Risks for E-Powersports
Battery-grade lithium carbonate saw price spikes in 2024 amid global competition for energy storage metals, and although prices cooled, volatility remains a planning risk. China’s dominance in lithium refining and rare-earth processing leaves North American and European OEMs exposed to geopolitical swings[3]European Commission, “Euro 5 Emissions Standards Extension,” ec.europa.eu. Domestic-content thresholds built into the Inflation Reduction Act will gradually phase in, but available cell capacity still prioritizes automotive gigafactories over powersports volumes. Cobalt sourced predominantly from the Democratic Republic of Congo raises ethical sourcing constraints, pushing some brands toward lower-density lithium-iron-phosphate chemistries. Cell shortages have already delayed a major electric watercraft launch by 6 months, underscoring time-to-market vulnerability.
*Our forecasts treat driver/restraint impacts as directional, not additive. The impact forecasts reflect baseline growth, mix effects, and variable interactions.
Segment Analysis
By Vehicle Type: UTVs Extend Leadership Across Work and Play
Utility Task Vehicle (UTV) / Side-by-Side (SSV) cornered 36.85% of 2025 volume, cementing dominance through occupant safety, payload flexibility, and cab comfort. This segment is expected to widen its lead with a 10.62% CAGR, as municipalities substitute UTVs for light trucks on narrow rights-of-way and ranchers appreciate modular tool racks. OEMs add HVAC systems and automotive-grade interiors, broadening appeal to families who want multipurpose fun vehicles. Meanwhile, all-terrain vehicles, once a volume staple, lose share to UTVs due to rollover concerns and the absence of seat belts. Personal watercraft sales remain seasonal, and snowmobile demand declines with the shrinking snowpack in northern latitudes.
Heavyweight motorcycles retain a loyal touring demographic but lag overall growth. Younger riders are migrating to adventure models that offer dual-surface capability, eroding the pure road-bike market volume. OEM launches, such as a heavy-duty UTV with a 1,500-pound payload, highlight how product expansion encroaches on light-truck duties. Electric battery packs are packaged neatly within the UTV chassis, allowing for a 50-mile range without compromising the weight balance. In contrast, ATVs require bespoke battery architecture, slowing their electrification roadmap.


By Propulsion: Electric and Hybrid Chip Away at Gasoline Command
Gasoline engines still powered 83.01% of units in 2025, a testament to their entrenched market share and broad serviceability. Yet the electric and hybrid cohort charts a robust 13.29% CAGR through 2031 as battery costs fall, charging corridors expand, and policy carrots multiply. Diesel, confined to torque-centric applications, regresses under the expense of Tier 4 emissions, making the total cost of ownership less favorable.
Hybrid powertrains provide a bridge for range-anxious buyers, pairing small combustion engines with 10 kWh packs for stealth operation in hunting or wildlife management. Geographical adoption diverges: North America and Europe accelerate electric uptake under subsidy pressure, while the Asia-Pacific and Africa regions remain gasoline-heavy due to grid constraints. Electric UTVs reduce running costs to USD 0.03 per mile, compared to USD 0.12 for gasoline at 2025 pump prices.
By Application: Recreation Dominates Volume, Utility Leads Acceleration
Off-road recreation generated 48.39% of revenue in 2025, fueled by rising income and adventure-tourism marketing. Trail networks, park permits, and social media add fuel to recreational appeal. However, utility and commercial use cases, ranging from forestry to municipal services, exhibit higher relative expansion at an 8.46% CAGR, as fleet managers calculate fuel and maintenance savings against pickups.
Defense and law enforcement contracts drive high-margin tactical trims, providing stable multi-year revenue unaffected by consumer sentiment. Mixed-use owners blur work-and-play lines, buying plows and sprayers that transform weekend trail rigs into weekday tools. A U.S. agency study confirmed UTVs cost 40% less per mile than pickups on unpaved roads, reinforcing procurement arguments.
By Sales Channel: Dealerships Hold Sway as Rentals Surge
Dealerships managed 70.36% of 2025 sales due to floorplan financing, trade-in cycles, and workshop relationships. Exclusive parts agreements and test-ride programs deepen loyalty. Yet rental and subscription formats grow 11.98% annually, riding on urban consumers’ preference to pay only when they ride.
Dealers adapt by spinning off rental fleets, offering free rental credits with new-unit purchases, and leveraging excess inventory during slow seasons. Certified pre-owned programs also erode risk perceptions around used units, competing directly with independent resellers. Direct-to-consumer start-ups stay niche, as many buyers still insist on physical test rides and immediate service backup.
By Engine Displacement: Mid-Range Anchors Market, Compact Electrics Scale
Mid-range 500–1,000 cc engines held 51.83% unit market share in 2025, striking a balance between power and fuel budgets, as well as licensing rules. They are well-suited for trail riding, ranch chores, and small-scale hauling, making them a versatile fit. Below-500 cc models, increasingly electric, clock an 11.07% CAGR as peri-urban buyers adopt compact rigs for light hauling, campus security, and neighborhood chores.
Above-1,000 cc machines remain the adrenaline segment for dune racing and heavy timber work, yet face stiff compliance costs as displacement-based emissions fees rise. Regulatory agencies equate a 50 kW electric motor to a 700 cc gasoline engine benchmark, prompting OEMs to fine-tune output ratings around classification thresholds. Compact electrics priced near USD 8,000 make first-time ownership attainable, especially in markets without parallel street-vehicle obligations.
By Price Range: Mid-Tier Rules Revenue, Premium Reaps Growth
Mid-tier units, priced between USD 10,000 and USD 20,000, captured 54.67% of the 2025 turnover, combining reliability with feature parity sufficient for most riders. Upfront affordability aligns with financing sweet spots, sustaining volume leadership. Entry-level imports under USD 10,000 preserve accessibility but incur quality-perception hurdles and slimmer margins.
Premium machines above USD 20,000 appreciate fastest, rising at a 6.93% CAGR on the back of luxury interiors, adaptive suspension, and infotainment suites that mirror automotive amenities. Owners invest an incremental USD 5,000–10,000 in accessories such as climate-controlled seats and performance kits, inflating lifetime customer value. Geographic skew persists, with North America and Europe dominating premium spending, while the Asia-Pacific region clusters in entry and mid-bands due to lower median incomes.
Geography Analysis
North America accounted for 46.06% of 2025 sales, driven by extensive trail systems, high discretionary income, and established dealership networks. The United States anchors regional volume, especially in western states where federal lands enable extended riding seasons. Canadian provinces with forestry and mining operations rely on UTVs for remote transportation, blending recreational and vocational demands. Policy levers shape supply: California’s proposed gasoline-vehicle ban, effective from 2027, prompts OEMs to accelerate the development of electric UTV lines, while federal infrastructure spending extends rural charging corridors. Land-use reforms, however, restrict ecologically sensitive trails, applying a natural brake on the growth of the gasoline segment.
Asia-Pacific is the fastest-growing region, with a CAGR of 7.72% through 2031, as disposable incomes rise and rural road upgrades enhance utility. India’s transition from small tractors to compact UTVs for crop logistics spotlights utility adoption, amplified by domestic makers launching sub-USD 10,000 electrics for cooperative farms. China remains bifurcated: coastal cities embrace electric two-wheel rides for congestion relief, whereas interior provinces cling to gasoline ATVs for agriculture. Japan phases out two-stroke engines in favor of electric motorcycles under energy-security strategies, handing OEMs fresh domestic volume. South Korea’s dense urban profile limits adoption to enthusiast clusters and motorsport arenas.
Europe posts a muted 2.92% CAGR under stringent emissions fees and limited public off-road acreage. Germany, France, Italy, and the United Kingdom house the lion’s share of touring motorcycles and estate-management UTVs. Euro 5 regulations spur electric migration, yet rural charging lags, impeding adoption in alpine and Nordic regions. Russia’s market grows at 2.27% CAGR, driven by Siberian utility needs and frozen-terrain recreation. South America rises 3.45% on agricultural motives, though macroeconomic volatility tempers consumer appetite. The Middle East and Africa, both a touch above 7% CAGR, find lift in desert tourism, pipeline inspection, and defense procurement.

Competitive Landscape
The powersports market exhibits moderate concentration, with the top five manufacturers holding a considerable share of global turnover, leaving room for agile challengers. Incumbents safeguard share through vertical battery cell investments and proprietary telematics stacks that lock in aftermarket service contracts. Direct rental subsidiaries further capture consumers migrating away from ownership.
Cost-conscious competitors from Asia deploy price-arbitrage tactics, shipping mid-spec ATVs at 20–30% discounts to incumbent equivalents. Established brands counter with value-engineered trims, preserving safety features while trimming cosmetic extras. Concurrently, software differentiation is on the rise: adaptive suspension algorithms and remote diagnostics add stickiness across fleet accounts.
Niche specialists target specific subsegments within a terrain or sport. European companies focus on lightweight enduro bikes designed for technical trails, whereas emerging brands in the Middle East specialize in customizing sand-ready dunes machines. Regulatory costs and battery R&D budgets forecast a thinning field; marginal players may seek licensing partnerships or quit segments where compliance outlays eclipse return. Private-equity capital also enters, aiming to roll up aftermarket components suppliers into integrated accessory giants.
Powersports Industry Leaders
-
Polaris Inc.
-
Yamaha Motor Co., Ltd.
-
BRP Inc.
-
Honda Motor Co., Ltd.
-
Kawasaki Heavy Industries
- *Disclaimer: Major Players sorted in no particular order

Recent Industry Developments
- November 2025: Segway showcased its off-road lineup and debuted new models at EICMA 2025.
- August 2025: BRP introduced the 2026 Can-Am Outlander Electric ATV, featuring the Rotax ePower unit (35 kW / 47 hp) with a range of up to 50 miles (80 km).
- February 2025: Eurogrip debuted a motorcycle-tire line at the AIM Expo in Las Vegas, marking the brand’s formal entry into North America.


Research Methodology Framework and Report Scope
Market Definitions and Key Coverage
Our study treats the powersports market as the annual ex-factory revenue generated from new heavyweight motorcycles, all-terrain vehicles, side-by-sides/UTVs, personal watercraft, and snowmobiles that are sold through OEM dealerships, factory-direct web stores, and registered rental fleets. Second-hand units, aftermarket parts, rider apparel, financing income, and recreational boats are deliberately left outside this universe.
Scope exclusion: service labor, accessories, insurance, and club membership revenues are not counted.
Segmentation Overview
-
By Vehicle Type
- Personal Watercraft
- All-Terrain Vehicles (ATV)
- Utility-Task Vehicles / Side-by-Sides (UTV/SSV)
- Heavyweight Motorcycles
- Snowmobiles
-
By Propulsion
- Gasoline
- Diesel
- Electric/Hybrid
-
By Application
- On-Road
- Off-Road Recreation
- Utility / Commercial
-
By Sales Channel
- OEM Dealerships
- Rental & Subscription
- Aftermarket / Pre-owned
-
By Engine Displacement
- Less than 500 cc
- 500 to 1000 cc
- More than 1000 cc
-
By Price Range
- Entry (Less than USD 10,000)
- Mid (USD 10,000–20,000)
- Premium (More than USD 20,000)
-
By Geography
-
North America
- United States
- Canada
- Rest of North America
-
South America
- Brazil
- Argentina
- Rest of South America
-
Europe
- Germany
- United Kingdom
- France
- Italy
- Spain
- Russia
- Rest of Europe
-
Asia Pacific
- China
- India
- Japan
- South Korea
- Australia
- Rest of Asia Pacific
-
Middle East and Africa
- Turkey
- Saudi Arabia
- United Arab Emirates
- South Africa
- Egypt
- Rest of Middle East and Africa
-
North America
Detailed Research Methodology and Data Validation
Primary Research
Mordor analysts interviewed OEM product planners, franchised dealers, finance captives, powersport tour operators, and state trail-permit officials across North America, Europe, Oceania, and key Asian markets. These discussions validated average selling prices, electric model uptake, seasonal inventory swings, and the likely impact of tariff moves that are not visible in desk material.
Desk Research
We began with structured pulls of production, import-export, and registration data from sources such as UN Comtrade, USITC, Eurostat's Comext, the Motorcycle Industry Council, and Transport Canada, which frame the size of each vehicle pool. Accident and usage statistics from the US Consumer Product Safety Commission, the International Snowmobile Manufacturers Association, and national tourism boards sharpened application splits. Company filings and press releases were screened in D&B Hoovers, while headline checks ran through Dow Jones Factiva to spot one-off shocks or plant shutdowns. The sources cited here illustrate the breadth consulted; many additional public and subscription feeds were reviewed before numbers were fixed.
Market-Sizing & Forecasting
A top-down build starts with global production and trade volumes by vehicle type, converts them to revenue through blended ex-factory ASPs, and is then sense-checked against a bottom-up roll-up of sampled dealer deliveries and channel inventory changes. Five fingerprints: vehicle shipments, retail registrations, engine-size mix, discretionary recreation spending per capita, and fuel-price spreads influencing electrification drive the model. Forecasts rely on multivariate regression supported by scenario analysis for tariff and income shocks; elasticities were stress-tested with expert input before being frozen. Data gaps in smaller regions are bridged by applying per-capita ownership ceilings derived from the nearest mature analog market.
Data Validation & Update Cycle
Outputs pass variance screens versus historic ratios, peer models, and public guidance before a senior analyst sign-off. Reports refresh each year, and we trigger interim updates when material events, such as trade policy shifts, large recalls, or supply disruptions, alter assumptions.
Why Mordor's Powersports Baseline commands reliability
Published figures vary because firms choose different vehicle baskets, pricing layers, and refresh cadences. Users often discover that values swing widely once motorcycles or on-road scooters are folded in, or when retail mark-ups are mistaken for manufacturer revenue.
Key gap drivers include: a) some publishers merge golf carts and small recreational boats with traditional powersport units; b) others lift retail point-of-sale data without netting dealer margins; c) several studies freeze currency at a single-month rate, obscuring inflation-era swings. Mordor's scope discipline, dual-path (top-down, bottom-up) build, and annual currency rebasing reduce those distortions.
Benchmark comparison
| Market Size | Anonymized source | Primary gap driver |
|---|---|---|
| USD 38.17 B (2025) | Mordor Intelligence | - |
| USD 59.60 B (2024) | Regional Consultancy A | Includes golf carts and recreational boats; uses fixed 12-month FX average |
| USD 41.79 B (2024) | Global Consultancy B | Relies on retail receipts, omits personal watercraft trade data |
| USD 39.77 B (2024) | Industry Journal C | Excludes >900 cc motorcycles; older ASP benchmarks |
The comparison shows that once scope over-reach, pricing layers, and currency choices are aligned, Mordor's carefully audited baseline delivers a balanced, transparent starting point that decision-makers can reproduce and build upon with confidence.


Key Questions Answered in the Report
How large is the powersports market in 2026 and what is its expected value by 2031?
The powersports market size reached USD 43.04 billion in 2026 and is forecast to climb to USD 58.94 billion by 2031 at a 6.49% CAGR.
Which vehicle type currently leads global sales?
Utility-task vehicles and side-by-sides led the 2025 tally with 36.85% share, reflecting their crossover appeal for both recreation and work.
What fuel technology is growing fastest?
Electric and hybrid powertrains expand at a 13.29% CAGR, eroding gasoline’s long-held dominance as charging infrastructure widens.
Why are rentals and subscriptions gaining popularity?
Flexible access options let riders avoid high purchase, storage, and insurance costs, explaining why rental and subscription channels are scaling at 11.98% CAGR.
Page last updated on:


