
United States Defense Market Analysis by Mordor Intelligence
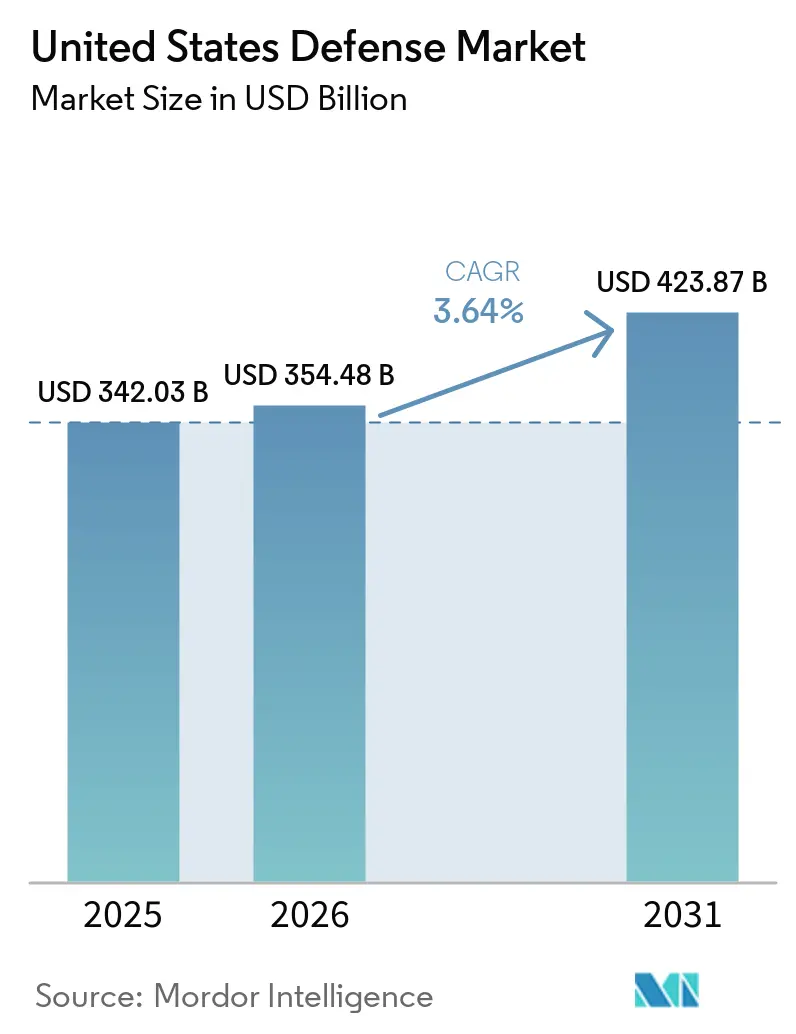
The United States defense market size was valued at USD 354.5 billion in 2026 and estimated to grow from USD 367.4 billion in 2027 to reach USD 449.6 billion by 2032, at a CAGR of 4.12% during the forecast period (2027-2032).
Missile replenishment and unmanned-vessel procurement in the United States create demand for both production volume and new military capabilities. AI-enabled intelligence extends the operational role of software by delivering detections through existing service and command tools. Suppliers can address these requirements through specialized components and expanded domestic manufacturing. Production ceilings and shipyard skills shortages constrain how quickly spending becomes usable military capability. Near-term revenue opportunities therefore favor suppliers able to deliver awarded missile and vessel orders, while software providers can pursue sales through integration with tools military users already run.
Key Report Takeaways
- Among the armed forces, the Army held a 40.23% United States defense market share in 2026, while the Air Force is forecast to grow fastest at a 5.4% CAGR during 2027-2032.
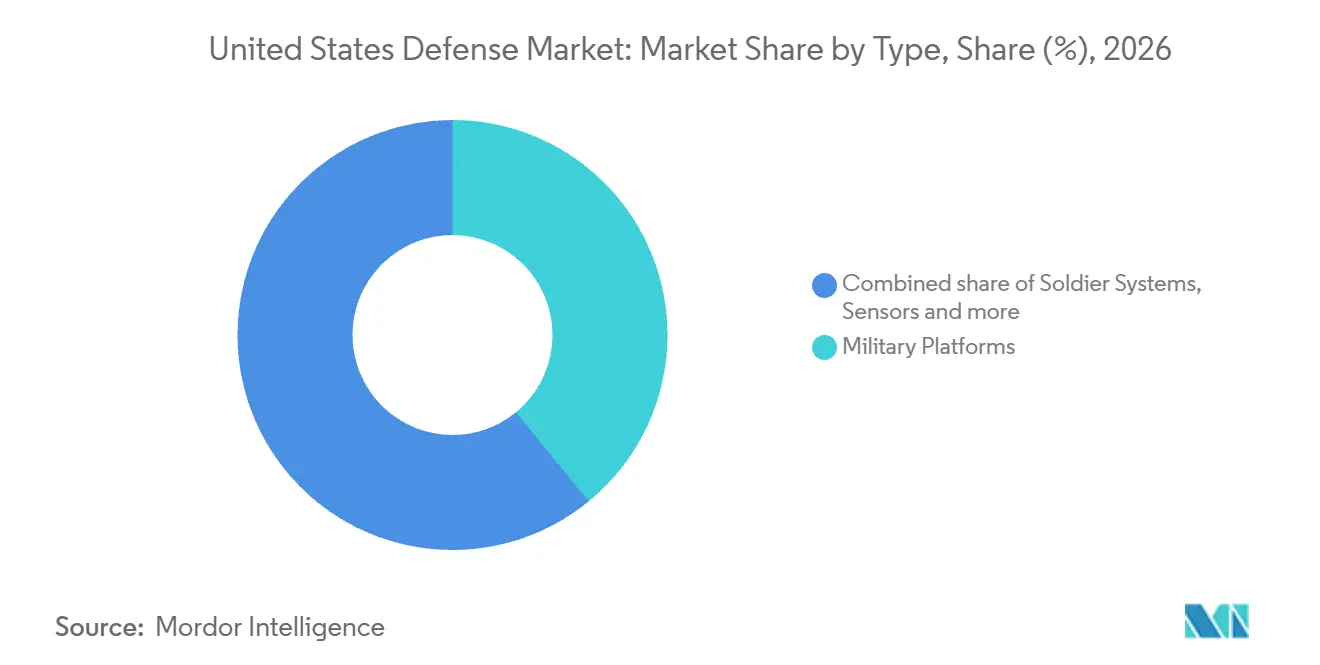
- By type, military platforms accounted for a 39.08% share of the United States defense market size in 2026, while unmanned systems are projected to expand fastest at an 8.3% CAGR during 2027-2032.
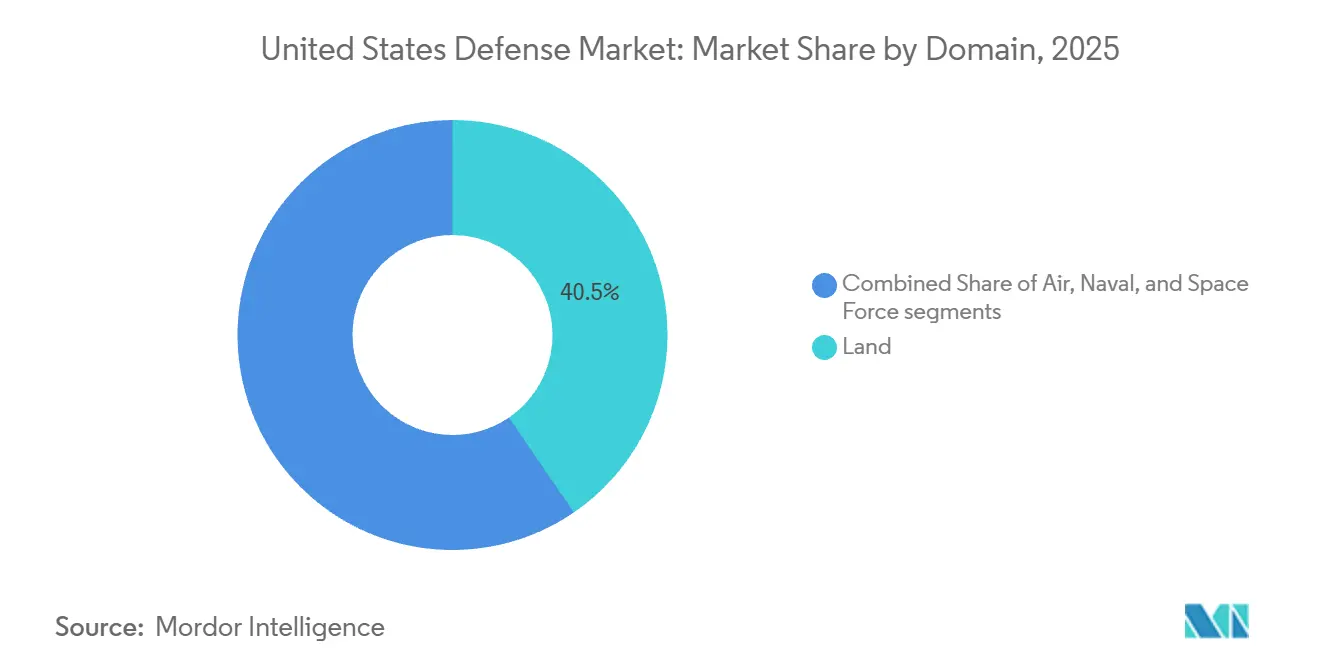
- Across operational domains, land represented 40.17% of the market in 2026, with space forecast to record the highest CAGR of 7.3% during 2027-2032.
- In procurement, indigenous production led with 70.45% of the market in 2026 and is also projected to grow fastest, at a 5.45% CAGR during 2027-2032.
Note: Market numbers in this report are based on Mordor Intelligence's proprietary estimation framework, which combines nine months of actuals with Q4 projections for base year 2026.
Market Trends and Insights
Drivers Impact Analysis of United States Defense Market*
| Driver | (~) % Impact on CAGR Forecast | Geographic Relevance | Impact Timeline |
|---|---|---|---|
| Precision-munitions replenishment and stockpile expansion | +1.8% | Arizona and Florida | Short term (≤ 2 years) |
| Rapid adoption of autonomous and attritable defense systems | +1.4% | Nationwide | Medium term (2-4 years) |
| Allied procurement and co-development expanding production demand | +1.2% | Nationwide | Medium term (2-4 years) |
| AI-enabled C4ISR driving demand for decision-superiority capabilities | +1% | Nationwide | Short term (≤ 2 years) |
| Defense supply-chain reshoring driving domestic capacity expansion | +0.6% | Camden in Arkansas | Long term (≥ 4 years) |
| Contested logistics accelerating distributed sustainment and autonomous resupply | +0.4% | Fort Irwin, California | Long term (≥ 4 years) |
| Source: Mordor Intelligence | |||
Precision-munitions replenishment and stockpile expansion
Precision-munition replenishment creates a production opportunity when continuing military requirements translate into firm manufacturing orders for missiles and associated equipment. The Department of Defense requested USD 490 million in budget authority for 1,509 Javelin missiles in FY2027. On September 3, 2025, the Army awarded the Javelin Joint Venture follow-on production work worth up to USD 900.5 million, including US and foreign military sales orders. Raytheon in Tucson, Arizona, and Lockheed Martin in Orlando, Florida, develop and produce Javelin through the venture. The request adds prospective domestic demand alongside an awarded program whose combined customer base extends beyond US forces. Suppliers gain clearer revenue visibility from awarded production work, while the requested missile volume signals the next potential procurement cycle.
Rapid adoption of autonomous and attritable defense systems
Autonomous navigation is moving into production procurement, creating demand for builders able to convert tested vessels into deliverable fleets. On September 29, 2026, the Navy awarded production agreements for 30 medium unmanned surface vessels to Galliano Marine Services, Huntington Ingalls Industries, and Saronic Technologies.[1] Each agreement covered 10 vessels, with the first deliveries scheduled before the end of FY2027. The preceding at-sea tests assessed autonomous navigation, understanding of the maritime environment, and the ability to conduct a long-duration mission. Splitting the initial buy 3 ways means the first deliveries will test whether each builder can pair demonstrated autonomous navigation with repeatable vessel production.
Allied procurement and co-development expanding production demand
Allied orders can enlarge US missile production programs by adding customers to industrial contracts that also serve American forces. At the end of July 2025, the Pentagon awarded RTX a USD 3.5 billion AMRAAM production contract serving the Air Force, Navy, and allied buyers. It also awarded Lockheed Martin USD 4.3 billion for Joint Air-to-Surface Standoff Missiles and Long-Range Anti-Ship Missiles for US forces and allies. The Lockheed Martin missiles were slated for allies including Poland, the Netherlands, Finland, and Japan, while the AMRAAM missiles were to be sold to allies in Europe, Asia, and the Middle East. The commercial benefit is a wider customer base for sustaining production capacity, accompanied by the need to coordinate domestic and allied delivery commitments within shared programs.
AI-enabled C4ISR driving demand for decision-superiority capabilities
Intelligence buyers gain more from AI when detection capabilities connect with the applications through which military personnel act on information. In March 2026, the National Geospatial-Intelligence Agency (NGA) reported that its cloud-based Maven platform produced millions of detections and had expanded to over 30,000 active users. The program incorporated more than 40 service and combatant-command tools, giving its AI capabilities a broad operational interface.[2] Maven combined automatic object detection, data analytics, and visualization, linking machine-generated findings to usable intelligence products. Combatant commands reported that object of interest detection times fell by as much as 80% in some cases. For suppliers of new detection models, interoperability with Maven’s more than 40 incorporated tools offers a route to a user base exceeding 30,000, linking AI development opportunities to established military applications.
Restraints Impact Analysis of United States Defense Market*
| Restraint | (~) % Impact on CAGR Forecast | Geographic Relevance | Impact Timeline |
|---|---|---|---|
| Defense-industrial capacity gaps and persistent production lead times | -1% | Nationwide | Medium term (2-4 years) |
| Competition for funding, skilled labor, test capacity, and production slots | -0.7% | Nationwide | Long term (≥ 4 years) |
| Cybersecurity and classified-integration requirements slowing software deployment | -0.4% | Nationwide | Short term (≤ 2 years) |
| Test-range, spectrum, and certification bottlenecks delaying autonomous-system validation | -0.2% | Michigan, Utah, Arizona, and Mississippi | Medium term (2-4 years) |
| Source: Mordor Intelligence | |||
Defense-industrial capacity gaps and persistent production lead times
Production ceilings can separate missile procurement demand from the pace at which suppliers deliver usable rounds to military buyers. The US Government Accountability Office (GAO) reported in July 2026 that the Conventional Prompt Strike facility could produce only 6 to 7 rounds annually, below the 12 needed to stabilize production. Lockheed Martin, the missile-body prime contractor responsible for production integration, faced a more labor-intensive build than planned, with excessive hands-on work reported as of March 2025. Excess labor per round consumes the facility time needed to raise annual output, so a larger order cannot by itself close the gap. The output gap exposes the Navy to a longer interval between committed spending and available missile capability if orders expand faster than manufacturing throughput.
Competition for funding, skilled labor, test capacity, and production slots
Skilled-trades availability constrains naval procurement because an awarded shipbuilding contract cannot substitute for the workers needed to execute it. GAO’s preliminary April 2026 findings identified recruitment, training, and retention challenges at Navy shipbuilders, with workforce issues contributing to delays and significant risk in several programs.[3] The affected skills included welding, pipefitting, and machining, tying the constraint to physical production rather than contract administration. An April 2025 Navy contract modification funded wage enhancements for preexisting nuclear shipbuilding contracts, and one shipbuilder reported improved recruiting and retention. For naval buyers, labor recovery is a prerequisite to delivery recovery, making additional funding an incomplete remedy for schedule risk.
*Our forecasts treat driver/restraint impacts as directional, not additive. The impact forecasts reflect baseline growth, mix effects, and variable interactions.
United States Defense Market Segment Analysis
By Armed Forces:
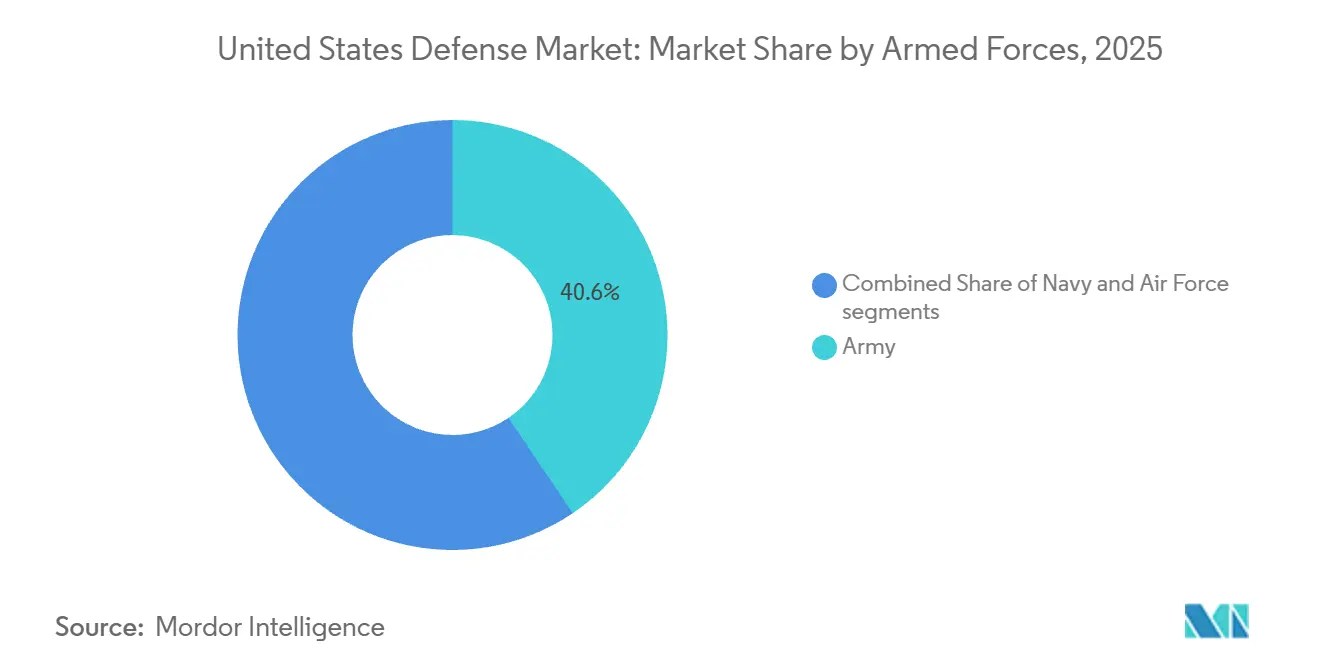
Army Scale Meets Air Force ModernizationThe Army accounted for a 40.23% share of the United States defense market size in 2026, making it the largest segment. On September 3, 2025, it finalized a USD 9.8 billion multiyear contract with Lockheed Martin Missiles and Fire Control. The agreement covered FY2024-FY2026 and procurement of 1,970 PAC-3 MSE missiles and associated hardware for US and international partners. Combining missile volumes and associated hardware makes manufacturing throughput and component coordination part of the same commercial commitment. The multiyear scope gives missile and associated-hardware suppliers a common order horizon across the Army-led program.
The Air Force is forecast to be the fastest-growing segment, with a 5.4% CAGR during 2027-2032. In May 2026, it awarded Boeing USD 219 million for the first 14 T-7A production trainers and associated support. Spare parts, support equipment, and training were included after the April 23 decision clearing the aircraft for low-rate production. Because spares, support equipment, and instruction accompany the first lot, the commercial scope extends to preparing the Air Force to use its new trainers.


By Type:
Platform Scale and Unmanned Procurement GrowthMilitary platforms represented a 39.08% United States defense market share in 2026, making them the largest segment by type. The US F-35 fleet grew from about 450 aircraft in FY2021 to more than 800 in FY2025. On July 29, 2026, the Navy awarded General Dynamics Electric Boat, a General Dynamics business unit, USD 29.5 billion for 5 additional Columbia-class submarines. The package also awarded the business USD 42.1 billion for 9 additional Virginia-class submarines, alongside separate infrastructure support. Aircraft fleet counts and submarine contract values capture different commercial exposures, so a small hull order can carry substantial supplier commitments alongside a much larger aircraft base.
Unmanned systems are forecast to be the fastest-growing segment, at an 8.3% CAGR during 2027-2032. The PRIME program generated a production contract for more than 200 small unmanned surface vehicles supporting INDOPACOM. The program fielded 66 vehicles in 2025 under a USD 392.4 million contract ceiling. The Defense Innovation Unit and Naval Sea Systems Command’s Program Manager, Ships (PMS) 420, transitioned the program from prototyping through validation to production in under 15 months. Fielding 66 of the more than 200 ordered vehicles in 2025 moved the program beyond prototyping, anchoring supplier revenue opportunities in deliveries against an awarded production order.
By Domain:
Land Procurement and Space Architecture DivergeLand was the largest segment by domain, with 40.17% of the market in 2026. For FY2027, the Department of Defense requested USD 1.16 billion in budget authority and 196 Armored Multi-Purpose Vehicles, a tracked ground-system program. The requested annual quantity would create repeated construction work for tracked-vehicle suppliers if it becomes an order. Because these figures are a request, the 196 vehicles represent a potential production pipeline whose timing depends on funding and contracting.
Space is projected to be the fastest-growing segment, at a 7.3% CAGR during 2027-2032. On July 13, 2026, the Space Development Agency awarded 2 prototype agreements totaling approximately USD 1.75 billion for 36 space vehicles. The awards comprised 18 missile-warning and tracking vehicles and 18 missile-defense vehicles across 4 orbital planes. Future operations and sustainment belong to the Space Force, linking the awarded hardware to an eventual military operating architecture. Because the awards support Golden Dome’s space-based capabilities, the 18 missile-warning and tracking vehicles and 18 missile-defense vehicles tie this demand to missile-defense sensing rather than to satellite volume alone.
By Procurement Nature:
Domestic Completion Capacity ExpandsIndigenous production was the largest segment, with 70.45% of the market in 2026, and is forecast to be the fastest-growing segment, at a 5.45% CAGR during 2027-2032. The Army and General Dynamics opened a facility in Camden, Arkansas, on April 22, 2025. It contained 2 new lines for the final loading, assembly, and packing of 155 mm high-explosive artillery munitions. The added lines broaden the Army’s domestic production base at the completion stage, so their ramp-up governs how quickly this investment contributes deliverable rounds.
For foreign procurement, DoD buyers report foreign-manufactured end products under categories including qualifying-country products, domestic nonavailability, trade-agreement eligibility, and unreasonable domestic cost. Under FAR 25.103(c), a contracting officer may acquire a foreign end product when domestic cost is determined unreasonable under the specified evaluation rules. This route makes the domestic-price assessment commercially relevant to a foreign supplier’s offer. A lower foreign price alone does not settle the opportunity, because the officer’s applicable cost determination governs whether this exception can be used.
Geography Analysis
Connecticut and Virginia anchor substantial submarine supplier networks, giving the industrial geography a strong naval production component. The Submarine Industrial Base Council identified 342 submarine industrial base suppliers in Connecticut in its 2026 state coverage. Virginia’s corresponding coverage included 285 submarine industrial base suppliers, establishing another extensive network within the same equipment category. Connecticut’s larger listing and Virginia’s comparable supplier count spread submarine subcontract participation across 2 states rather than a single hub.
In Texas, the Army awarded Hadrian Automation the first phase of an advanced manufacturing project at Red River Army Depot in Texarkana in March 2026. Work aimed at modernizing weapon-system component production, including small unmanned aircraft systems, was scheduled for completion by March 16, 2027. Ohio added a distinct production milestone on July 27, 2026, when Anduril’s first Ohio-built Fury semi-autonomous fighter, developed for the Air Force, rolled off the Arsenal-1 line in Pickaway County. The commercial contrast is between depot component modernization and complete-aircraft production, giving suppliers different industrial entry points within the shift toward automated manufacturing and unmanned capabilities.
California and West Virginia illustrate how defense production extends beyond complete platforms to specialized payloads and missile integration. Boeing opened an electro-optical/infrared payload line in El Segundo to support Millennium Space Systems’ scheduled delivery of 12 Space Force missile-warning and tracking medium Earth orbit vehicles in 2027. Northrop Grumman opened a production and assembly center at Allegany Ballistics Laboratory within the Naval Industrial Reserve Ordnance Plant in Rocket Center, West Virginia, on September 25, 2025. The new center was intended to expand advanced strike missile production capacity. Specialized completion work gives these locations a commercial role within larger defense programs, allowing participation through a particular manufacturing stage rather than an entire platform build.
Regulatory Framework and Outlook
The comparison covers selected jurisdictions from the perspective of defense contractors operating mission-critical facilities. Federal acquisition requirements govern contractor participation, while Virginia adds a qualified operating allowance for mission-critical emergency generators. Federal cybersecurity assessment duties attach to applicable contracts, while Virginia’s air-rule allowance attaches to certified generators, so the comparison shows distinct compliance concerns for the same contractor.
Regulatory Table of United States Defense Market
| Decision factor | United States | Virginia |
|---|---|---|
| Primary authority | Department of Defense | Virginia Department of Environmental Quality (DEQ) |
| Key instruments or direction | Defense Federal Acquisition Regulation Supplement (DFARS) and CMMC Phase I self-assessments for applicable contracts | 9VAC5-80-1111 and related 9VAC5-540 amendments |
| Commercial effect | Contractor qualifications and applicable cybersecurity self-assessment duties | Up to 50 hours per year of specified non-emergency generator operation with required mission-critical certification |
| Current policy attractiveness | Medium | Medium |
| Future direction of policy attractiveness | Easing | No change |
| Source: Mordor Intelligence | ||
Federally, the July 13, 2026, suspension of CMMC Phase II paused the planned November 10, 2026, third-party assessment step for contracts involving sensitive but unclassified information. The suspension eases the planned assessment sequence, while Phase I self-assessments that remain in force for applicable contracts keep the federal rating at Medium. Virginia’s generator owners retain certifications for the generator’s life and revise and submit them when qualification ends, while listed emergency operations fall outside the 50-hour annual allowance. Virginia’s rule effective June 16, 2025, established the conditional 50-hour allowance on and off military installations, and the allowance remains in force, supporting No change, while required DoD or armed-service certification to DEQ and federal engine compliance justify Medium.
Value Chain Stages
The comparison follows defense equipment from development through manufacturing to support during military service. Northrop Grumman’s aircraft business designs, produces, integrates, sustains, and modernizes aircraft for the Air Force, Navy, and other customers. Those linked capabilities create several earning points within one program, so commercial value extends beyond the initial equipment sale.
Value Chain Analysis Table of United States Defense Market
| Primary activity | Key participants | Value capture | Bottleneck | Resilience response |
|---|---|---|---|---|
| System design and development | Aircraft and weapons developers such as Northrop Grumman Corporation and Lockheed Martin Corporation | Engineering and development contract revenue | Translating designs into repeatable production | Include manufacturing requirements in development reviews |
| Manufacturing and systems integration | Aircraft integrators such as Northrop Grumman Corporation; missile producers such as Raytheon, an RTX business | Equipment sales and integration fees | Throughput during production ramps | Expand dedicated manufacturing capacity |
| Sustainment and modernization | Military aircraft support providers such as Northrop Grumman Corporation and Lockheed Martin Corporation | Sustainment and modernization contract revenue | Coordinating support across different aircraft programs | Use program-specific support teams |
| Source: Mordor Intelligence | ||||
Raytheon increased output by 20% across several critical programs in 2025, while RTX invested in additional Tucson munitions and sensor capacity. Additional factory capacity addresses the manufacturing bottleneck, while aircraft sustainment requires program-specific support capabilities. Production expansion can enlarge equipment sales without securing the subsequent service work, making lifecycle capabilities a separate source of value capture.
Competitive Landscape
Market Concentration

Competition is concentrated around established program suppliers whose specialized businesses perform distinct parts of the work. Lockheed Martin Corporation supplies missiles, while The Boeing Company produces PAC-3 seekers. General Dynamics Corporation participates in naval construction through NASSCO, while RTX Corporation’s Raytheon business supplies missiles and Northrop Grumman Corporation contributes to F-35 programs. In 2025, the Navy awarded Raytheon, an RTX business, a USD 1.1 billion contract for AIM-9X Block II missiles, with production set to rise to 2,500 missiles per year. Northrop Grumman reported USD 3.3 billion in new 2025 F-35 awards across its Mission Systems and Aeronautics Systems segments.
Supplier strategy can run through subsystem contracts when one contractor supplies a critical component to another’s program. On October 14, 2025, Boeing reported approximately USD 2.7 billion in multiyear contracts for more than 3,000 PAC-3 seekers, with deliveries planned at rates up to 750 annually through 2030. Boeing’s seeker role links the Army’s interceptor production targets to a component supplier working with Lockheed Martin, the PAC-3 interceptor prime. At up to 750 seekers a year, delivering more than 3,000 takes at least 4 years, which makes the seeker line a multiyear commitment tied to PAC-3 interceptor output.
Federal cloud security qualification is a separate regulatory consideration alongside the manufacturing capabilities of equipment suppliers. Govini’s Ark.ai, a defense-acquisition and analytics software service, earned FedRAMP Class D (High) certification on April 29, 2025. The credential applies to the cloud service offering. On August 21, 2025, the Army awarded Lockheed Martin USD 720 million for JAGM and HELLFIRE production for Army, Navy and international customers, the final follow-on under its multiyear contract. The follow-on award anchors Lockheed Martin’s competitive direction in production for several customer groups, while Ark.ai’s service-specific credential provides a security qualification around which Govini can seek federal analytics business.
United States Defense Industry Leaders
-
Lockheed Martin Corporation
-
The Boeing Company
-
General Dynamics Corporation
-
RTX Corporation
-
Northrop Grumman Corporation
- *Disclaimer: Major Players sorted in no particular order
United States Defense Market Companies Covered in this Report
- Lockheed Martin Corporation
- RTX Corporation
- The Boeing Company
- General Dynamics Corporation
- Northrop Grumman Corporation
- L3Harris Technologies, Inc.
- BAE Systems plc
- Huntington Ingalls Industries, Inc.
- Textron Inc.
- CACI International Inc
- Kongsberg Gruppen ASA
- Airbus SE
- General Atomics
- Teledyne Technologies Incorporated
- AeroVironment, Inc.
- Leidos Holdings, Inc.
Key Opportunities for Market Participants
The opportunities compare replacement equipment and integration work for dispersed military operations. The Defense Innovation Unit is accepting submissions through October 28, 2026, for a Marine Corps replacement family of mobile electric power distribution panels. A separate maritime challenge accepts submissions through November 30, 2026, for integrated unmanned surface vessels and hard-kill counter-air effectors, with testing planned for early 2027. Selection and potential follow-on production remain conditional, with power suppliers addressing a supportable panel family and maritime entrants needing a complete vessel, launcher, and effector combination for evaluation.
Market Opportunities Table of United States Defense Market
| Opportunity | Why now | Buyer / lead segment | Recommended play | Main barrier | Likely beneficiaries |
|---|---|---|---|---|---|
| Replacement mobile power panels | Fielded panels have reached the end of their life cycles | Marine Corps mobile power users | Offer a logistically supportable panel family | Supportability across dispersed operations | Defense power-distribution equipment suppliers |
| Integrated maritime counter-air packages | Buyer seeks mature systems suitable for fielding within 120 days | Navy maritime defense | Combine a vessel, launcher, and effector in one submission | Complete-system integration and fielding readiness | Unmanned-vessel and counter-air system integrators |
| Power-distribution interface integration | Dispersed operations increase the consequences of distribution inefficiencies | Marine Corps | Align replacement panels and required interfaces as one supportable family | Engineering consistent interfaces within the specified scope | Military electrical integration and support providers |
| Source: Mordor Intelligence | |||||
The central opening is integration that makes dispersed defense equipment deployable and supportable. For maritime suppliers, the 120-day fielding requirement concentrates that value in production-ready combinations. For power suppliers, a supportable panel family creates a potential path from individual replacement items to continuing interface and support work.
Recent Industry Developments in United States Defense Market
- Oct 2026: The Army awarded the Javelin Joint Venture a USD 215 million production contract for Lightweight Command Launch Units, following its first unit deliveries 5 months earlier. The venture partners are Raytheon, an RTX business, and Lockheed Martin.
- Oct 2026: Raytheon, an RTX business, was selected to modernize Space Force radar sites through the Ground-Based Radar Digitization program, with prototype delivery preceding a planned transition to rapid fielding.
- Sep 2026: The Navy awarded agreements for 30 medium unmanned surface vessels to Galliano Marine Services, Huntington Ingalls Industries, and Saronic Technologies. Each agreement covered 10 vessels, with first deliveries scheduled before the end of FY2027.
United States Defense Market Report Scope and Research Methodology
Market Definition and Coverage
The United States defense market measures annual US government spending on capabilities and support for the US Department of Defense and the US Armed Forces. It covers procurement, modernization, research and development, and lifecycle support in the United States.
Scope exclusions: Military personnel pay, benefits, and pensions, US defense appropriations without a corresponding counted purchase, defense products and services sold to foreign armed forces, and general-purpose civilian products and services bought for non-defense use are excluded.
Segments Covered in This Report
- By Armed Forces
- Air Force
- Army
- Navy
- Space Force
- By Type
- Soldier Systems
- Sensors
- C4ISR and Tactical Communications
- Military Platforms
- Weapons and Ammunition
- Unmanned Systems
- Electronic and Cyber Warfare Systems
- Military MRO
- Personal Training and Simulation
- Military Infrastructure
- By Domain
- Land
- Air
- Naval
- Space
- By Procurement Nature
- Indigenous Production
- Foreign Procurement
Data Sources, Market Sizing, and Validation
Desk Research
Congressional Research Service summaries, such as its FY2025 budget request analysis, distinguish procurement, research and development, operations, and personnel appropriations, helping analysts separate contractor purchases from broader budget totals. GAO's defense industrial base reviews and the USAspending API provide evidence on awards, procurement records, supplier origin, and contract timing. SIPRI's military expenditure data offers a wider spending cross-check, while Navy program releases, such as its 2026 unmanned vessel procurement notice, can illustrate how awards translate into defined purchases.
Company annual filings, investor materials, and reputable defense and financial press can add program, product, delivery, and revenue context and can be checked against public award and budget records. The named sources are illustrative and not exhaustive, and further sources inform collection, validation and clarification.
Primary Interviews and Surveys
Analysts can interview US defense contractors, service acquisition and program personnel, and specialists in procurement, finance, manufacturing, and sustainment to clarify how awards, deliveries, and support contracts map to the defined market. Respondents can review secondary-source interpretations of procurement, research and development, modernization, and lifecycle support, identify omitted transactions or possible double counting, and explain changes in program timing or scope. Where evidence remains incomplete, analysts can compare award records, budget documentation, company disclosures, and independent program evidence, then seek targeted clarification from relevant respondent types.
Distribution of primary research fieldwork respondents
| Company type | Respondent position | Region |
|---|---|---|
| Top tier: 37% | CXOs: 17% | |
| Mid tier: 40% | Functional/Unit leaders: 33% | |
| Smaller Players: 23% | Managers: 50% |
Market-Sizing & Forecasting
The model estimates annual US defense purchases from a top-down view of government-funded capability and support transactions, using budget and contract evidence to distinguish actual purchases from appropriations that do not reach a counted sale. Procurement and modernization awards, research and development contract values, maintenance and repair activity, military construction and training purchases, and service-level delivery schedules provide market-specific indicators for the annual value and timing of demand. Analysts derive armed-force, product, domain, and procurement-nature shares from the stated buyer, transaction purpose, and program content, then check selected totals against supplier disclosures and sampled contract or channel evidence. Gaps in contract descriptions are classified from program documentation and clarified where possible, while unresolvable items are bounded and kept from being counted twice. Forecasts can use multivariate regression where a stable relationship links spending to these indicators, with scenario analysis for major program starts, delays, or funding shifts. Subject-matter respondents can test the direction and timing of variable-level forecasts and flag capacity or execution constraints without substituting opinion for documented values.
Data Validation & Update Cycle
Analysts triangulate award records, budget series, program documents, supplier disclosures, and independent military-spending signals, checking that each source refers to the same buyer, purchase stage, period, and dollar basis. They investigate anomalous year-to-year movements, missing contract values, duplicate program or subcontract reporting, and material differences between independent estimates, resolving each issue through source review and a second analyst review before sign-off. Analysts re-contact relevant respondent types when a source conflict, newly changed award, unclear transaction boundary, or material program delay could alter the estimate. They refresh the model annually, update it between annual cycles for material events, and complete a fresh source and calculation review before delivery.
Mordor Intelligence's United States Defense Market Size Compared With Other Published Estimates
Published estimates can differ in the transactions and products they count and the inputs used to model demand. The United States defense market measures annual US government spending on capabilities and support for the US Department of Defense and the US Armed Forces.
Key Gap Drivers include the study's defined coverage and market-specific modeling choices. Procurement and modernization awards, research and development contract values, maintenance and repair activity, military construction and training purchases, and service-level delivery schedules provide market-specific indicators for the annual value and timing of demand.
Benchmark comparison
| Source | Market Size | Gaps in Research Methodology |
|---|---|---|
| Mordor Intelligence | USD 367.4 B (2027) | |
| Global Consultancy A | USD 337.63 B (2025) | At its 2025 base, this estimate is 8.1% below this report's 2027 value of USD 367.4 B, 2 years later. This 2025 market estimate is lower than the report's later-year figure because its published forecast projects growth from the earlier measured year. |
| Global Consultancy B | USD 1.05 T (2026) | At its 2026 base, this estimate is 185.8% above this report's 2027 value of USD 367.4 B, 1 year later. This budget total is higher because it includes broad defense appropriations beyond contractor capability and support purchases. |
Mordor Intelligence's analysts triangulate award records, budget series, program documents, supplier disclosures, and independent military-spending signals, checking that each source refers to the same buyer, purchase stage, period, and dollar basis.
Key Questions Answered in the Report
What is the United States defense market size and growth outlook?
It is estimated at USD 367.4 billion in 2027 and forecast to reach USD 449.6 billion by 2032, at a 4.12% CAGR during 2027-2032.
What is driving demand for US defense equipment?
Missile replenishment and autonomous-system procurement are key drivers. In September 2026, the Navy awarded agreements for 30 medium unmanned surface vessels.
Which armed service accounts for the largest share of the US defense market?
The Army held 40.23% of the market in 2026. The Air Force is forecast to grow fastest, at a 5.4% CAGR during 2027-2032.
Which companies are major US defense suppliers?
Major suppliers include Lockheed Martin Corporation, The Boeing Company, General Dynamics Corporation, RTX Corporation, and Northrop Grumman Corporation.
What could slow military equipment deliveries?
Manufacturing and workforce constraints can slow deliveries. GAO reported in July 2026 that the production facility for the Navy’s Conventional Prompt Strike program could produce 6 to 7 rounds annually, below the 12 needed to stabilize production.
How do US states contribute to defense production?
In 2026, the Submarine Industrial Base Council covered 342 submarine industrial base suppliers in Connecticut and 285 in Virginia. Hadrian Automation received an Army component-manufacturing modernization award for Texarkana, Texas, in March 2026.