
Magnesium Compounds Market Size and Share
Market Overview
| Study Period | 2021 - 2031 |
|---|---|
| Market Size (2026) | USD 14.58 Billion |
| Market Size (2031) | USD 18.72 Billion |
| Growth Rate (2026 - 2031) | 5.13 % |
| Fastest Growing Market | Asia Pacific |
| Largest Market | Asia Pacific |
| Market Concentration | Low |
Major Players *Disclaimer: Major Players sorted in no particular order Image © Mordor Intelligence. Reuse requires attribution under CC BY 4.0. | |
Magnesium Compounds Market Analysis by Mordor Intelligence
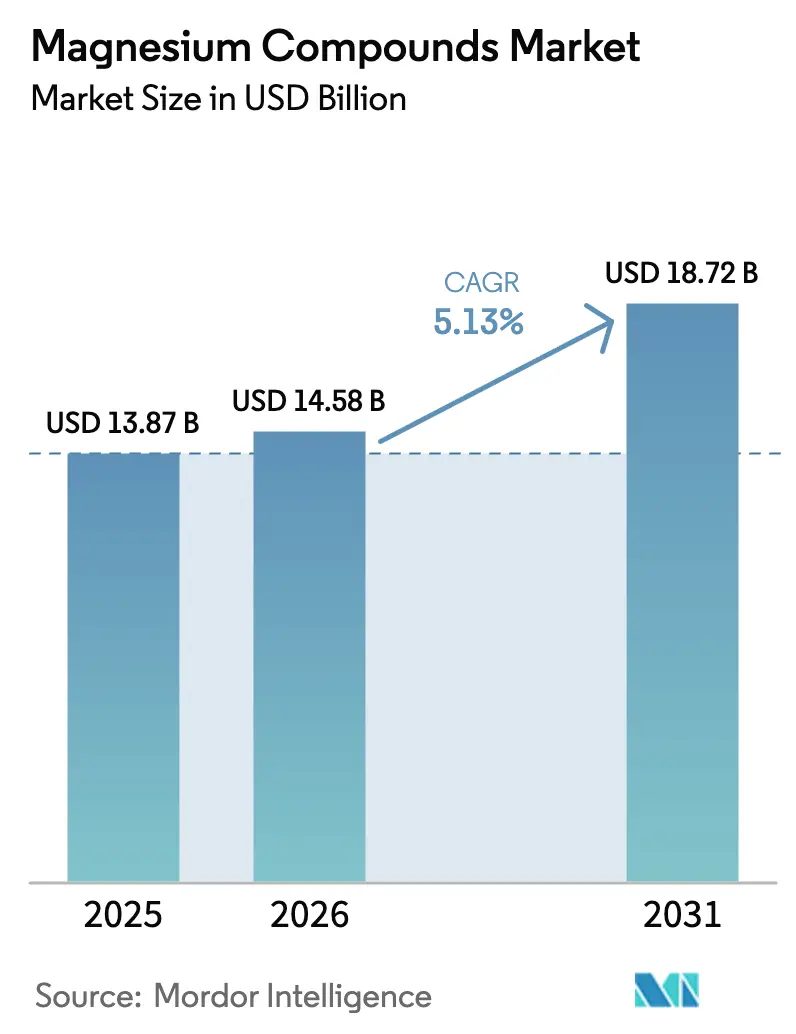
The Magnesium Compounds Market size is projected to expand from USD 13.87 billion in 2025 and USD 14.58 billion in 2026 to USD 18.72 billion by 2031, registering a CAGR of 5.13% between 2026 to 2031. Refractory demand still drives volume, yet higher growth now comes from electrical and electronics applications because fire-safety rules and battery thermal-management needs boost magnesium hydroxide usage. Desalination-brine valorization is trimming feedstock costs below USD 200 per tonne in the Middle East and Australia, giving seawater-sourced material a 6.18% growth path that challenges the dominance of natural brines. Supply security has risen on executive agendas since the March 2024 bankruptcy of US Magnesium, which eliminated the only United States primary producer and widened dependence on Chinese exports. Low-carbon electrolysis projects in Europe and North America are attracting premium contracts from auto and electronics buyers eager to decarbonize.
Key Report Takeaways
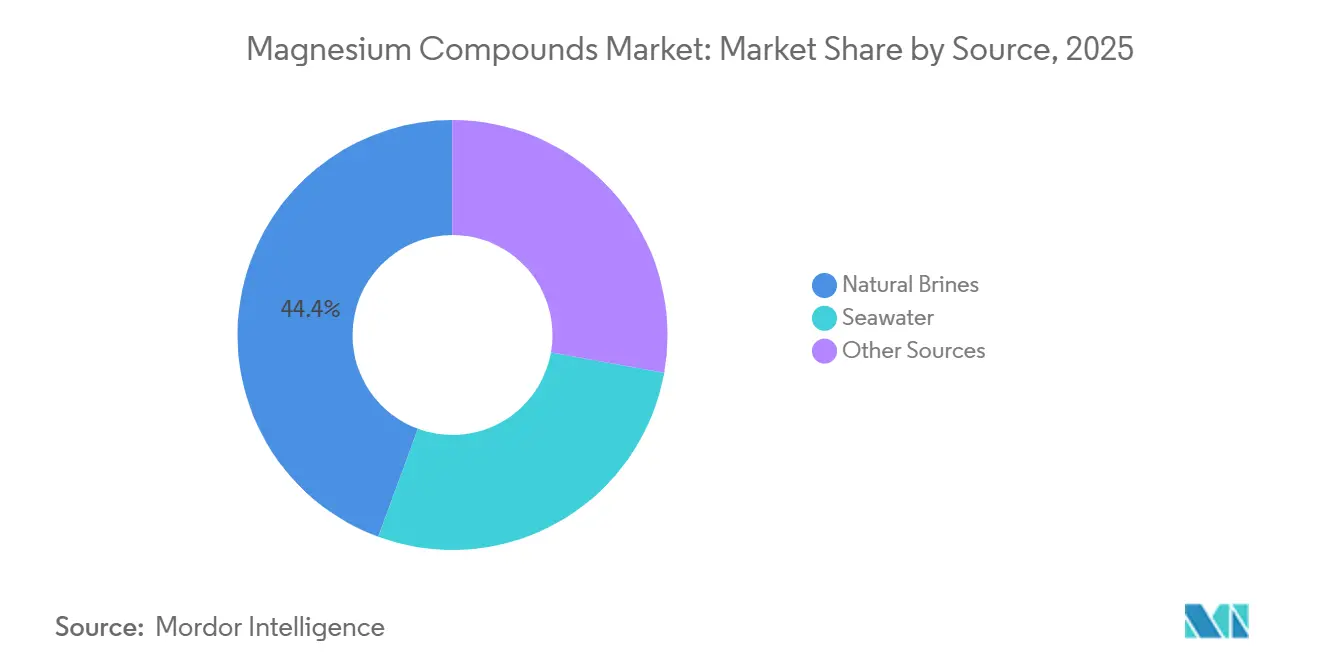
- By source, natural brines accounted for 44.38% of the magnesium compounds market share in 2025, while seawater-based production is the fastest-growing source at a 6.18% CAGR through 2031.
- By product type, inorganic chemicals led with 71.46% revenue share in 2025; organic magnesium salts record the highest projected CAGR at 6.24% to 2031.
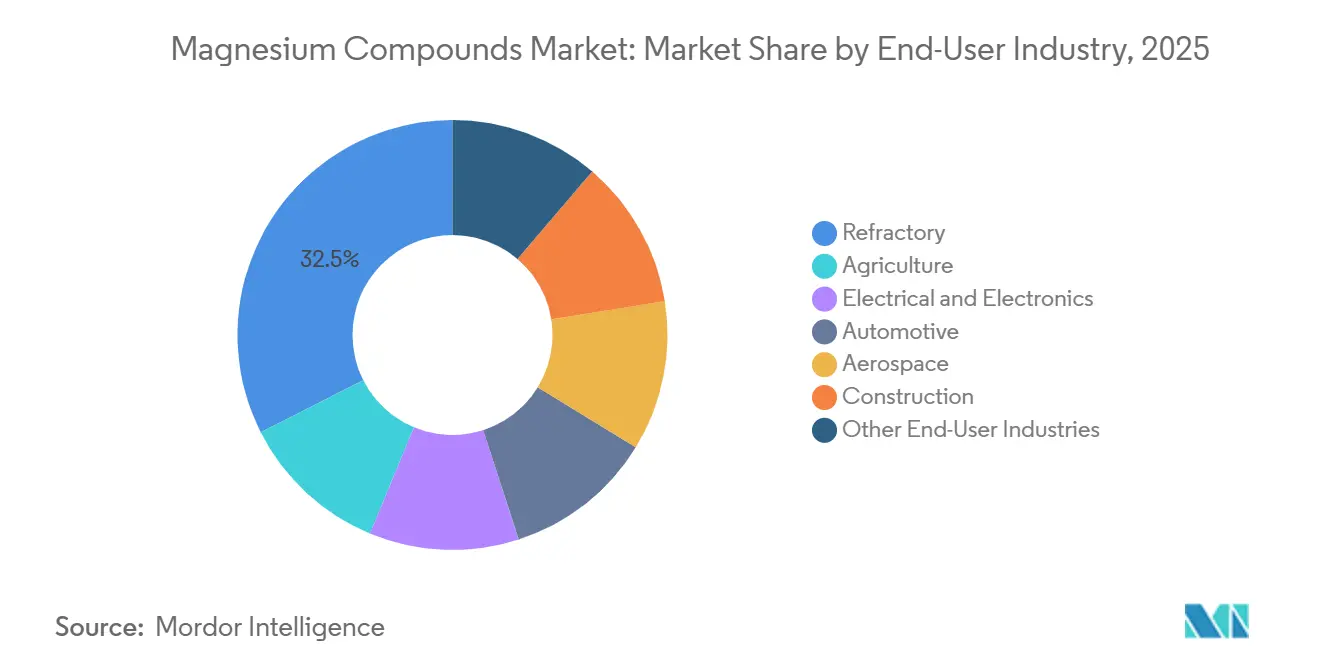
- By end-user industry, refractories held 32.47% of the magnesium compounds market size in 2025, whereas electrical and electronics is advancing at a 6.31% CAGR to 2031.
- By geography, Asia-Pacific commanded 53.28% of the 2025 value, and at 5.94% it remains the fastest expanding regional segment to 2031.
Note: Market size and forecast figures in this report are generated using Mordor Intelligence’s proprietary estimation framework, updated with the latest available data and insights as of January 2026.
Global Magnesium Compounds Market Trends and Insights
Drivers Impact Analysis*
| Drivers | (~) % Impact on CAGR Forecast | Geographic Relevance | Impact Timeline |
|---|---|---|---|
| Booming refractory demand from reviving global steel output | +1.2% | Asia-Pacific core, spill-over to Europe and Middle East | Medium term (2-4 years) |
| Stringent wastewater and flue-gas norms spurring Mg-based environmental reagents | +0.9% | Global, early enforcement in North America and EU | Short term (≤ 2 years) |
| Soil-magnesium depletion accelerating fertilizer-grade Mg salts usage | +0.7% | North America, South America, Asia-Pacific | Long term (≥ 4 years) |
| Desalination-brine valorization unlocking ultra-low-cost Mg feedstocks | +0.6% | Middle East, Australia, California | Medium term (2-4 years) |
| Rapid adoption of low-carbon magnesium-phosphate cements | +0.5% | Europe, Asia-Pacific, North America | Long term (≥ 4 years) |
| Source: Mordor Intelligence | |||
Booming Refractory Demand from Reviving Global Steel Output
In early 2025, crude steel production saw a year-on-year increase. However, in 2024, prices for refractory-grade magnesia dipped, a decline attributed to persistently high inventories in Liaoning. While Indian capacity additions received approval in 2024, they are expected to start influencing refractory orders after the typical 18-to-24-month delay. Electric-arc furnaces, accounting for a significant portion of global steel output, are known to shorten lining life, consequently increasing the frequency of brick replacements. RHI Magnesita reported an uptick in Asian refractory consumption, contrasting with stagnant volumes in Europe. The magnesium compounds market stands to gain, as magnesia bricks are crucial for withstanding the heightened thermal shocks associated with EAF operations.
Stringent Wastewater and Flue-Gas Norms Spurring Mg-Based Environmental Reagents
In April 2024, the U.S. EPA mandated a sulfur-dioxide capture rule for primary magnesium refiners, compelling plants to adopt magnesium-oxide scrubbers that also function as product-recovery systems[1]. In 2025, Europe imposed stricter phosphorus discharge limits on municipal wastewater, favoring magnesium hydroxide over lime due to its ability to reduce sludge volumes. In 2025, Israel Chemicals announced increased sales of magnesium hydroxide slurry to EU utilities, attributing the success to their ISO 14001-certified output. With similar policies emerging in Asia, there's a growing expectation that environmental-grade magnesium compounds will command premium prices and capture additional market volumes.
Soil-Magnesium Depletion Accelerating Fertilizer-Grade Mg Salts Usage
In 2024, USDA field work revealed that maize and soybean yields declined when soil magnesium levels dipped below 50 ppm. The issue worsened with high-potassium fertilizer regimens, leading agronomists to advocate for magnesium sulfate side-dress applications. In 2025, TIMAB Magnesium introduced a coated oxide granule that boosted nutrient-use efficiency in trials with Brazilian soybeans. While fertilizer buyers remain sensitive to prices, the market penetration of magnesium compounds is poised to rise, driven by the increasing prevalence of remote sensing and soil-testing services.
Desalination-Brine Valorization Unlocking Ultra-Low-Cost Mg Feedstocks
In 2024, global desalination plants released brine daily, containing magnesium. Magrathea Metals, leveraging coastal wind power, extracts magnesium hydroxide from Pacific seawater through colocated electrolysis. Verde Magnesium is investing in a Romanian venture, aiming to launch a plant by 2027. This facility is designed to comply with EU Carbon Border regulations, boasting a low carbon footprint. Collectively, these initiatives expand the raw material landscape for the magnesium compounds sector and help stabilize feedstock costs.
Restraints Impact Analysis*
| Restraints | (~) % Impact on CAGR Forecast | Geographic Relevance | Impact Timeline |
|---|---|---|---|
| Price-sensitive substitution by Ca or Al compounds | -0.8% | Global, acute in South Asia and Africa | Short term (≤ 2 years) |
| Supply-chain volatility driven by China-centric production | -0.7% | North America and Europe | Medium term (2-4 years) |
| ESG scrutiny of Pidgeon-route carbon footprint | -0.5% | Asia-Pacific, Europe, North America | Long term (≥ 4 years) |
| Source: Mordor Intelligence | |||
Price-Sensitive Substitution by Ca or Al Compounds in Several End-Uses
Calcium carbonate is about half the cost of light-burned magnesia and is the go-to filler when flame retardancy isn't a priority[2]. In 2025, aluminum hydroxide commanded a dominant share of the global flame-retardant market, bolstered by longstanding certifications. While construction budgets in India and Southeast Asia lean towards locally sourced lime for water treatment, opting for it over imported magnesium hydroxide, there are noted performance trade-offs. These economic choices result in a deduction from the baseline CAGR.
Supply-Chain Volatility Driven by China-Centric Production and Energy Costs
In 2024, coal prices at Qinhuangdao fluctuated, impacting production costs, even as Liaoning province accounted for a significant share of Europe's magnesia imports. Following the bankruptcy of US Magnesium, buyers turned to imports, now subject to tariffs until 2026. Late in 2024, freight costs from Dalian to Rotterdam surged, doubling in price, as container availability was compromised by diversions in the Red Sea. Such market volatility undermines buyer confidence, leading to delays in long-term contracts and a consequent growth restraint.
*Our forecasts treat driver/restraint impacts as directional, not additive. The impact forecasts reflect baseline growth, mix effects, and variable interactions.
Segment Analysis
By Source: Natural Brine Scale vs. Seawater Disruption
Natural brines held 44.38% of the 2025 volume and remain the low-cost base for commodity magnesia, anchored by Dead Sea operations. Seawater-derived output, while a mid-teen share today, is set for 6.18% annual growth as electrolysis costs fall and ESG audits favor its lower carbon footprint.
The magnesium compounds market benefits from this dual structure because high-purity products can be sourced from seawater without displacing large-scale brine evaporation assets. Magrathea Metals showed that seawater operating costs already undercut Great Salt Lake brine in pilot runs. If coastal projects replicate at scale, commodity suppliers may pivot excess brine capacity toward refractory grades while seawater plants serve electronics and pharma buyers.

By Product Type: Organics Move Up the Value Chain
Inorganic chemicals commanded 71.46% of revenue in 2025, supported by refractory bricks, environmental reagents, and fertilizers. Organic magnesium compounds expanded 6.24% per year because FDA-cleared drugs rely on magnesium stearate, while nutraceutical brands market chelated forms at premium prices.
The magnesium compounds market size linked to organic grades is small but profitable. In 2025, pharmaceutical-grade stearate prices remain high, largely due to the entry hurdles posed by GMP certification. TIMAB’s controlled-release oxide blurs the inorganic-organic divide by adding coating technology that raises nutrient-use efficiency.
By End-User Industry: Electronics Outpace Refractories
Refractories took 32.47% of 2025 demand, tied to steel and cement cycles. Electrical and electronics applications now grow at 6.31% a year, fueled by halogen-free fire standards in EV battery packs and the thermal conductivity needs of 5G equipment.
The magnesium compounds market share for flame-retardant hydroxide will broaden as regulators tighten rules on brominated additives. In 2025, Japanese fabs boosted their purchases of semiconductor-grade MgO, highlighting a shift towards sourcing high-purity supplies.
Geography Analysis
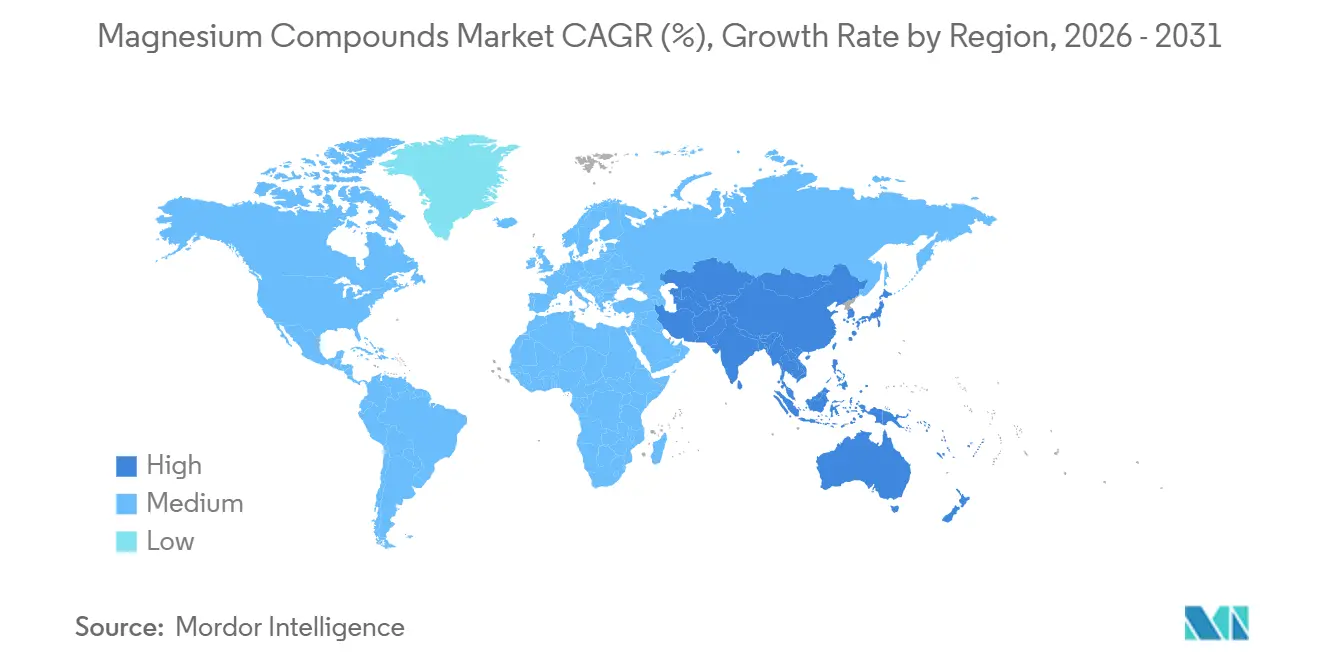
Asia-Pacific supplied 53.28% of the 2025 value and should grow 5.94% to 2031 despite Liaoning’s capacity freeze. India’s new steel projects and Japan’s specialty-grade exports offset slower Chinese construction.
After the shutdown at the Great Salt Lake, North America faced tighter supply but maintained a significant market share. Despite facing tariffs on imports, buyers are still willing to pay a premium for non-Chinese supplies. This scenario is paving the way for seawater ventures to flourish along the Pacific coast.
Europe's market share largely hinges on Nedmag’s operations in the Netherlands and the upcoming Verde Magnesium plant. Set to launch in the coming years, this plant is poised to reduce Europe's import dependency. Meanwhile, South America and the Middle East, driven by Brazilian fertilizer needs and brine projects in the Gulf Cooperation Council (GCC), together account for a notable portion of the market.
Value Chain Analysis
Upstream supply for magnesium compounds begins with magnesite and dolomite mining and natural brine or seawater intake, followed by conversion steps such as calcination to MgO, hydration to Mg(OH)2, and brine-based routes producing MgCl2 intermediates that feed electrolysis or chemical synthesis. The chain remains China-centric for primary magnesium and many magnesia derivatives, with a large share produced via the Pidgeon process, while electrolysis routes are used in other producing regions. RHI Magnesita is an example of a participant with backward integration into magnesite mining and processing, which links raw-material availability and energy costs directly to downstream refractory-grade magnesia economics.
Midstream processing covers purification, milling or classification, and packaging to meet specifications across refractories, environmental reagents, fertilizers, and electronics. Higher-purity MgO requires tighter impurity control and more rigorous QA. Downstream, supply splits between bulk deliveries to refractories and industrial users and higher-margin specialty channels for electronics and pharma or nutraceutical grades. Recycling and secondary recovery also influence availability in some regions, and the United States relies materially on secondary magnesium recovered from scrap (reported at about 108,000 tons in 2025), creating a supplementary feed route alongside imports for metal-intensive applications.
Competitive Landscape
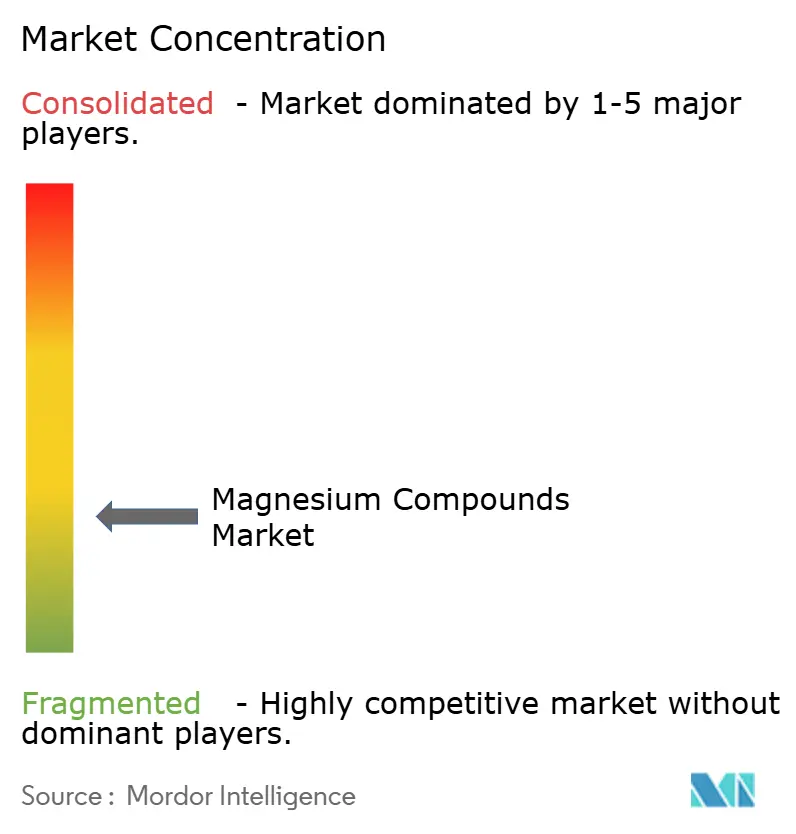
The magnesium compounds market is fragmented in nature. Low-carbon entrants are making significant strides. Verde Magnesium has secured funding for a sub-5 kg CO₂ electrolysis route in Romania. In California, Magrathea Metals is running a pilot project powered by coastal wind energy. Tateho Chemical and Ube Industries have established dominance in semiconductor-grade oxides, thanks to their ability to consistently meet impurity specifications of less than 10 ppm. Patents related to brine valorization and electrodialysis have increased. Chinese firms are at the forefront of bulk extraction methods, while Japanese entities are honing in on high-purity oxide synthesis. These developments suggest a magnesium compounds market that's split: commodity volumes are benefiting from scale, while specialty grades are leaning towards process innovation.
Magnesium Compounds Industry Leaders
-
RHI Magnesita
-
Magnezit Group
-
Grecian Magnesite
-
Martin Marietta Magnesia Specialties
-
Israel Chemicals Ltd. (ICL)
- *Disclaimer: Major Players sorted in no particular order
Market Opportunities and Future Outlook
Supply security and localized processing are clear whitespace themes following the loss of the only US primary producer in March 2024. This has reinforced buyer interest in non-China-linked supply and in secondary recovery where it is operationally feasible. In Europe, policy support is more explicit, since the EU Critical Raw Materials Act framework and the designation of Strategic Projects in March 2025 provide a pathway for faster permitting and priority treatment for raw-material and processing ventures. This aligns with initiatives such as Verde Magnesium positioning a low-carbon route intended to comply with EU carbon-related trade requirements. Together, these dynamics support opportunities for new capacity that integrates extraction, purification, and compounding closer to end users that want traceable, lower-carbon inputs.
Demand growth is concentrated in magnesium hydroxide and high-purity oxides where performance and compliance needs are tightening, especially in electrical and electronics and in environmental applications linked to wastewater and flue-gas controls. Brine valorization and seawater-based routes also create an opportunity set, converting desalination brine and industrial effluents into feedstocks for magnesium hydroxide and related derivatives that can reduce raw-material cost exposure and improve ESG positioning for downstream customers. Standardization and qualification further widen differentiation as the sector moves toward tighter material identification and technical standards for specialty grades serving electronics and regulated end uses.
Recent Industry Developments
- April 2026: Magnezit Group was named among the TOP-1000 successful suppliers of Russia, based on 2025 performance data. The designation points to supplier quality and resilience in regional supply chains, signaling improved contract opportunities and stronger regional positioning amid sanctions-driven supply concerns.
- April 2026: RHI Magnesita reported Q1 2026 trading update confirming FY 2026 adjusted EBITA guidance of approximately 400 million Euro after foreign exchange headwinds. The update reinforces the company’s earnings trajectory despite FX pressure and supports investors' view of its mid-term profitability stability.
- March 2026: Grecian Magnesite completed a customer visit across Rajasthan, India to expand footprint in the emery stone industry and promote magnesium oxide solutions. The visit adds to its regional presence and product diversification across Asia-Pacific markets.
Research Methodology Framework and Report Scope
Market Definition and Coverage
For this study, the magnesium compounds market is defined as the value of commercially sold magnesium-based chemical compounds used across industrial and specialty applications, captured at the point of sale to end users and channels in each covered geography.
Scope exclusions: We exclude magnesium metal and alloy ingots, as well as internal transfer pricing inside vertically integrated operations when it is not an arm's-length sale.
Segmentation Overview
- By Source
- Seawater
- Natural Brines
- Other Sources
- By Product Type
- Inorganic Chemicals
- Organic Chemicals
- By End-User Industry
- Agriculture
- Electrical and Electronics
- Automotive
- Aerospace
- Construction
- Refractory
- Other End-User Industries
- By Geography
- Asia-Pacific
- China
- India
- Japan
- South Korea
- ASEAN
- Oceania
- Rest of Asia-Pacific
- North America
- United States
- Canada
- Mexico
- Europe
- Germany
- United Kingdom
- France
- Italy
- Russia
- Rest of Europe
- South America
- Brazil
- Argentina
- Rest of South America
- Middle-East and Africa
- Saudi Arabia
- South Africa
- Rest of Middle-East and Africa
- Asia-Pacific
Data Sources, Market Sizing, and Validation
Desk Research
Desk research was used to set the market frame and build the first set of demand and supply anchors before we spoke to industry participants. Public sources such as USGS mineral commodity summaries, UN Comtrade trade statistics, the World Steel Association, FAO fertilizer and soil nutrient references, and national environmental agencies were reviewed to understand production context and end-use direction, including steel and refractory demand signals, agriculture inputs, and environmental compliance drivers.
We also used company filings, annual reports, and investor presentations to map product mixes and regional exposure, then cross-checked this with reputable press and association websites to confirm capacity changes and trade flow shifts. Where needed, paid subscriptions that cover company financials and intelligence, patent databases, and shipment-level import and export records were used to fill gaps in non-paywalled data and keep assumptions consistent across regions. The desk sources listed above are illustrative, and many other references were used for data collection, validation, and clarification during the analysis.
Primary Interviews and Surveys
Primary work was used to test what the secondary data could not answer cleanly, especially on grade mix, realized pricing ranges, and how demand shifts across end uses such as refractory, agriculture, and electrical and electronics. We spoke with producers, distributors, and downstream buyers across major producing and consuming regions so assumptions on utilization, substitution, and procurement cycles could be confirmed and adjusted. Inputs from these discussions were then used to triangulate the final market totals and the near-term outlook.
Distribution of primary research fieldwork respondents
| Company type | Respondent position | Region |
|---|---|---|
| Top tier: 39% | CXOs: 12% | APAC: 46% |
| Mid tier: 45% | Functional/Unit leaders: 33% | EMEA: 35% |
| Smaller Players: 16% | Managers: 55% | Americas: 19% |
Market-Sizing & Forecasting
Sizing starts from a top-down build that reconstructs the demand pool by linking end-use activity and trade and production signals to magnesium compound consumption, then converting this into value using region-appropriate price ranges. To keep totals realistic, we corroborate the outcome with selective bottom-up checks, such as supplier and channel roll-ups in key countries, sampled average selling price (ASP) times volume for common grades, and distributor feedback on shipment seasonality.
Key inputs used in the model include steel and refractory activity indicators, fertilizer and soil amendment application trends, construction output direction, electronics and flame-retardant additive adoption signals, and observed import and export movements for magnesium oxide and related compounds. Pricing is handled through a blended ASP approach that reflects grade purity, form factor (powder, slurry where relevant), and regional energy and logistics differences. Currency conversions are aligned to the same timing window to avoid artificial jumps.
Forecasting is done using scenario analysis supported by short-cycle indicators, such as steel production and industrial activity, and longer-cycle drivers, such as construction and electrification-related materials demand. Where bottom-up visibility is incomplete, gaps are handled through penetration-rate assumptions validated in interviews, then checked against historical trade and capacity direction to keep the forecast reproducible.
Data Validation & Update Cycle
Validation is done through several passes so unusual outputs get caught early. Model totals are compared with independent signals such as capacity announcements, trade balances, and end-use direction, and then large variances are traced back to a small set of levers like ASP, utilization, or mix shift before sign-off.
A second analyst review is used to challenge assumptions that can move the result, and follow-up calls are triggered when a datapoint looks inconsistent with on-ground buying or selling behavior. Reports are refreshed annually, with interim updates when material events occur that can change supply, pricing, or demand. Before delivery, a final pass is completed so clients receive the latest updated view based on newly available public data and recent interview feedback.
Mordor Intelligence's Magnesium Compounds Market Size Compared With Other Published Estimates
Published market sizes for magnesium compounds often do not match because the scope gets set differently and the value conversion step is handled in different ways. Differences usually come from whether only a few high-volume inorganic grades are counted, how end-use coverage is treated, and whether pricing is modeled as a single global average or adjusted by region and grade.
Some published figures fold in adjacent value pools such as magnesium metal, broader mineral-based refractories, or a wider set of magnesium derivatives that are not always sold into the same demand chain. In Mordor Intelligence, the total is limited to magnesium compounds sold as chemicals across defined end uses, with blended ASPs refreshed using current trade signals and interview-validated price bands to avoid overstating value in high-inflation regions.
Benchmark comparison
| Source | Market Size | Gaps in Research Methodology |
|---|---|---|
| Mordor Intelligence | USD 14.58 B (2026) | |
| Industry Database A | USD 48.72 B (2025) | Uses a broader magnesium derivatives frame that can include downstream formulations and adjacent magnesium materials, which inflates the addressable value versus compounds-only accounting. |
| Trade Publisher B | USD 0.28 B (2023) | Appears to track a narrow subset of specialty grades and selected applications, and the value base looks closer to a niche segment than to total compounds consumption across industries. |
The spread across published numbers is mainly explained by what is included in the product universe and how prices are generalized across grades and regions. By keeping the scope tied to chemical compounds and applying repeatable checks on volume signals and realized price ranges, the estimate stays traceable to clear inputs that can be reviewed and updated over time.
Key Questions Answered in the Report
How large is the magnesium compounds market in 2026?
The magnesium compounds market size is USD 14.58 billion in 2026 and is forecast to reach USD 18.72 billion by 2031, registering a CAGR of 5.13%.
Which segment is growing fastest within magnesium compounds?
Electrical and electronics end uses show the highest growth at a 6.31% CAGR, driven by flame-retardant and battery applications.
What share do natural brines hold in the global supply?
Natural brines contributed 44.38% of global production in 2025.
What regulatory trends affect magnesium hydroxide demand?
Tougher wastewater and flue-gas rules, such as the U.S. EPA mandate for 99.5% SO₂ capture, accelerate magnesium hydroxide adoption in environmental applications.