Market Overview
| Study Period | 2019 - 2030 |
|---|---|
| Market Size (2025) | USD 20.35 Billion |
| Market Size (2030) | USD 33.61 Billion |
| Growth Rate (2025 - 2030) | 10.56% CAGR |
| Fastest Growing Market | Middle East and Africa |
| Largest Market | Asia Pacific |
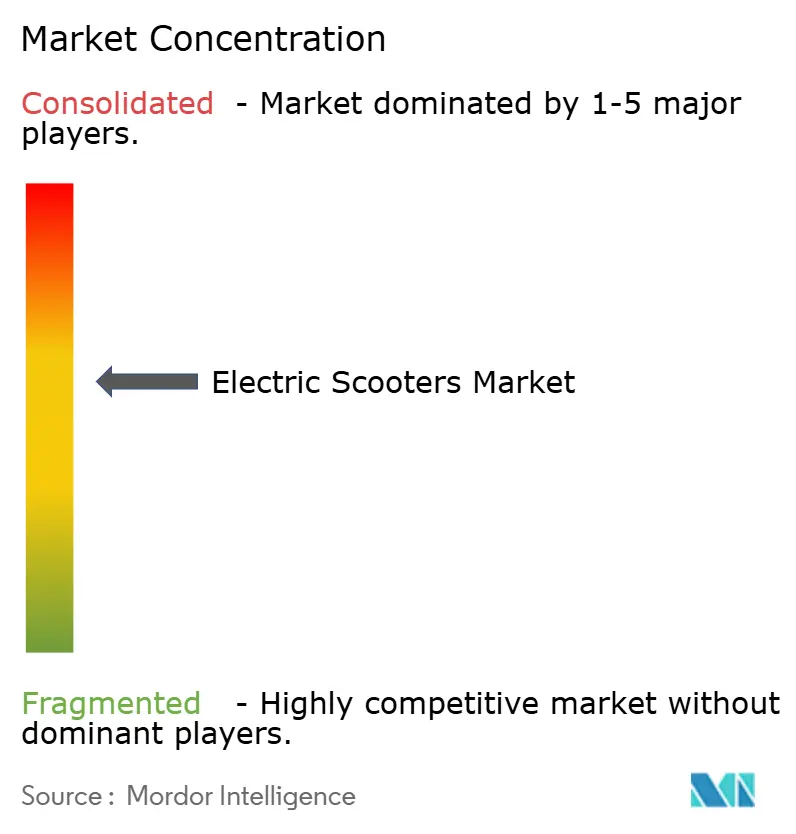
| Market Concentration | Medium |
Major Players *Disclaimer: Major Players sorted in no particular order Image © Mordor Intelligence. Reuse requires attribution under CC BY 4.0. | |

Electric Scooters Market Analysis by Mordor Intelligence
The electric scooters market size stands at USD 20.35 billion in 2025 and is projected to reach USD 33.61 billion by 2030, reflecting a 10.56% CAGR during the forecast period. Battery prices fell, bringing total ownership costs near parity with internal-combustion scooters and widening consumer demand. The Middle East and Africa region is the fastest-expanding geography, as the United Arab Emirates and Saudi Arabia invest in charging infrastructure. Lithium-ion technology holds a significant share, yet sodium-ion cells are gaining wide popularity, signaling a pivot to abundant raw materials. Commercial demand from delivery fleets is rising, powered by e-commerce growth and battery-swapping models that shrink vehicle downtime.
Key Report Takeaways
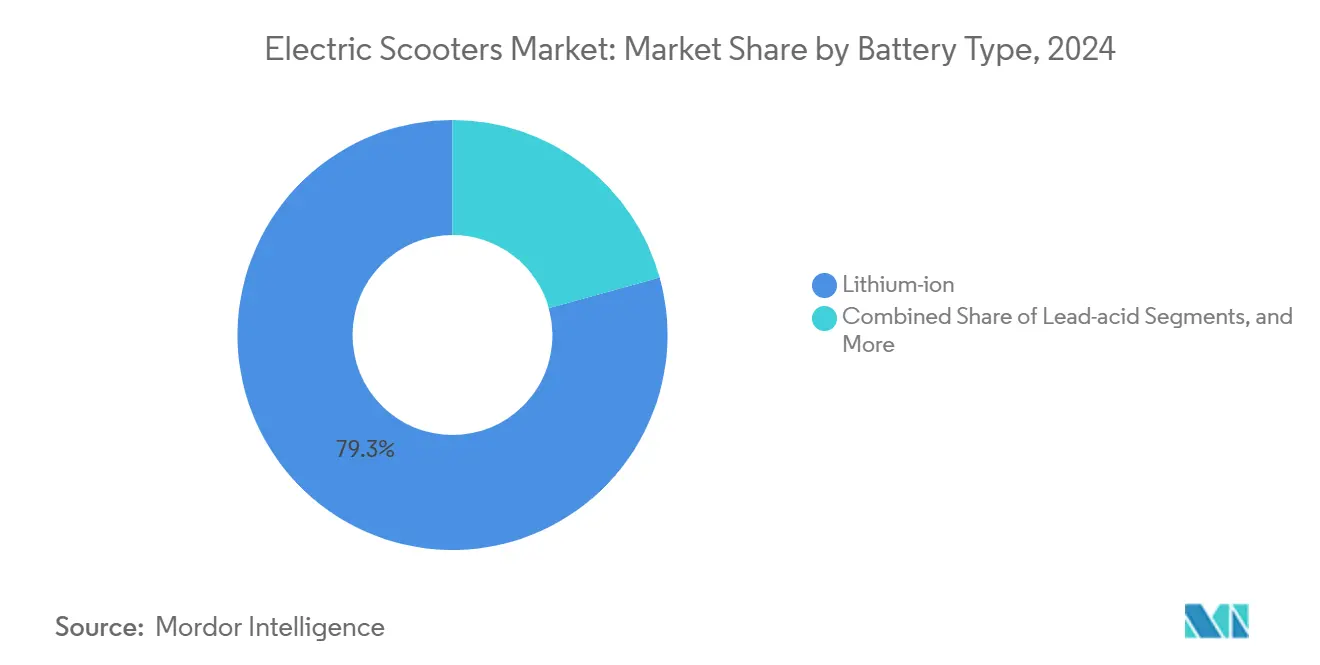
- By battery type, lithium-ion led with 79.33% share of the electric scooters market in 2024; sodium-ion is forecast to grow at a 14.25% CAGR through 2030.
- By power output, the 3.6-7.2 kW range held 39.45% share of the electric scooters market in 2024; models above 10 kW are advancing at an 11.66% CAGR through 2030.
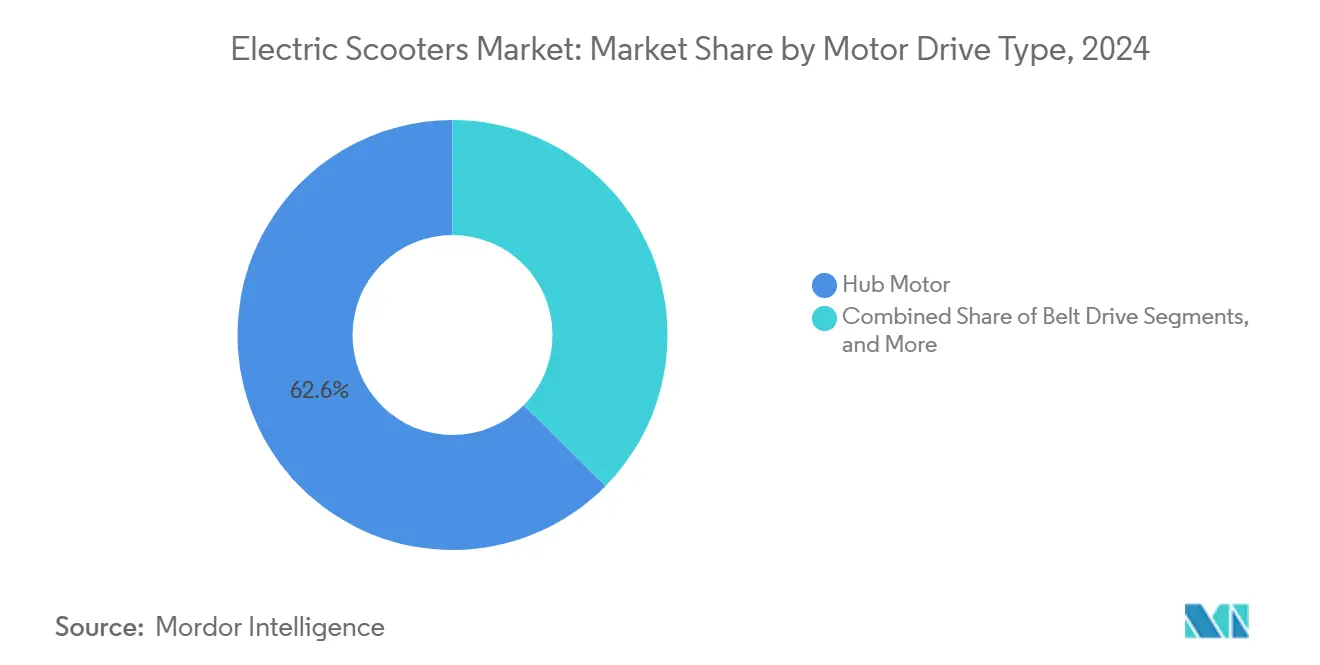
- By motor/drive type, hub motors captured 62.55% share of the electric scooters market in 2024; mid-drive systems are expected to expand at a 12.05% CAGR through 2030.
- By end-use, personal mobility accounted for a 66.74% share of the electric scooters market in 2024; delivery and logistics fleets are projected to post a 12.71% CAGR through 2030.
- By geography, Asia-Pacific dominated the electric scooter market, with a 75.14% share in 2024; the Middle East and Africa are projected to climb at an 11.36% CAGR through 2030.
Global Electric Scooters Market Trends and Insights
Drivers Impact Analysis*
| Driver | (~) % Impact on CAGR Forecast | Geographic Relevance | Impact Timeline |
|---|---|---|---|
| Growing Urban Congestion Demand | +2.3% | Asia-Pacific core, spill-over to Europe, North America | Long term (≥4 years) |
| Government Incentives And Subsidies | +2.1% | India, Europe, United States | Medium term (2-4 years) |
| E-Commerce Delivery Fleet Expansion | +1.9% | India, China, United States | Medium term (2-4 years) |
| Declining Battery Prices | +1.8% | Global | Short term (≤2 years) |
| Battery-As-A-Service And Swaps | +1.2% | Asia-Pacific core, pilots in Europe | Long term (≥4 years) |
| IoT-Enabled Predictive Maintenance | +0.8% | Developed markets | Medium term (2-4 years) |
| Source: Mordor Intelligence | |||
Growing Urban Congestion and Last-Mile Mobility Demand
Commuters often find themselves ensnared in major metropolitan areas in lengthy traffic jams, leading to significant time loss and frustration. Electric scooters, however, offer an efficient alternative by deftly navigating through congested streets, reducing parking duration, and seamlessly connecting with public transport systems. These benefits make electric scooters an increasingly popular choice for urban mobility. Recognizing this trend, city administrations are implementing measures to support their adoption. For instance, Paris has designated 2,500 parking bays exclusively for scooters, a strategic move aimed at reducing urban clutter, improving safety, and promoting organized usage. Such initiatives highlight the growing role of electric scooter in addressing urban transportation challenges.
Government Incentives and Subsidy Programs
Financial support is accelerating adoption. India’s Electric Mobility Promotion Scheme 2024 set aside INR 10,900 crore (USD 1.3 billion) for electric two-wheelers, reducing retail prices and improving financing access [1]Ministry of Heavy Industries, “Electric Mobility Promotion Scheme 2024,” heavyindustries.gov.in. In the United Kingdom, mandates on number plates and helmets establish compliance rules, effectively reducing operational risks for fleet operators. These regulations ensure safety and standardization and foster a predictable demand, enabling manufacturers to optimize their production capacity. Additionally, the consistency in demand allows manufacturers to negotiate more favorable supply contracts, ensuring cost efficiency and streamlined operations. Such policies contribute to a stable and well-regulated market environment, benefiting manufacturers and fleet operators.
Rapid Expansion of E-commerce Delivery Fleets
Amazon partnered with Mahindra Electric to deploy electric delivery vehicles across India. This initiative supports Amazon's broader sustainability objectives, including achieving net-zero carbon emissions. When considering fuel, maintenance, and licensing costs, Amazon emphasizes the cost advantages of electric vehicles over petrol motorcycles. Additionally, Gogoro's advanced battery-swapping infrastructure is instrumental in maintaining high fleet availability and reducing delivery disruptions. Furthermore, software-driven route optimization improves vehicle efficiency, enabling more streamlined delivery routes and minimizing operational inefficiencies.
Declining Lithium-ion Battery Prices
Cell costs dropped in 2024, reaching USD 115 per kWh, and LFP chemistries now dominate cost-focused models. Cost parity with petrol scooters has emerged in China, India, and parts of Europe, hastening the switch to electric scooter market options. Sodium-ion cells entered mass production at 160-180 Wh/kg energy density, promising further savings for weight-tolerant fleet vehicles. Lower battery prices let brands offer extended-range versions without raising sticker prices, broadening the addressable customer base.
Restraints Impact Analysis*
| Restraint | (~) % Impact on CAGR Forecast | Geographic Relevance | Impact Timeline |
|---|---|---|---|
| Limited Public Charging Infrastructure | -1.4% | Global, acute in emerging markets | Medium term (2-4 years) |
| High Upfront Cost Versus Petrol | -1.1% | Price-sensitive markets, rural areas | Short term (≤2 years) |
| Safety Recalls And Battery Fires | -0.9% | Global, variable regulatory response | Short term (≤2 years) |
| Critical Mineral Supply Constraints | -0.7% | Global supply chains | Long term (≥4 years) |
| Source: Mordor Intelligence | |||
Limited Public Charging / Swapping Infrastructure
Many cities face a shortage of designated charging points, making it difficult for users without private parking access. This scarcity forces reliance on public infrastructure, which often can't keep pace with the rising demand for electric vehicles (EVs) charging. While battery swap networks of fer a potential solution, they have high establishment and maintenance costs. Moreover, the lack of brand interoperability limits riders to a single brand's ecosystem, curtailing their flexibility and convenience. This predicament heightens range anxiety, deterring potential buyers from embracing EVs. As a result, this reluctance hampers the expansion of EV fleets, especially in crowded urban centers where housing and parking challenges are already pronounced.
High Upfront Acquisition Cost vs. ICE Alternatives
Retail prices for electric scooters still run higher than comparable petrol models because the battery remains the single most expensive component even after pack costs drops. Many price-sensitive buyers in India, Southeast Asia, and SouthAmerica rely on informal credit, making the larger initial outlay a deterrent despite lower running expenses. Government rebates such as India’s Electric Mobility Promotion Scheme 2024, which can inventize off on domestically manufactured two-wheelers, partially bridge the gap but do not eliminate it for entry-level consumers. Finance companies have begun offering battery-lease or pay-as-you-ride plans, yet these products are limited to urban centers and often carry higher interest rates than standard motorcycle loans. Total cost-of-ownership parity typically arrives after 18-24 months of use, a horizon that many riders find too long given household cash-flow constraints.
*Our forecasts treat driver/restraint impacts as directional, not additive. The impact forecasts reflect baseline growth, mix effects, and variable interactions.
Segment Analysis
By Battery Type: Lithium-Ion Dominance Faces Sodium-Ion Disruption
Lithium-ion technology controlled 79.33% of the electric scooters market in 2024, backed by energy density peaks of 300 Wh/kg and steady cost declines. Lead-acid packs persist in price-led models, but shrinking premiums for lithium-ion erode their appeal. Sodium-ion cells are projected to expand at a 14.25% CAGR by 2030, driven by cheaper kilowatt-hour pricing and improved thermal stability. Manufacturers such as CATL and BYD integrated sodium-ion into fleet-targeted models, broadening raw-material options and cushioning lithium supply swings [2]Contemporary Amperex Technology Limited, “Sodium-Ion Cell Launch,” catl.com.
Energy-dense lithium-polymer cells support premium scooters where slim form factors matter, while LFP variants gain share for cost-sensitive fleets needing long cycle life. As sodium-ion capacity scales, its share of the electric scooter market size could outpace earlier projections without major design overhauls. Safety records and operating-temperature breadth make sodium-ion attractive for tropical regions, positioning it to capture municipal fleet tenders from 2026.


By Power Output: Mid-Range Dominance with High-Power Growth
Scooters rated 3.6-7.2 kW held 39.45% share of the electric scooters market in 2024, balancing 45-60 km/h top speeds with lenient licensing thresholds in many countries. Owners favor the segment for daily commutes, while fleet buyers appreciate simplified operator requirements. The electric scooters market size for models above 10 kW is smaller, but is forecast to expand at 11.66% CAGR as riders demand expressway-capable machines.
Premium entries like BMW’s CE 04 deliver 31 kW and 130 km range, validating appetite for higher-output mobility. Regulatory updates in the EU’s L3e category cap power at 15 kW, offering room for performance growth within scooter norms. Rising adoption in peri-urban zones where longer journeys are common will continue to pull demand toward the upper-power bracket.
By Motor /Drive Type: Hub Motors Lead Despite Mid-Drive Innovation
Hub motors accounted for 62.55% of the electric scooter market in 2024, prized for simple assembly, low maintenance, and regenerative braking efficiency. Direct drive removes chain or belt wear, essential for shared fleets exposed to daily abuse. Mid-drive systems, while costlier, are set to grow 12.05% CAGR thanks to superior torque management and load-carrying capacity.
Delivery fleets navigating steep gradients prefer mid-drive for gear-assisted power. Belt-drive variants gain attention in premium consumer lines where cabin-noise equivalence is a marketing point. Chain drives stay relevant for rugged rural duty cycles, although adoption remains niche. Over time, motor-type choice will align more closely with duty-cycle specifics than with universal cost trends.
By End-Use: Personal Dominance with Commercial Acceleration
Personal/Individual ownership holds a 66.74% share of the electric scooters market in 2024 unit sales, with affordability gains and environmental awareness persuading commuters. App-based rentals have widened access where upfront budgets remain tight. Delivery and logistics fleets, however, show the steepest curve at 12.71% CAGR through 2030, underpinned by e-commerce. Operators report lower per-parcel cost after adopting electric scooters market solutions for last-mile runs.
Corporate campuses and security services are piloting scooters for on-site mobility, citing lower noise and zero tailpipe emissions. Battery subscription models further increase commercial appeal by reducing capital outlays and stabilizing operating costs. Personal buyers, meanwhile, gravitate toward connectivity and anti-theft features, nudging OEMs to embed IoT stacks as standard.
Geography Analysis
Asia-Pacific held a 75.14% share of the electric scooter market in 2024 as China leveraged its battery supply chain and India recorded significant sales under pro-EV incentives. Ola Electric is aided by domestic sourcing and aggressive retail financing. Southeast Asian nations such as Indonesia and Vietnam are rolling out tax cuts and assembling plants, lifting regional demand.
Europe remains a steady growth engine. In 2024, Europe clarified insurance coverage, smoothing fleet operations. Germany revised licensing standards to streamline category definitions. Italy’s Highway Code update introduced plate and helmet rules that enhance safety compliance while supporting commercial insurance underwriting. Mature charging networks and low-emission zones fortify consumer confidence.
North America shows incremental gains as states harmonize rules. California’s rebate inclusion slashed ownership costs and spurred dealer inventories. The Middle East and Africa, forecast to post an 11.36% CAGR through 2030, benefits from Dubai’s Green Mobility Strategy and Riyadh’s pilot corridors that install curbside swap cabinets. Infrastructure gaps persist but rapid urban development offers a blank slate for purpose-built charging clusters.


Competitive Landscape
The electric scooter market exhibits moderate fragmentation. Chinese brands Yadea and NIU scale globally, while regional champions like Ola Electric dominate their home turf. Traditional automakers, including BMW and Honda, entered through dedicated e-two-wheeler subsidiaries or partnerships, seeking technology cross-pollination.
Competitive edges are tilting toward ecosystem control. Gogoro’s energy-as-a-service network turned battery access into a subscription proposition, locking in riders and generating recurring revenue [3]Gogoro Investor Relations, “Swap Station Network Metrics 2025,” gogoro.com. Ola Electric invested in cell manufacturing and OS-level software to safeguard supply and user data.
Mergers and OEM-supplier tie-ups aim to secure minerals and firmware talent. Strategic stakes in battery-tech startups accelerate chemistry diversification. Compliance costs from new safety norms are thinning low-margin importers, magnifying the share of players with certified quality systems.
Electric Scooters Industry Leaders
Yadea Technology Group
NIU Technologies
Gogoro Inc.
Ather Energy Limited
Hero Electric Vehicles Private Limited
- *Disclaimer: Major Players sorted in no particular order

Recent Industry Developments
- August 2025: TVS unveiled its third electric scooter, the Orbiter, bolstering its EV lineup in India. The company touts an impressive riding range of 158 km on a single charge. Currently, the Orbiter is offered exclusively with a 3.1 kWh battery pack.
- July 2025: Kinetic DX launched a new electric scooter in India with an ex-showroom price of INR 111,000 (USD 1,336). The scooter features an updated design and an enhanced connectivity suite.
- February 2025: Simple Energy enhanced its Simple ONE scooter, significantly increasing its range to 248 Km, making it a competitive option in the electric scooter market. The updated Gen 1.5 version introduces advanced software features designed to improve the user experience. These features include app integration for seamless connectivity, navigation to assist riders with route planning, and customizable dashboard themes, allowing users to personalize their riding interface. These updates position the Simple ONE as a technologically advanced and user-friendly electric scooter.


Global Electric Scooters Market Report Scope
By Battery Type
| Lead-acid |
| Lithium-ion |
| Lithium-ion Polymer |
| Sodium-ion and Emerging Chemistries |
By Power Output
| Less than 3.6 kW |
| 3.6-7.2 kW |
| 7.2-10 kW |
| More than 10 kW |
By Motor / Drive Type
| Hub Motor |
| Belt Drive |
| Chain Drive |
| Mid-drive Motor |
By End-Use
| Personal / Individual |
| Commercial and Corporate Fleets |
| Micromobility Service Providers |
| Delivery and Logistics |
By Geography
| North America | United States |
| Canada | |
| Rest of North America | |
| South America | Brazil |
| Argentina | |
| Rest of South America | |
| Europe | United Kingdom |
| Germany | |
| Spain | |
| Italy | |
| France | |
| Russia | |
| Rest of Europe | |
| Asia-Pacific | India |
| China | |
| Japan | |
| South Korea | |
| Rest of Asia-Pacific | |
| Middle East and Africa | United Arab Emirates |
| Saudi Arabia | |
| Turkey | |
| Egypt | |
| South Africa | |
| Rest of Middle-East and Africa |
| By Battery Type | Lead-acid | |
| Lithium-ion | ||
| Lithium-ion Polymer | ||
| Sodium-ion and Emerging Chemistries | ||
| By Power Output | Less than 3.6 kW | |
| 3.6-7.2 kW | ||
| 7.2-10 kW | ||
| More than 10 kW | ||
| By Motor / Drive Type | Hub Motor | |
| Belt Drive | ||
| Chain Drive | ||
| Mid-drive Motor | ||
| By End-Use | Personal / Individual | |
| Commercial and Corporate Fleets | ||
| Micromobility Service Providers | ||
| Delivery and Logistics | ||
| By Geography | North America | United States |
| Canada | ||
| Rest of North America | ||
| South America | Brazil | |
| Argentina | ||
| Rest of South America | ||
| Europe | United Kingdom | |
| Germany | ||
| Spain | ||
| Italy | ||
| France | ||
| Russia | ||
| Rest of Europe | ||
| Asia-Pacific | India | |
| China | ||
| Japan | ||
| South Korea | ||
| Rest of Asia-Pacific | ||
| Middle East and Africa | United Arab Emirates | |
| Saudi Arabia | ||
| Turkey | ||
| Egypt | ||
| South Africa | ||
| Rest of Middle-East and Africa | ||


Key Questions Answered in the Report
What is the current size of the electric scooters market?
The market stands at USD 20.35 billion in 2025 and is projected to hit USD 33.61 billion by 2030.
Which region leads global electric scooter sales?
Asia-Pacific holds 75.14% of 2024 unit sales, buoyed by China’s manufacturing base and India’s rapid adoption.
How fast are lithium-ion battery prices falling?
Average pack costs dropped 20% year-over-year to USD 115 per kWh in 2024, accelerating affordability.
Which application segment is growing the fastest?
Delivery and logistics fleets are expanding at a 12.71% CAGR through 2030 due to e-commerce growth.
Page last updated on:


