Market Overview
| Study Period | 2020 - 2031 |
|---|---|
| Forecast Data Period | 2026 - 2031 |
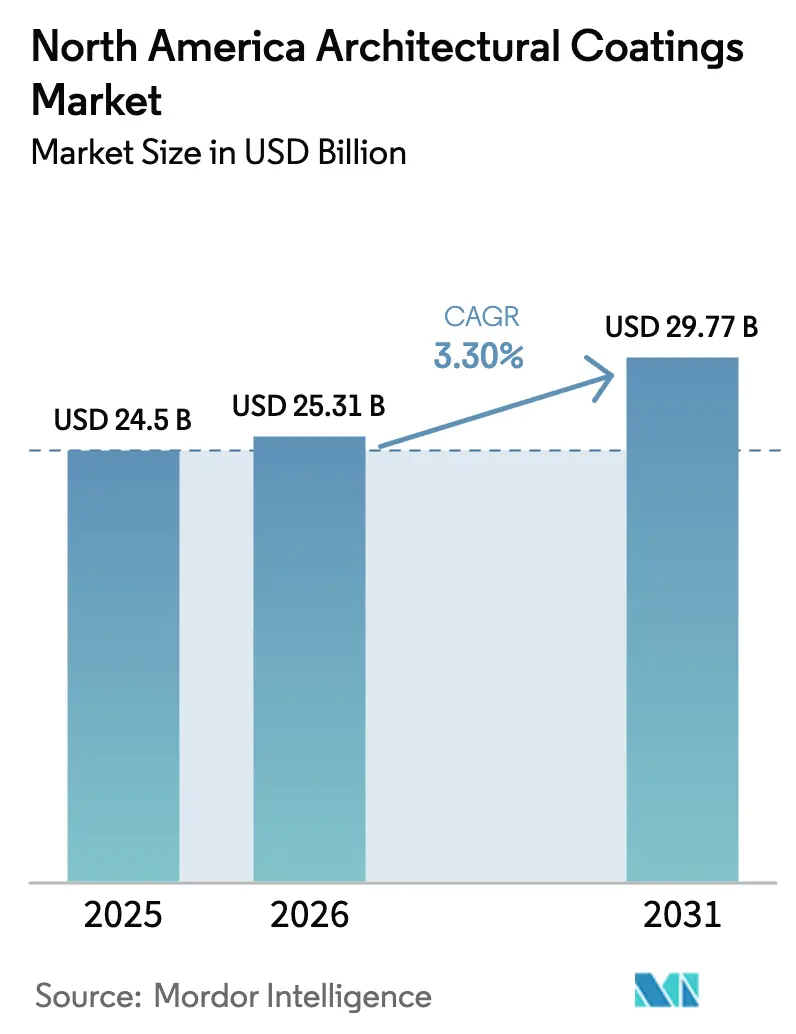
| Base Year Market Size (2025) | USD 24.5 Billion |
| Market Size (2026) | USD 25.31 Billion |
| Market Size (2031) | USD 29.77 Billion |
| Growth Rate (2026 - 2031) | 3.30% CAGR |
| Market Concentration | Medium |
Major Players *Disclaimer: Major Players sorted in no particular order Image © Mordor Intelligence. Reuse requires attribution under CC BY 4.0. | |
North America Architectural Coatings Market Analysis by Mordor Intelligence
The North America Architectural Coatings Market size market is expected to grow from USD 24.5 billion in 2025 to USD 25.31 billion in 2026 and is forecast to reach USD 29.77 billion by 2031 at 3.30% CAGR over 2026-2031. Ongoing residential renovation, stringent low-VOC regulations, and shifts in construction spending due to geographic changes continue to shape demand, with waterborne technologies steadily replacing solventborne alternatives. Acrylic resins outpace other chemistries as they align with regulatory mandates and achieve broad formulation versatility. The United States retains market leadership, yet Mexico is the fastest-growing geography, supported by near-shoring-driven industrial build-outs. Competitive intensity is rising as incumbents invest in plant expansions and digital customer engagement tools, while raw material price swings and persistent labor shortages cap near-term growth momentum.
Key Report Takeaways
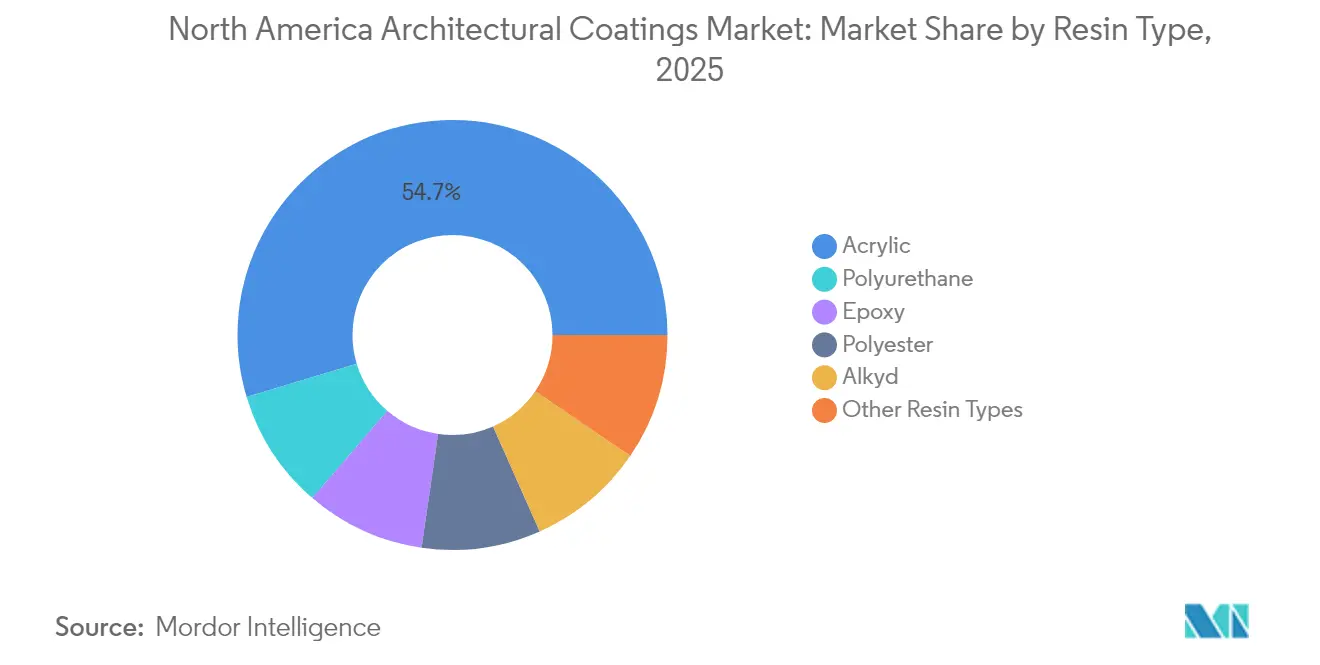
- By resin type, acrylic captured 54.65% of the North America architectural coatings market share in 2025 and is advancing at a 3.82% CAGR through 2031.
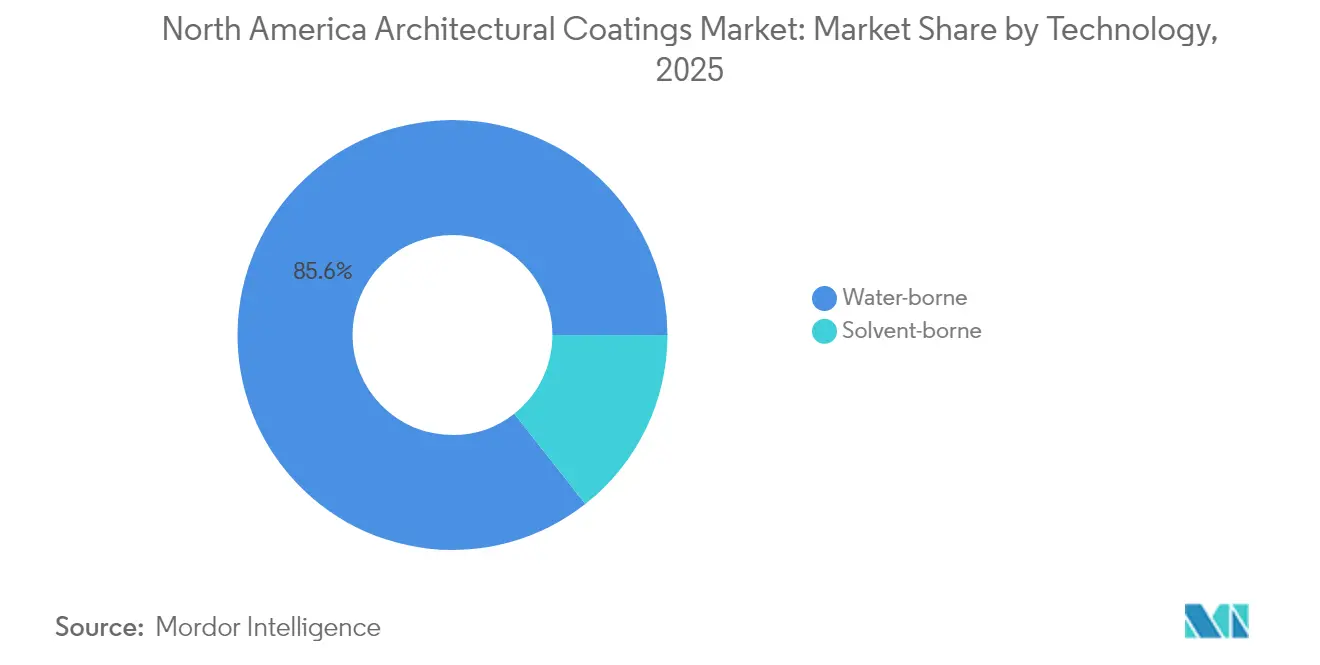
- By technology, water-borne systems accounted for 85.60% of the North America architectural coatings market size in 2025 and are advancing at a 3.49% CAGR through 2031.
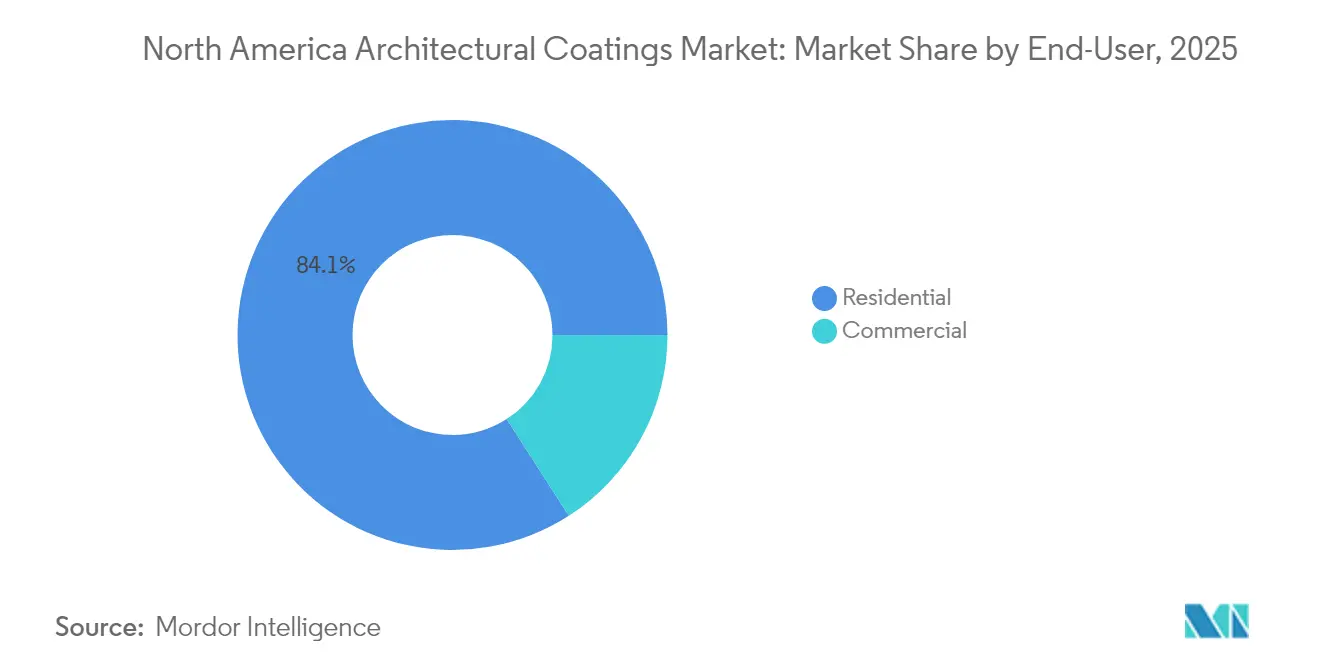
- By end-user, the residential segment held 84.10% of the North America architectural coatings market share in 2025, and is projected to expand at a 3.37% CAGR to 2031.
- By geography, the United States contributed 80.75% of the North America architectural coatings market size in 2025; Mexico records the highest projected CAGR at 3.63% through 2031.
Note: Market size and forecast figures in this report are generated using Mordor Intelligence’s proprietary estimation framework, updated with the latest available data and insights as of 2026.
North America Architectural Coatings Market Trends and Insights
Drivers Impact Analysis*
| Drivers | (~) % Impact on CAGR Forecast | Geographic Relevance | Impact Timeline |
|---|---|---|---|
| Surge in residential renovation and repaint activity | +0.8% | North America, strongest in US suburban markets | Medium term (2-4 years) |
| Regulatory push toward low-VOC/water-borne formulations | +0.6% | US and Canada, with California leading adoption | Long term (≥ 4 years) |
| Commercial construction boom in U.S. Sun-Belt metros | +0.4% | Texas, Florida, Arizona, Nevada | Medium term (2-4 years) |
| Demand for durable UV- and weather-resistant exterior systems | +0.3% | Global, with emphasis on coastal and high-UV regions | Long term (≥ 4 years) |
| Digital color-visualization tools driving premium upgrades | +0.2% | North America, concentrated in urban markets | Short term (≤ 2 years) |
| Source: Mordor Intelligence | |||


Surge in Residential Renovation and Repaint Activity
Harvard’s Joint Center for Housing Studies forecasts 2025 U.S. home-improvement expenditures at USD 509 billion, a 1.2% year-over-year increase that anchors baseline demand despite a moderating post-pandemic surge[1]Joint Center for Housing Studies, “Spending on Home Improvements and Repairs Expected to Reach $509 Billion in 2025,” Harvard University, jchs.harvard.edu. Elevated renovation frequency favors repaint projects, which sustain steady volumes even when new construction slows. Aging housing stock, averaging repaint cycles of seven to ten years, underpins recurring sales. Robust suburban migration trends add repaint opportunities as newly purchased homes undergo aesthetic upgrades. Leading brands are leveraging loyalty programs and same-day delivery to capture wallet share as project backlogs persist in key metropolitan areas. Contractors report that color-matching devices expedite project approvals, supporting the adoption of premium coatings.
Regulatory Push Toward Low-VOC/Water-Borne Formulations
The Environmental Protection Agency finalized stricter National Emission Standards for Hazardous Air Pollutants for aerosol coatings in December 2024, marking a multi-year shift toward waterborne systems[2]Environmental Protection Agency, “National Emission Standards for Hazardous Air Pollutants: Aerosol Coatings,” epa.gov. California’s Air Resources Board maintains the nation’s most stringent VOC limits, effectively creating a North American de facto standard. Compliance costs rise for smaller firms, encouraging consolidation as larger players leverage their research and development scale to reformulate more quickly. Water-borne technology, already holding 86.12% share, gains further traction due to improved durability and odor reduction, while marketing teams capitalize on sustainability credentials to differentiate brands at retail.
Commercial Construction Boom in U.S. Sun-Belt Metros
U.S. Census Bureau spending data confirms construction outperformance in Texas, Florida, and Arizona, fueled by population inflows and data-center development. Semiconductor and electric-vehicle projects compound demand for specialized high-performance architectural coatings designed for clean-room and thermal-management environments. Although the American Institute of Architects projects broadly flat non-residential outlays through 2026, Sun-Belt metros buck the trend, providing regional tailwinds. Coating suppliers cluster new warehousing hubs near these corridors to shorten lead times and secure specification listings on mega-projects.
Demand for Durable UV- and Weather-Resistant Exterior Systems
Extreme weather events spur architects to specify coatings with superior UV stability, salt spray tolerance, and water vapor permeability. Acrylic chemistries meet these requirements at competitive cost, reinforcing their 55.01% share leadership. Product managers highlight resin advances that extend repaint cycles, allowing contractors to offer longer-term warranties. Public-sector bids increasingly incorporate resilience scoring, which favors premium formulations. Manufacturers bundle exterior products with complementary sealants to upsell full envelope protection.
Restraints Impact Analysis*
| Restraints | (~) % Impact on CAGR Forecast | Geographic Relevance | Impact Timeline |
|---|---|---|---|
| Raw-material (petrochemical) price volatility | -0.5% | Global, with North America import-dependent regions most affected | Short term (≤ 2 years) |
| VOC-compliance cost pressure on smaller manufacturers | -0.3% | US and Canada, particularly acute in California and northeastern states | Medium term (2-4 years) |
| Skilled-painter labor shortages extending project lead-times | -0.4% | North America, acute in high-growth Sun-Belt metros | Medium term (2-4 years) |
| Source: Mordor Intelligence | |||
Raw-Material Price Volatility
International Monetary Fund commodity data indicate annual fluctuations in copper and aluminum prices during 2024, which may undermine cost forecasts for architectural coating inputs. Titanium dioxide, a key ingredient for opacity, remains vulnerable to global supply consolidation, prompting manufacturers to hedge their procurement or adjust formulation ratios. Price spikes result in frequent list-price increases of 3–7%, which raises project budgets and stalls discretionary repaint jobs. Contract clauses requiring index-based adjustments gain prevalence, transferring part of the risk to end-users.
Skilled-Painter Labor Shortages Extending Project Lead-Times
The National Association of Home Builders calculates that the construction sector needs 723,000 new workers each year to match demand, yet vocational enrollment remains well below replacement levels. Aging demographics and low apprenticeship uptake leave painting contractors competing for a shrinking talent pool, particularly in high-growth Sun-Belt states. Extended lead times elevate labor rates and narrow contractor bid windows. Some manufacturers respond with training grants and mobile academies to enlarge the applicator base, but near-term relief appears limited.
*Our forecasts treat driver/restraint impacts as directional, not additive. The impact forecasts reflect baseline growth, mix effects, and variable interactions.
Segment Analysis
By Resin Type: Acrylic Dominance Driven by Regulatory Alignment
Acrylic systems accounted for a 54.65% share of the North American architectural coatings market in 2025, with a 3.82% CAGR forecast through 2031. This scale advantage aligns with low-VOC mandates and superior UV resistance, enabling acrylic to replace alkyds in both interior and exterior applications. Polyurethane remains a niche choice for abrasion-prone commercial floors, while epoxy and polyester cater to high-chemical-resistance zones such as hospital aseptic suites. Lubrizol’s USD 20 million investment in acrylic emulsion capacity underscores its confidence in growth. Alkyd adoption retreats as water-borne acrylics achieve drying-time parity without odor penalties.
Acrylic’s formulation versatility supports a range of finishes, from matte to high-gloss, and its compatibility with zero-VOC colorants simplifies compliance across various jurisdictions. Supply-chain resilience improves as resin suppliers localize production, reducing import exposure. Marketing campaigns stress durability and washability, nudging consumers toward premium lines. Collectively, these dynamics secure acrylic’s leadership in the North America architectural coatings market.


By Technology: Water-Borne Systems Capture Regulatory Advantage
Water-borne technology represented 85.60% of total sales in 2025 and leads growth with a 3.49% CAGR. The North America architectural coatings market share for water-borne platforms exceeds that of any other global region, reflecting decades of incremental formulation improvements. Recent EPA aerosol standards and CARB ceilings reinforce momentum toward near-zero VOC products. Solvent-borne lines now primarily cater to niche exterior metalwork and extreme climate exposures.
Enhanced rheology modifiers, quick-return-to-service features, and advanced open-time additives narrow the performance gap that once favored solvent products. Major retailers allocate more shelf space to eco-labels, while professional contractors cite reduced odor as a key reason to switch. Manufacturing footprints adjust as lines convert to water-borne processing and waste-water treatment systems scale up. These developments entrench water-borne dominance within the North America architectural coatings market.
By End-User: Residential Segment Anchors Market Stability
The residential channel generated 84.10% of the 2025 sales and lead growth, with a 3.37% CAGR, reflecting the repaint-driven stability that offsets cyclical softness in new builds. Harvard research links continued spending vigor to routine maintenance rather than large-scale remodels, stabilizing the number of gallons moved. Digital visualization suites such as ColorReader encourage DIY upgrades, boosting premium-finish pull-through.
Commercial volumes, though smaller, command higher average selling prices due to specialized specifications for healthcare, education, and hospitality. Contractors in this space prioritize low-odor, quick-cure products to minimize facility downtime. As a result, the commercial segment of the North American architectural coatings market is projected to contribute a significant value relative to volume.
Geography Analysis
The United States accounted for 80.75% of 2025 revenue, driven by the world’s most mature coatings distribution network. AIA consensus points to subdued non-residential growth through 2026; yet, population inflows to the Sun Belt sustain regional buoyancy. California’s VOC framework catalyzes nationwide product evolution, ensuring that water-borne form factors dominate new launches. Digital commerce penetration accelerates as dealers offer next-day delivery for top stock-keeping units.
Canada’s construction spend is approaching a new cycle driven by transit and utility megaprojects, with BuildForce Canada forecasting gains in trades employment through 2033. Residential repaint remains resilient as mortgage-rate normalization nudges homeowners toward maintenance rather than moves. Painter shortages, however, mirror U.S. pressures, tightening completion schedules.
Mexico advances with a 3.63% CAGR, lifted by near-shoring electronics and automotive assembly campuses clustering in the northern corridor. Imported resin dependence poses currency-driven cost risk, yet accelerated capacity expansion by multinationals suggests confidence in demand fundamentals. Public-sector spending moderation tempers short-run volumes but is offset by private industrial starts. Consequently, Mexico emerges as the pivotal growth lever inside the North America architectural coatings market.
Competitive Landscape
The North America architectural coatings market is moderately consolidated. Digital customer-engagement platforms serve as a new battleground. Benjamin Moore leverages its Color Portfolio ecosystem to deepen customer loyalty, while Sherwin-Williams adds artificial intelligence-enhanced color recommendations to its app suite. Such tools accelerate project quoting and embed brand preference early in the selection process. Sustainability-oriented entrants attempt to carve out white spaces through bio-based resins and direct-to-consumer subscriptions, but scale distributors retain lead time and service superiority. Smaller manufacturers struggle with rising compliance costs as VOC thresholds tighten, making tuck-in acquisitions an attractive exit strategy. Overall, the market structure therefore tilts toward incumbents that combine supply-chain heft, research and development agility, and omnichannel reach.
North America Architectural Coatings Industry Leaders
The Sherwin-Williams Company
PPG Industries, Inc.
RPM International Inc.
Masco Corporation
Benjamin Moore & Co.
- *Disclaimer: Major Players sorted in no particular order


Recent Industry Developments
- September 2025: Akzo Nobel N.V., Arkema, and BASF jointly reduced the carbon footprint of Interpon D super-durable architectural powder coatings by up to 40%, aided by bio-attributed raw materials.
- December 2024: PPG Industries, Inc. divested its U.S. and Canada architectural coatings businesses to American Industrial Partners for USD 550 million, repositioning its portfolio toward higher-margin segments.


North America Architectural Coatings Market Report Scope
Architectural coatings include paints applied on office buildings, warehouses, retail convenience stores, shopping malls, and residential buildings, wood products, which are used in furniture and fixtures, doors and windows, decks and cabinets, and other products.
The North American architectural coatings market is segmented by end-user industry, technology, resin, and geography. By end-user industry, the market is segmented into commercial and residential. By technology, the market is segmented into solvent-borne and water-borne). By resin, the market is segmented into acrylic, alkyd, polyurethane, epoxy, polyester, and other resin types). The report also covers the market size and forecasts for the architectural coatings market across major countries in the region. For each segment, the market sizing and forecasts have been done based on revenue (USD) and volume (kilotons).
By Resin Type
| Acrylic |
| Alkyd |
| Polyurethane |
| Epoxy |
| Polyester |
| Other Resin Types |
By Technology
| Water-borne |
| Solvent-borne |
By End-User
| Residential |
| Commercial |
By Geography
| United States |
| Canada |
| Mexico |
| By Resin Type | Acrylic |
| Alkyd | |
| Polyurethane | |
| Epoxy | |
| Polyester | |
| Other Resin Types | |
| By Technology | Water-borne |
| Solvent-borne | |
| By End-User | Residential |
| Commercial | |
| By Geography | United States |
| Canada | |
| Mexico |


Market Definition
- COMMERCIAL - The Commercial Sector includes the paints and coatings used for hotels, hospitals, educational institutions, government institutions and malls among others. The scope does not include paints and coatings used for infrastructure applications.
- RESIDENTIAL - This section includes interior and exterior paints and coatings used on residential buildings.
- FLOOR AREA - The total floor area comprises of both existing and new floor area for the sub end users considered in the study.


Research Methodology
Mordor Intelligence follows a four-step methodology in all our reports.
- Step-1: Identify Key Variables: The quantifiable key variables (industry and extraneous) pertaining to the specific end-user segment and country are selected from a group of relevant variables & factors based on the desk research & literature review; along with primary expert inputs.
- Step-2: Build a Market Model: In order to build a robust forecasting methodology, the variables and factors identified in Step-1 are tested against available historical market numbers. Through an iterative process, the variables required for market forecast are set and the model is built based on these variables.
- Step-3: Validate and Finalize: In this important step, all market numbers, variables and analyst calls are validated through an extensive network of primary research experts from the market studied. The respondents are selected across levels and functions to generate a holistic picture of the market studied.
- Step-4: Research Outputs: Syndicated Reports, Custom Consulting Assignments, Databases & Subscription Platforms


