Market Overview
| Study Period | 2020 - 2031 |
|---|---|
| Forecast Data Period | 2026 - 2031 |
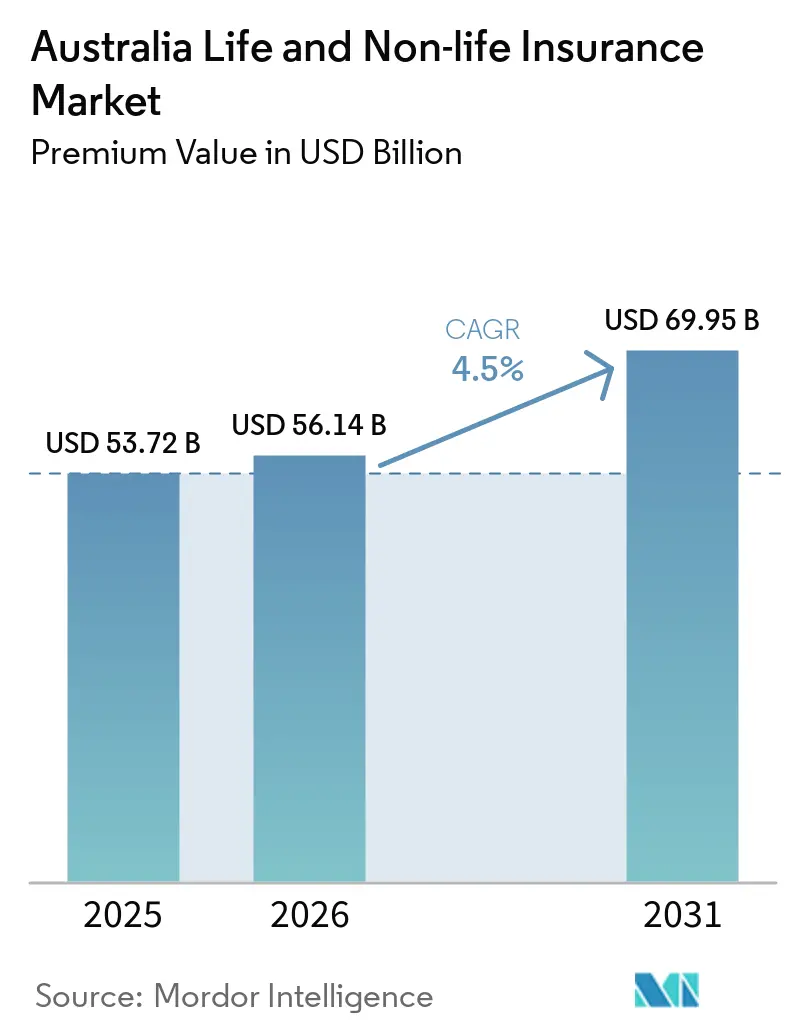
| Base Year Market Size (2025) | USD 53.72 Billion |
| Market Size (2026) | USD 56.14 Billion |
| Market Size (2031) | USD 69.95 Billion |
| Growth Rate (2026 - 2031) | 4.50% CAGR |
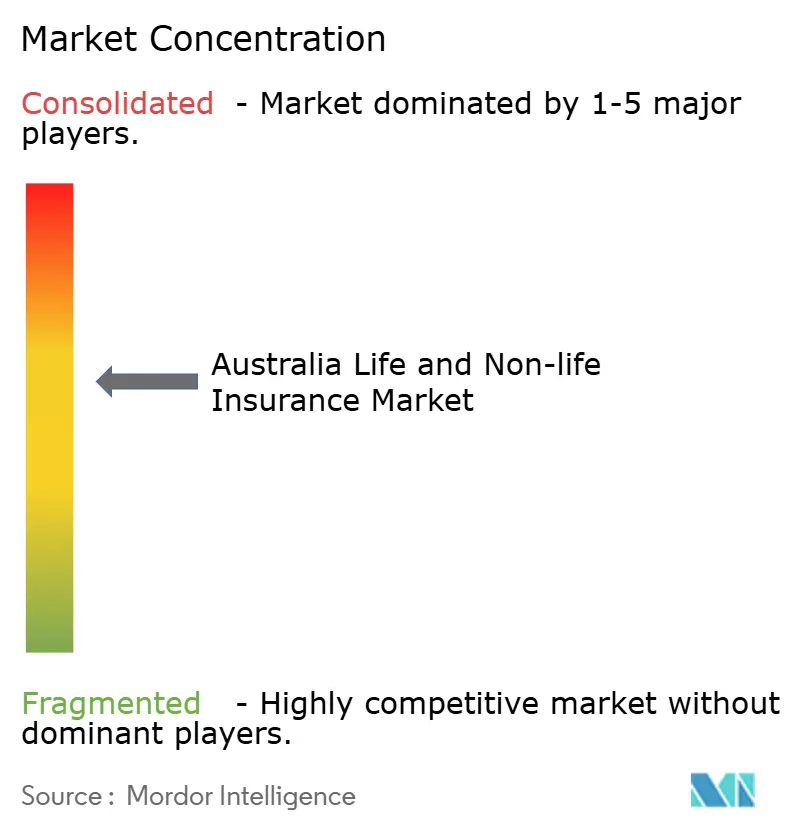
| Market Concentration | Medium |
Major Players *Disclaimer: Major Players sorted in no particular order Image © Mordor Intelligence. Reuse requires attribution under CC BY 4.0. | |
Australia Life and Non-life Insurance Market Analysis by Mordor Intelligence
The Australia Life And Non-life Insurance Market size in terms of premium value is expected to increase from USD 53.72 billion in 2025 to USD 56.14 billion in 2026 and reach USD 69.95 billion by 2031, growing at a CAGR of 4.5% over 2026-2031.
Growth endures despite higher catastrophe losses, subdued investment yields, and post-Royal-Commission compliance costs because insurers are digitizing core systems, embedding cover in everyday transactions, and refining climate-risk pricing. Mandatory motor policies, superannuation-linked life cover, and rising corporate risk awareness underpin premium volumes, while generative AI underwriting and real-time catastrophe analytics safeguard margins.
Key Report Takeaways
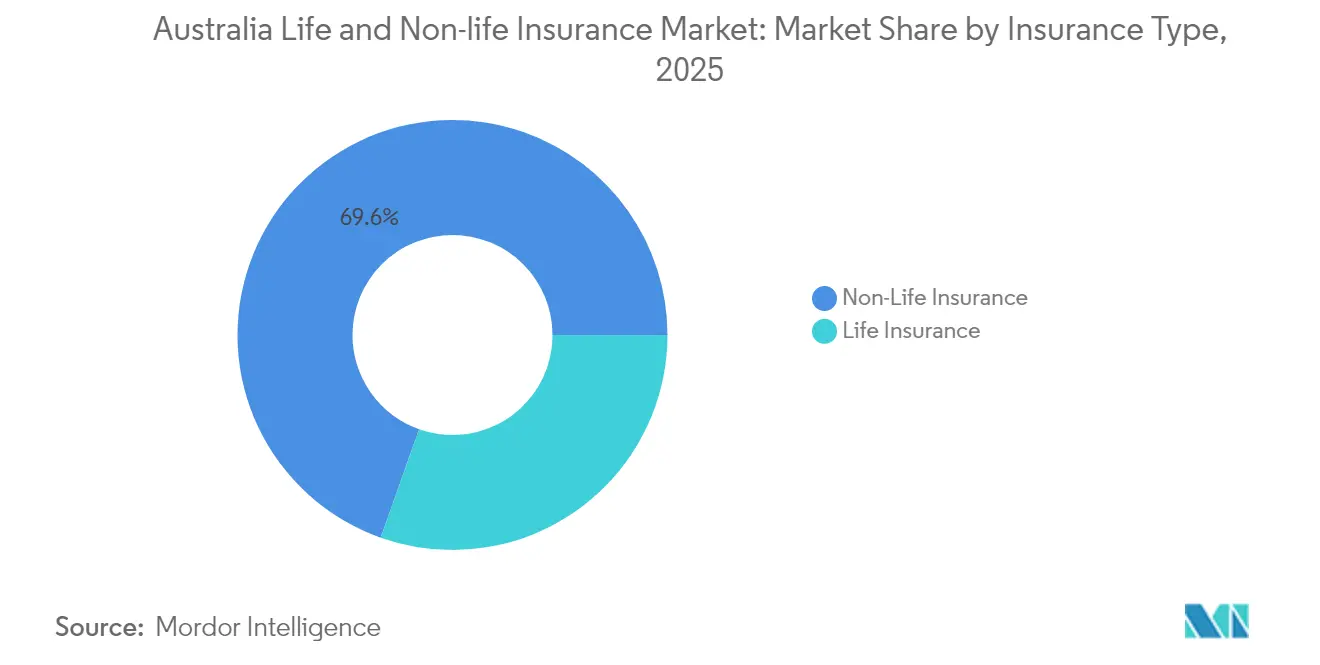
- By insurance type, non-life products held a 69.58% revenue share of the Australia life and non-life insurance market in 2025; group life, aided by compulsory super funds, is expanding at a 5.72% CAGR.
- By distribution channel, brokers captured 34.92% of the Australia life and non-life insurance market share in 2025, whereas digital platforms are advancing fastest at a 4.55% CAGR.
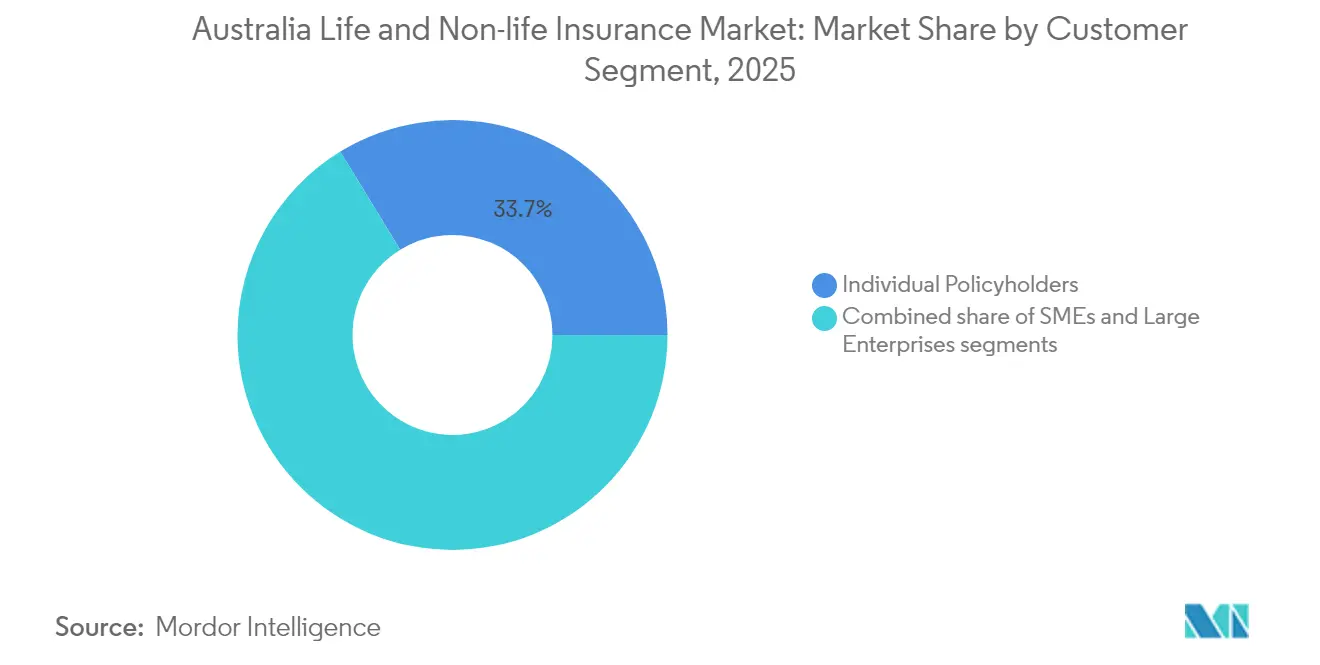
- By customer segment, large enterprises recorded a 5.41% CAGR through 2031, outpacing individual policyholders’ growth. At the same time, Individual policyholders contributed 33.74% of the market.
- By premium frequency, single-premium contracts accounted for 28.15% of the Australia life and non-life insurance market size in 2025, while regular premiums showed growth of 4.53% for the forecast period.
- By region, New South Wales generated 34.22% of total premiums in 2025, while Victoria is projected to rise at a 5.27% CAGR by 2031.
Note: Market size and forecast figures in this report are generated using Mordor Intelligence’s proprietary estimation framework, updated with the latest available data and insights as of 2026.
Australia Life and Non-life Insurance Market Trends and Insights
Drivers Impact Analysis*
| Driver | ( ~ ) % Impact on CAGR Forecast | Geographic Relevance | Impact Timeline |
|---|---|---|---|
| Ageing population & retirement savings gap | +1.2% | National, most pronounced in NSW & Victoria | Long term (≥ 4 years) |
| Climate-linked catastrophes raise non-life uptake | +0.8% | National, acute in Queensland & NSW | Medium term (2-4 years) |
| Superannuation reform boosts group life cover | +0.9% | National | Medium term (2-4 years) |
| Embedded insurance via fintech ecosystems | +0.6% | Urban centres expanding to regional areas | Short term (≤ 2 years) |
| Parametric micro-insurance for rural & agri segments | +0.4% | Rural Australia, Queensland, Western Australia | Long term (≥ 4 years) |
| AI-driven underwriting & personalised products | +0.7% | National, early adoption in major cities | Short term (≤ 2 years) |
| Source: Mordor Intelligence | |||
Ageing Population & Retirement Savings Gap
Australia’s 65-plus cohort is growing by 3.2% annually to 2030, lifting longevity and healthcare expenditure risks. TAL’s research shows 62% of pre-retirees feel financially unprepared for retirement, amplifying demand for life, trauma, and aged-care-funding products[1]TAL Services Limited, “Australians and Retirement Readiness Report 2024,” tal.com.au. Superannuation balances create a captive distribution rail for group policies that automatically enroll members and streamline underwriting. Players are layering cognitive-decline riders, long-term-care cash benefits, and annuity-like draw-down features, positioning the Australia life and non-life insurance market as a cornerstone of post-retirement income planning. Digital engagement tools prompt policy reviews around milestone birthdays, reducing lapse rates and broadening coverage among retirees. Over the long run, favorable demography adds roughly 1.2% points to forecast CAGR, offsetting margin compression from low yields.
Climate-Linked Catastrophes Raise Non-Life Uptake
Natural disaster severity has intensified; Suncorp absorbed USD 756 million in hazard costs during fiscal 2024, well above allowance[2]Suncorp Group, “FY24 Investor Presentation,” suncorpgroup.com.au. The Reserve Bank warns that 4% of dwellings are uninsured and 7% are under-insured, prompting regulators to spotlight climate affordability gaps. Insurers now couple real-time radar, IoT sensors, and suburb-level hail modeling to price household risks by roof type and elevation. Parametric cyclone covers pay within days using wind-speed triggers, restoring trust in high-risk regions and supporting the Australia life and non-life insurance market premium base. Reinsurers reward data-driven mitigation with lower retentions, freeing capital for growth in strata, SME, and agricultural lines. The driver contributes an estimated 0.8%-point lift to market CAGR through 2030.
Superannuation Reform Boosts Group Life Cover
Parliamentary amendments require default life and TPD cover to reflect members’ salary and age, expanding sums insured across 16 million super fund accounts. AMP’s selection of TAL as a default partner channels millions of members into a single digital claims portal[3]AMP Ltd., “TAL Appointed Default Insurance Partner,” amp.com.au. Group life’s scale slashes per-member expense ratios, enabling higher benefit limits without premium jumps, which propels the Australia life and non-life insurance market toward steadier cash flows. Simplified automated underwriting removes health-question friction, raising penetration among younger cohorts who historically lacked cover. TAL paid USD 2.65 billion in claims in 2024, evidencing the sector’s social safety net role. Reforms add roughly 0.9 percentage points to forecast CAGR.
Embedded Insurance via Fintech Ecosystems
Banks, ride-hailing apps, and buy-now-pay-later platforms embed protection at checkout, cutting acquisition costs by up to 40% versus traditional channels. Commonwealth Bank’s tie-up with Hollard inserts device, motor, and travel quotes into its 7.8 million-user mobile app. Insurtechs like Qikio co-create white-label motor policies with established underwriters to capture price-sensitive digital natives. API-driven distribution feeds behavioral data into AI engines, improving risk segmentation while deepening customer stickiness inside the Australia life and non-life insurance market. Early success in electronics extended-warranty bundles is spreading to personal-accident and micro-health lines. This mechanism pushes upmarket CAGR by 0.6% points in the near term.
Restraints Impact Analysis*
| Restraint | ( ~ ) % Impact on CAGR Forecast | Geographic Relevance | Impact Timeline |
|---|---|---|---|
| Low interest-rate returns pressure profitability | -0.7% | National | Medium term (2-4 years) |
| Fraudulent claims & lengthy settlements | -0.5% | National, higher in metropolitan areas | Short term (≤ 2 years) |
| Post-Royal Commission trust deficit | -0.4% | National | Long term (≥ 4 years) |
| Data-privacy curbs on health-data-led pricing | -0.3% | National | Medium term (2-4 years) |
| Source: Mordor Intelligence | |||
Low Interest-Rate Returns Pressure Profitability
The 10-year Australian Commonwealth bond yield has hovered near 3%, compressing spreads on legacy guaranteed portfolios. Life insurers struggle to reinvest maturing assets above liability-matching thresholds, eroding solvency margins. Capital-light unit-linked funds and protection-only covers are displacing traditional endowment products inside the Australia life and non-life insurance market. Yet, policyholders chasing yield turn to ETFs, reducing discretionary savings allocations to life wrappers. To defend margin, players hike risk charges, reprice renewable term business, and shift surplus into private credit strategies that add complexity and prolong product-approval cycles, trimming market CAGR.
Fraudulent Claims & Lengthy Settlements
ASIC’s complaints database shows average life-claim investigations extend 18 months, with 8% of claims denied, sparking media scrutiny. Heightened suspicion elevates manual investigations, inflating expense ratios by 120 basis points across some lines. In motor, staged accidents and inflated repair quotes increase property claims frequency, pushing insurers to deploy AI-powered fraud detection. However, privacy statutes restrict data-set breadth, slowing algorithm training and prolonging assessment times. Customer frustration feeds lapse rates and dents Net Promoter Scores, shaving roughly 0.5% points off the Australia life and non-life insurance market CAGR until faster adjudication frameworks mature.
*Our forecasts treat driver/restraint impacts as directional, not additive. The impact forecasts reflect baseline growth, mix effects, and variable interactions.
Segment Analysis
By Insurance Type: Non-Life Dominance Amid Life-Sector Reinvention
Non-life business captured 69.58% of the Australia life and non-life insurance market in 2025 as compulsory third-party motor, property, and commercial liability lines anchor premiums. Catastrophe-responsive pricing enables underwriters to reset rates every 12 months, preserving underwriting margin even as claims volatility rises. The Australia life and non-life insurance market size for non-life products grew 5.88% in 2025 off the back of re-rated household policies following successive flood events. Life-sector realignment centers on group schemes that shaved 35 basis points from expense ratios through scale, spurring a 5.72% CAGR. Mental health claims now account for 18% of Zurich’s life payouts, prompting benefit caps and value-based rehab partnerships that curb severity.
In parallel, the newly branded Acenda, born from Nippon Life’s merger of MLC Life and Resolution Life, integrates data lakes across 2 million policies to cross-sell trauma and income-protection riders, boosting persistency inside the Australia life and non-life insurance market. Reinsurers, enticed by transparent data sharing, offer quota-share relief that frees up domestic capital for product innovation. Over the forecast horizon, non-life is expected to maintain its leadership, yet life is projected to add USD 5.63 billion in fresh premiums through hybrid investment-protection contracts that appeal to wealth accumulators seeking downside shields.


By Distribution Channel: Digital Disruption Challenges Broker Hegemony
Brokers held 34.92% of the Australia life and non-life insurance market in 2025, dominating complex commercial placements such as directors-and-officers or trade credit. Relationship depth, bespoke wording expertise, and claims-support capability keep attrition low among mid-market clients. Still, digital portals now capture 22% of personal lines premiums and are posting a 4.55% CAGR. Direct channel net expense ratios average 23%, roughly 600 basis points below broker-sold motor business, drawing insurer investment toward self-serve apps and usage-based cover.
Embedded banking, retailer affinities, and super-app integrations reinforce the Australia life and non-life insurance market shift. Commonwealth Bank’s 2024 pilot embedded just-in-time device protection into its shopping-cart API, tripling take-up compared with branch referrals. Broker consolidation counters digital leakage; Ardonagh’s USD 1.45 billion acquisition of PSC delivers scale, shared analytics, and proprietary e-placement platforms. Forward-looking brokerages equip advisers with AI-powered risk-advice engines, melding human counsel with data-driven insights to defend relevance.
By Customer Segment: Enterprise Growth Outpaces Individual Market
Large corporates are expanding premiums at a 5.41% CAGR as directors-and-officers, cyber, and environmental-liability demands surge under stricter disclosure and ESG regimes. The Financial Accountability Regime that commenced in March 2025 escalates executive personal-exposure caps, triggering a 12% spike in limits purchased, which lifts the Australia life and non-life insurance market size for commercial liability. Individual policyholders still represent 33.74% of total premiums; however, rising household insurance costs, up 10% per year in cyclone-exposed postcodes, dampen renewal rates.
SMEs sit between affordability and awareness gaps, especially in cyber. IAG’s Cylo platform, backed by CGU capacity, offers fixed-price cyber bundles that cut coverage wordings from 50 to 12 pages, raising conversion among micro-firms from 7% to 15%. The Australia life and non-life insurance industry is also piloting pay-as-you-grow premiums keyed to revenue bands, easing cash-flow stress on start-ups. This granular segmentation enables underwriters to reprice quarterly, aligning risk exposure with dynamic business models.
By Premium Frequency: Single-Premium Products Mirror Economic Uncertainty
Single-premium contracts owned 28.15% of the Australia life and non-life insurance market in 2025, a share inflated by retirees who prefer lump-sum certainty when crystallizing superannuation balances. Product suites include immediate-issue funeral plans, and one-off wealth-transfer covers. Conversely, regular-premium business demonstrates a 4.53% CAGR on the back of payroll-deducted group life and monthly financed motor policies. The Australia life and non-life insurance market share of hybrid contracts allowing policyholders to switch between annual and monthly debits without penalties has climbed to 6%, signaling future mainstream adoption.
TAL’s real-time alteration engine now re-quotes frequency changes in under 10 minutes, dropping adviser admin time by 65%. Start-ups experiment with micro-debits tied to kilometers driven or calories burned, mirroring cash-flow patterns of gig-economy workers. Insurers favor recurring premiums for predictable capital planning, but they increasingly bundle loyalty discounts for single-premium clients to lock in persistence when economic headwinds mount.
Geography Analysis
New South Wales generated 34.22% of the Australia life and non-life insurance market’s premium pool in 2025, buoyed by Sydney’s finance cluster, 8.2 million residents, and high property values that inflate sums insured. Coastal flood risk compels sophisticated catastrophe modeling; insurers leverage lidar elevation data to segment risk street by street, controlling loss ratios even as claim frequency rises. Commercial-line density is unrivaled, with CEOs purchasing larger directors-and-officers limits after the Financial Accountability Regime went live.
Victoria is the fastest-growing state, clocking a 5.27% CAGR to 2031 on the back of population inflows, infrastructure megaprojects, and proactive climate-resilience grants that enable parametric covers. Melbourne’s technology ecosystem spurs take-up of cyber and professional indemnity policies, while public-private collaborations open sandboxes for insurtech prototypes. State regulators fast-track product approvals, shortening time-to-market for innovative covers and drawing capital inflows that enlarge the Australia life and non-life insurance market size for specialty lines.
Queensland’s cyclone belt pushes premiums above affordability thresholds, yet it remains a vital growth node because mining, agribusiness, and tourism all require tailored coverages. CSIRO’s crop-yield index insurance pilots provide farmers with rapid drought payouts, exemplifying parametric innovation that expands the Australia life and non-life insurance market in rural areas. Meanwhile, government rebates for home-elevation retrofits are linked to insurer-verified certification, nudging policyholders toward risk-reduction behavior and stabilizing future household-premium trajectories.
Competitive Landscape
Australia’s top five players are Suncorp, IAG, Allianz Australia, QBE, and AIA Group, command approximately majority of the total gross written premiums, giving the market a moderate concentration profile. Strategic consolidation remains brisk; IAG’s USD 538.7 million acquisition of 90% of RACQ’s underwriting arm adds USD 819 million to its premium base and deepens penetration in Queensland. Allianz’s USD 263.3 million purchase of RAA General Insurance secures a stronghold in South Australia’s motor and home segments.
Technology investments differentiate winners. Suncorp migrated policy administration to a low-code cloud suite, enabling 48-hour product sprints that cut IT run costs by 22%. TAL’s Microsoft partnership integrates Azure OpenAI Service into claims triage, lowering average decision time from 28 days to 4 hours. Insurtechs like Qikio, CFC, and Honey Insurance attract millennials with gamified risk-pricing and instant digital issuance, nibbling at personal lines segments that incumbents long dominated.
Specialty niches such as cyber, parametric agriculture, and mental-health-inclusive life cover remain fragmented; no player holds more than a 15% share, creating greenfield upside. Carriers cultivate ecosystem alliances with banks, retailers, and telcos to widen distribution reach. Compliance intensity climbs after the Royal Commission; insurers with robust governance frameworks convert oversight into brand equity, whereas smaller underwriters face escalating cost-to-serve, nudging them toward MGA or fronting models within the Australia life and non-life insurance market.
Australia Life and Non-life Insurance Industry Leaders
Insurance Australia Group (IAG)
Suncorp Group
QBE Insurance Group
Allianz Australia
AIA Group
- *Disclaimer: Major Players sorted in no particular order

Recent Industry Developments
- December 2024: Nippon Life merged MLC Life and Resolution Life Australasia to form Acenda, a new entity that now caters to 2 million customers, providing a wide range of life insurance and financial services.
- October 2024: Macquarie set up a rent-a-captive facility, which aggregates premiums amounting to USD 1.6 billion, offering businesses an innovative risk management solution.
- July 2024: TAL entered a three-year generative AI collaboration with Microsoft, aiming to enhance operational efficiency and customer experience through advanced AI-driven solutions.
- July 2024: CFC bolstered its Australian cyber capacity with the acquisition of Solution Underwriting, strengthening its position in the cyber insurance market and expanding its product offerings.
- June 2024: TAL introduced real-time alteration quotes for its Accelerated Protection product, enabling customers to make instant policy adjustments with greater flexibility and convenience.


Research Methodology Framework and Report Scope
Market Definitions and Key Coverage
Our study defines Australia's life and non-life insurance market as all gross premiums written by licensed insurers that underwrite life risk as well as property, motor, liability, health, and other general lines for resident policyholders. Group superannuation life covers are counted at the premium level, while inward reinsurance and overseas branches are left out of scope.
Scope exclusions include standalone reinsurance treaties, captive arrangements, credit unions' mutual benefit schemes, and government accident compensation pools.
Segmentation Overview
- By Insurance Type
- Life Insurance
- Individual
- Group
- Non-Life Insurance
- Fire
- Motor
- Marine
- Health
- Other Non-Life Insurance
- Life Insurance
- By Distribution Channel
- Direct
- Brokers
- Banks
- Digital / Online
- Other Channels
- By Customer Segment
- Individual Policyholders
- Small & Medium Enterprises (SMEs)
- Large Enterprises
- By Premium Frequency
- Regular Premium
- Single Premium
- By region
- New South Wales
- Victoria
- Queensland
Detailed Research Methodology and Data Validation
Primary Research
We interviewed underwriting heads, broker principals, insurtech founders, and actuarial consultants across New South Wales, Victoria, Queensland, and Western Australia. These conversations validated penetration rates, average premiums, commission spreads, and likely regulatory pacing, helping us adjust desk findings and calibrate scenario weights.
Desk Research
Analysts began with tier-1 public sources such as the Australian Prudential Regulation Authority, Australian Bureau of Statistics, Reserve Bank of Australia, the Insurance Council of Australia, and the International Association of Insurance Supervisors to establish premium pools, claim trends, solvency, and macro drivers. Company filings, investor decks, and parliamentary committee transcripts then clarified strategic pivots, pricing actions, and regulatory intent. Premium splits by product, channel, and state were further refined through customs shipment values for motor vehicles, housing approval data, census demographics, and bushfire loss databases. Select paid databases, notably D&B Hoovers for insurer financials and Dow Jones Factiva for deal flow, filled remaining gaps. The sources listed here are illustrative; many additional materials were reviewed before numbers were finalized.
Market-Sizing & Forecasting
A top-down build starts with APRA premium disclosures, reconstructed into life and each non-life class, then adjusted for offshore cessions before currency-converting to constant 2024 US dollars. Results are stress-tested against bottom-up snapshots such as sampled insurer premium multiplied by average selling price, state motor registrations, and household dwelling counts. Key variables feeding the model include population aging, disposable income per capita, new vehicle sales, building approvals, and catastrophe loss ratios; their trajectories are forecast through multivariate regression blended with expert-guided scenario analysis. Where bottom-up samples diverge, gaps are apportioned to the segment with the weakest primary corroboration.
Data Validation & Update Cycle
Outputs pass two analyst reviews, variance checks against quarterly APRA releases, and a senior sign-off. Reports refresh every twelve months, with interim revisions triggered by material weather events, regulatory changes, or merger announcements, ensuring clients receive the latest calibrated view.
Why Mordor's Australia Life And Non-Life Insurance Baseline Earns Trust
Published estimates often differ; definitions, exchange rates, refresh cadence, and inclusion of group covers each sway totals.
Key gap drivers include whether group superannuation life premiums are counted, if inward reinsurance is netted out, the currency year used, and whether one takes a rolling five-year average or a single-year snapshot for catastrophes. Mordor adopts a consistent scope, applies constant currency, and refreshes annually, so our 2025 baseline remains both current and comparable.
Benchmark comparison
| Market Size | Anonymized source | Primary gap driver |
|---|---|---|
| USD 53.72 B (2025) | Mordor Intelligence | - |
| USD 51.38 B (2025) | Regional Consultancy A | Excludes digital-only insurers and uses prior-year catastrophe average |
| USD 49.14 B (2024) | Global Consultancy B | Uses spot FX, omits group life premiums, updates biennially |
The comparison shows that while figures cluster closely, scope and refresh choices explain remaining variance. Mordor's disciplined, annually updated approach, anchored in transparent variables, offers decision-makers a balanced, reproducible baseline.


Key Questions Answered in the Report
What is the forecast size of the Australia life and non-life insurance market by 2031?
It is projected to reach USD 69.95 billion.
Which segment is growing fastest within the market?
Group life insurance, supported by superannuation reforms, is expanding at a 5.72% CAGR.
How are digital channels reshaping distribution?
Online and embedded platforms are posting a 4.55% CAGR by reducing acquisition costs and delivering personalized offers at the point of need.
What technologies are insurers using to manage climate risk?
Real-time hail modeling, IoT sensors, and parametric triggers enable dynamic pricing and faster catastrophe payouts.
How does low interest affect life insurers?
Subdued bond yields compress investment spreads on guaranteed products, prompting a shift toward unit-linked and protection-only offerings.
Page last updated on:


