Edge Computing Market Size and Share
Market Overview
| Study Period | 2020 - 2031 |
|---|---|
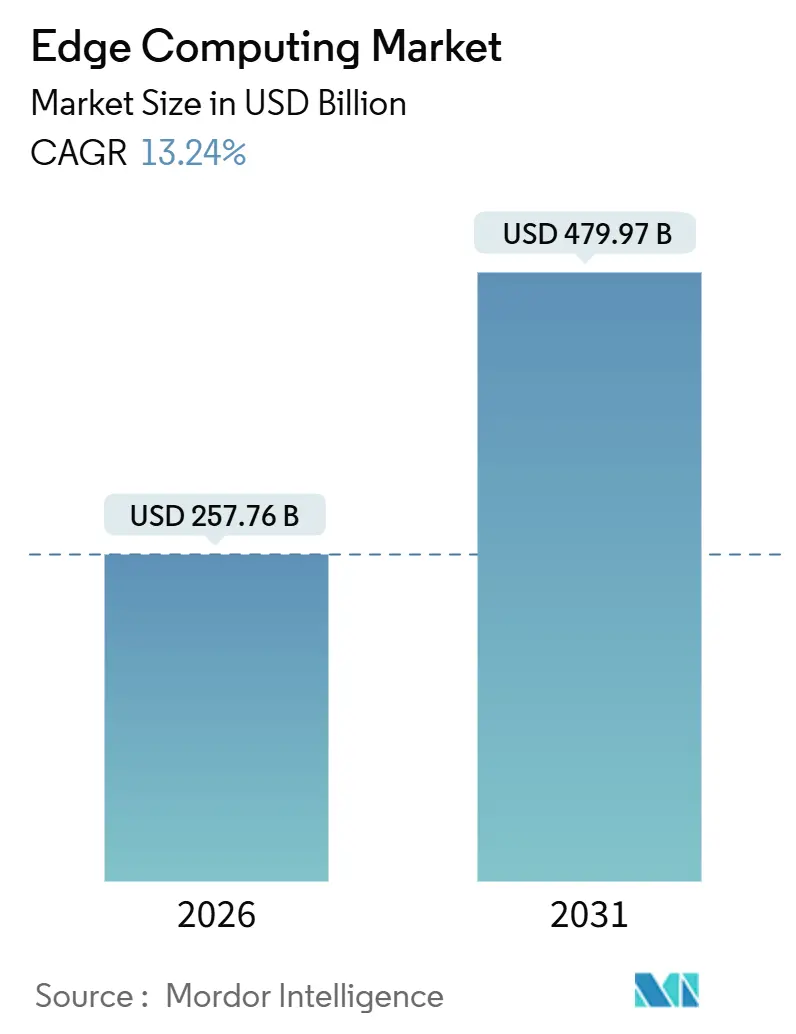
| Market Size (2026) | USD 257.76 Billion |
| Market Size (2031) | USD 479.97 Billion |
| Growth Rate (2026 - 2031) | 13.24% CAGR |
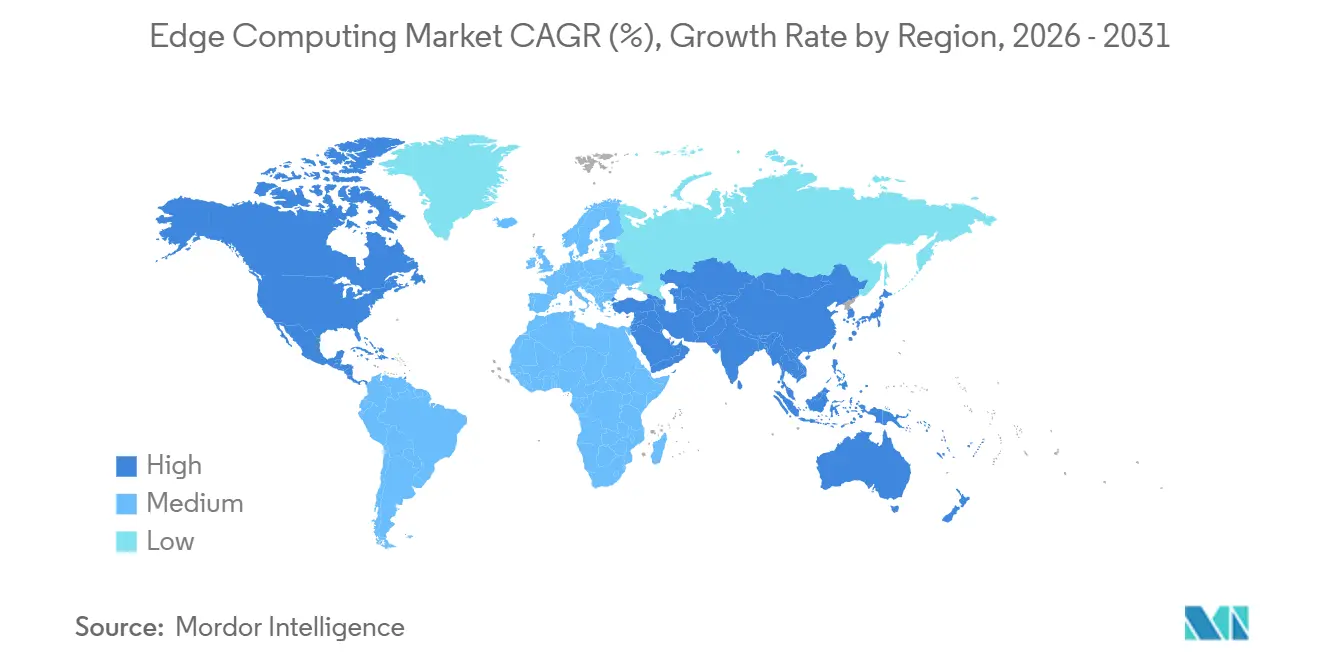
| Fastest Growing Market | Asia Pacific |
| Largest Market | North America |
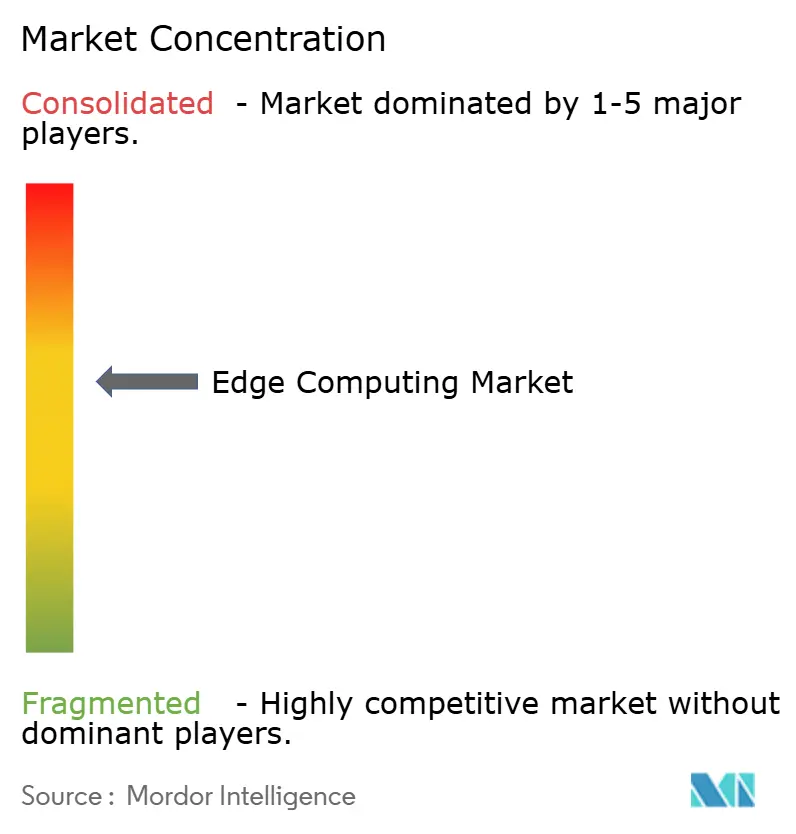
| Market Concentration | Medium |
Major Players *Disclaimer: Major Players sorted in no particular order Image © Mordor Intelligence. Reuse requires attribution under CC BY 4.0. | |
Edge Computing Market Analysis by Mordor Intelligence
The edge computing market size reached USD 257.76 billion in 2026 and is projected to advance to USD 479.97 billion by 2031 at a 13.24% CAGR, underscoring a decisive pivot toward distributed processing architectures that minimize round-trip latency and comply with emerging data-sovereignty rules. 5G standalone roll-outs, jurisdictional data-localization mandates, and an explosion of AI-enabled endpoints concentrate demand at the network perimeter, while declining ASIC and system-on-chip prices lower the entry barrier for on-premise inference. Hyperscalers extend public-cloud control planes into carrier facilities and enterprise campuses, blending cloud convenience with local processing. Industrial IoT installs, real-time clinical diagnostics, and autonomous systems fuel near-term spending, whereas carbon-reduction targets and chiplet-based custom silicon shape longer-run innovation. Competitive advantage gravitates to providers that orchestrate heterogeneous nodes through a single Kubernetes-native plane and embed zero-trust security from silicon to workload.
Key Report Takeaways
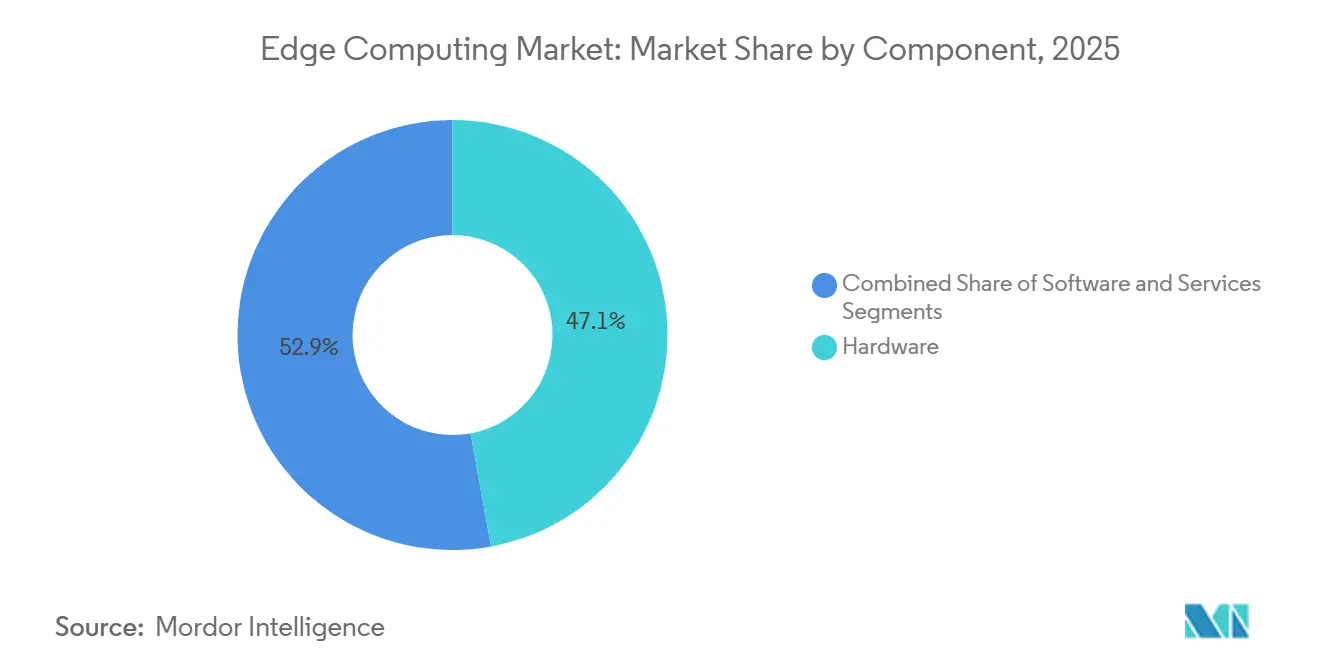
- By component, hardware captured 47.13% of the edge computing market share in 2025, whereas services are forecast to expand at a 13.87% CAGR through 2031.
- By deployment mode, cloud models held 58.19% of the revenue share in 2025, with on-premises forecast to grow at a 13.61% CAGR to 2031.
- By end-user industry, manufacturing accounted for 22.58% of the edge computing market size in 2025, while healthcare is advancing at a 14.66% CAGR to 2031.
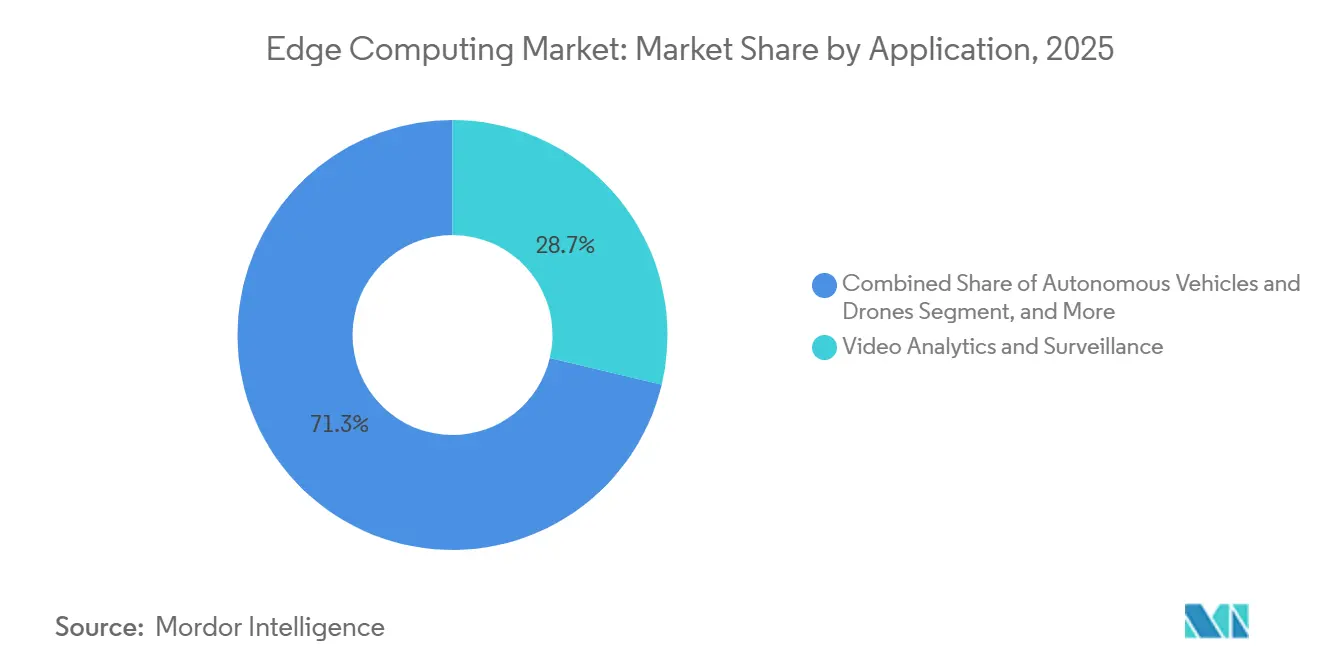
- By application, video analytics led the edge computing market with 28.71% of the market share in 2025, and autonomous vehicles are set to accelerate at a 14.11% CAGR through 2031.
- By organisation size, large enterprises dominated with 63.44% of deployments in 2025, whereas SMEs are growing at a 13.69% CAGR through 2031.
- By geography, North America accounted for 33.91% of spending in 2025, while Asia-Pacific is expanding at a 14.21% CAGR through 2031.
Note: Market size and forecast figures in this report are generated using Mordor Intelligence’s proprietary estimation framework, updated with the latest available data and insights as of January 2026.
Market Trends and Insights
Drivers Impact Analysis of Edge Computing Market*
| Driver | (~) % Impact on CAGR Forecast | Geographic Relevance | Impact Timeline |
|---|---|---|---|
| 5G Roll-Out Catalysing Ultra-Low-Latency Use-Cases | +2.8% | Global, with Asia-Pacific leading standalone deployments and Europe lagging | Medium term (2-4 years) |
| Proliferation of IoT Endpoints and Data Gravity at the Edge | +3.1% | Global, concentrated in manufacturing hubs across Asia-Pacific and North America | Long term (≥ 4 years) |
| Regulatory Data-Sovereignty Mandates (e.g., EU Data Act) | +1.9% | Europe primary, spillover to Middle East and Africa through GDPR-equivalent frameworks | Short term (≤ 2 years) |
| Declining ASIC/SoC Costs for Edge Inference Accelerators | +2.3% | Global, with supply-chain concentration in Taiwan and South Korea | Medium term (2-4 years) |
| Energy-Efficiency Targets Driving Micro-Data-Centres (ESG) | +1.4% | Europe and North America driven by carbon-neutrality commitments | Long term (≥ 4 years) |
| Rise of RISC-V and Chiplet Architectures Enabling Custom Edge Silicon | +1.7% | Asia-Pacific and North America, led by semiconductor design hubs | Long term (≥ 4 years) |
| Source: Mordor Intelligence | |||
5G Roll-Out Catalysing Ultra-Low-Latency Use-Cases
Standalone 5G cores now steer traffic to base-station micro data centers, trimming round-trip latency below 10 milliseconds.[1]Ericsson, “Ericsson Mobility Report November 2024,” ericsson.com Asian operators had installed 1.8 million edge-enabled 5G sites by mid-2025, enabling factory automation and remote-surgery pilots. Europe shows slower uptake because many carriers still depend on 4G cores, limiting multi-access edge compute despite high radio coverage. Spectrum licenses in the 3.5 GHz band now include edge-hosting clauses, pushing telcos to colocate compute with radios. Equipment vendors bundle orchestration software with radios, letting enterprises deploy container workloads through familiar cloud APIs. These conditions make 5G the primary on-ramp for ultra-reliable low-latency edge applications across mobility, gaming, and industrial control.
Proliferation of IoT Endpoints and Data Gravity at the Edge
Enterprise IoT connections exceeded 19 billion in 2025, producing exabyte-scale telemetry that swamps backhaul links and raises egress fees.[2]Verizon Communications, “State of IoT 2025,” verizon.com A single automotive plant now streams terabytes daily, yet only a fraction of that data merits long-term storage, pushing analytics to on-site gateways. Edge processing lowers cloud bills and tightens control loops, boosting equipment uptime by double-digit percentages. IEC 62443 security guidelines further mandate local anomaly detection to shield operational technology from network faults. As AI models compress onto watt-scale chips, companies ship insights rather than raw data, reinforcing the gravity of the pull toward edge locations. This dynamic reallocates budget from central servers to ruggedized nodes and fleet-management software.
Regulatory Data-Sovereignty Mandates (EU Data Act)
The EU Data Act, enforceable since September 2025, bans lock-in clauses and grants emergency access rights, effectively requiring that personal and industrial data stay inside member-state borders.[3]European Commission, “Regulation (EU) 2023/2854 (Data Act),” europa.eu Financial, healthcare, and public-sector workloads now anchor in regional micro data centers to pass audits without rewriting applications. EU-funded research counted 1,836 active edge nodes in 2024, triple the 2022 level, with Germany, France, and the Netherlands hosting most deployments. Saudi Arabia’s Personal Data Protection Law and India’s Digital Personal Data Protection Act replicate similar rules, exporting the sovereignty effect beyond Europe. ISO 27001 auditors now expect proof of local log retention, tying certification to edge architectures. Compliance pressure, therefore, transforms what began as a privacy concern into a direct mandate for infrastructure.
Declining ASIC/SoC Costs for Edge Inference Accelerators
Prices for AI-optimized ASICs and system-on-chip modules have dropped by more than 40% since 2022, enabling fanless edge servers priced under USD 500 to deliver hundreds of TOPS on-site. Intel’s Xeon D-3000 integrates AI engines that boost inference speed while reducing power draw by 40% relative to prior generations. Google TPUs moved off cloud shelves and into Advantech gateways, cutting the cost per million operations to 2 cents. RISC-V chiplets give Asian manufacturers a sanctions-proof path to custom silicon, broadening supplier choice and intensifying price competition. Lower hardware costs shift ROI calculations in favor of distributing models across many small sites rather than a single big data center. This silicon deflation fuels a virtuous cycle, where cheaper compute invites new edge workloads, which in turn further raise chip volumes.
Restraints Impact Analysis of Edge Computing Market*
| Restraint | (~) % Impact on CAGR Forecast | Geographic Relevance | Impact Timeline |
|---|---|---|---|
| Cyber-Attack Surface Expansion at Distributed Nodes | -1.8% | Global, with heightened risk in under-regulated markets lacking cybersecurity frameworks | Short term (≤ 2 years) |
| Skills Gap in Deploying and Managing Heterogeneous Edge Stacks | -1.5% | Global, acute in Europe and emerging Asia-Pacific markets with limited cloud-native talent pools | Medium term (2-4 years) |
| Inter-Operability and Standards Fragmentation (MEC, Open-RAN, LF Edge) | -0.9% | Global, particularly affecting multi-vendor telco deployments | Medium term (2-4 years) |
| Inefficient ROI for Brown-Field Industrial Retro-Fits | -1.1% | North America and Europe, where legacy OT infrastructure dominates manufacturing | Long term (≥ 4 years) |
| Source: Mordor Intelligence | |||
Cyber-Attack Surface Expansion at Distributed Nodes
Each edge gateway adds another ingress point, and Mirai variants already exploit weak credentials on industrial controllers for DDoS campaigns. NIST’s Cybersecurity Framework 2.0 now includes edge-specific controls, yet many SMEs lack the staff to implement secure boot, certificate rotation, and microsegmentation. Firmware refresh cycles stretch five to seven years, leaving devices exposed long after new vulnerabilities appear. Supply-chain directives require signed firmware, but enforcement outside critical infrastructure sectors remains patchy. Insurance premiums for edge deployments climbed 12% in 2025 as carriers priced in the likelihood of breaches. Without automated remediation and stronger baseline hardening, security fears could deter late adopters.
Skills Gap in Deploying and Managing Heterogeneous Edge Stacks
Only 15% of cloud-certified professionals report confidence in networking, real-time OS, and Kubernetes fleet management, creating a talent choke point. The Linux Foundation tallied just 18,000 new edge-specific certificates in 2024, compared with 450,000 general cloud awards, underscoring the mismatch. Hyperscaler courses address basics but fall short on OT protocols and safety standards that factories demand. Limited expertise inflates deployment times and drives up managed-service fees, eroding ROI for small and midsize firms. Universities are revising curricula, yet three-year degree cycles lag 18-month hardware refreshes. Unless automation frameworks mature, the skills deficit will remain a primary brake on market expansion.
*Our forecasts treat driver/restraint impacts as directional, not additive. The impact forecasts reflect baseline growth, mix effects, and variable interactions.
Edge Computing Market Segment Analysis
By Component:
Services Outpace Hardware Through Recurring Edge-as-a-Service ModelsServices revenue is on track to eclipse appliance sales as customers shift capital outlays into operational budgets. In 2025, hardware still accounted for 47.13% of the edge computing market, yet managed services are forecast to grow at 13.87% annually through 2031, supported by hyperscaler bundles that fuse compute, orchestration, and security under subscription pricing. Dell noted a 19% jump in edge-infrastructure revenue, but its services attach rate hit 68% as clients demanded lifecycle management. Hewlett Packard Enterprise’s GreenLake contracts, billed per workload, eliminate capacity-planning risk and improve time-to-value for factories retrofitting AI inspection. Hardware commoditization persists as DRAM and NAND costs fluctuate; ODM rivalry tempers server ASPs, prompting vendors to focus on software differentiation and professional services.
Edge-native software, including slim Kubernetes distributions and eventually consistent databases, grows at 13.45% through 2031. Red Hat OpenShift and SUSE Rancher square off for enterprise control-plane dominance, while open-source K3s captures resource-constrained deployments. System integrators such as Capgemini Engineering saw OT-edge engagements rise 34% in 2024, reflecting demand for domain expertise to translate shop-floor processes into microservice architectures. Overall, services convert one-time margin into multiyear cash flows, positioning vendors to capture long-run value once hardware marginal gains plateau.


By Deployment Mode:
Cloud Models Dominate Through Distributed Infrastructure ExtensionsCloud-connected installations commanded 58.19% of the edge computing market share in 2025 and will expand at a 13.61% CAGR through 2031 as AWS Wavelength, Azure Edge Zones, and Google Distributed Cloud push hyperscaler APIs into carrier facilities. These offerings deliver sub-10-millisecond latency without demanding proprietary edge SDKs, lowering developer friction. Microsoft expanded Azure Edge Zones to 47 metro areas and publicly promotes single-control-plane management from the cloud to the factory floor.
On-premise deployments persist in regulated verticals that bar external data transit - pharma batch records, PCI-DSS card data, and safety-critical automation. Even there, organizations increasingly adopt cloud-native orchestration to avoid divergent toolchains. Hybrid topologies blend gateway hardware installed behind corporate firewalls with cloud-managed configuration, striking a balance between data residency and operational agility. EU Data Act portability clauses accelerate this pattern because enterprises must demonstrate switching readiness, favoring open Kubernetes over proprietary edge stacks.
By End-User Industry:
Healthcare Surges While Manufacturing Anchors Installed BaseManufacturing retained a 22.58% share of the edge computing market in 2025, leveraging digital twins and predictive maintenance to reduce downtime. Yet healthcare is the runway for the highest incremental spend, racing ahead at a 14.66% CAGR into 2031. The U.S. FDA cleared AI-enabled imaging devices that require sub-50-millisecond inference at bedside for HIPAA compliance, steering hospital IT budgets to edge nodes.
Energy utilities leverage edge analytics to improve grid stability, while retailers embrace computer vision at checkout to reduce labor costs. BFSI firms deploy algorithmic fraud detection at the branch level because microsecond latency yields tangible savings in chargebacks. Telcos are both sellers and buyers of edge, embedding compute in mobile cores while monetizing private-network slices. Regulatory frameworks ranging from ISO 27001 to local privacy laws shape adoption cadence across all verticals, but a common denominator is deterministic latency that centralized clouds cannot meet.
By Application:
Autonomous Systems Accelerate While Video Analytics Leads Installed BaseVideo analytics controlled 28.71% of 2025 revenue, serving smart-city surveillance, retail footfall tracking, and infrastructure inspection. The autonomous vehicle and drone segment, however, is slated for 14.11% CAGR growth, buoyed by beyond-visual-line-of-sight approvals from the U.S. FAA and EU type-approval bodies. Tesla’s Hardware 4 platform processes 300 TOPS within the vehicle, highlighting the pivot to in-situ AI that slashes dependence on cellular coverage.
Industrial IoT predictive maintenance, augmented-reality remote assistance, and edge CDN workloads round out demand. Smart-city projects such as Singapore’s Smart Nation deploy 12,000 edge cameras for traffic optimization, anonymizing faces on-device to comply with GDPR. Retailers like Amazon Go and Walmart embed edge compute to drive cashier-less stores. Each use-case demonstrates the “process-then-store” ethos: analytics executes locally, metadata alone migrates to long-term storage.
By Organisation Size:
SMEs Adopt Edge-as-a-Service While Enterprises Build Private InfrastructureLarge enterprises owned 63.44% of deployments in 2025, enabled by capital budgets and cross-disciplinary talent. Goldman Sachs colocated edge servers inside exchanges to shave microseconds off trade execution, exemplifying latency arbitrage. SMEs, historically priced out by six-figure capex, now tap consumption-based bundles. AWS Outposts 1U ships at roughly USD 5,000 per unit, transforming edge acquisition into an operating expense line item. Microsoft Azure Stack HCI appliances arrive pre-configured, shrinking install time from weeks to hours.
Cost-benefit tipping points still favor cloud-only for low-volume workloads, but verticalized turnkey offerings, including point-of-sale, diagnostic imaging, and plant-floor analytics, blur complexity and catalyze SME uptake. Government tax incentives under Germany’s Industry 4.0 program further sweeten ROI for small manufacturers investing in edge.
Geography Analysis
North America Edge Computing Market
North America commanded 33.91% of 2025 spending, anchored by hyperscaler footprints and early standalone 5G launches from Verizon and AT&T. The United States alone hosts 108 AWS Wavelength zones and 23 Azure Edge Zones, giving developers nationwide low-latency endpoints. Canada’s Bell and Telus added multi-access edge compute to support industrial IoT across resource-extraction sites, while Mexican factories deploy edge quality inspection under nearshoring incentives introduced by the T-MEC accord.
APAC Edge Computing Market
Asia-Pacific is forecast to expand at a 14.21% CAGR through 2031, driven by China Mobile’s 1.8 million edge-enabled 5G base stations. India’s Digital India initiative earmarked 100 smart cities for edge-powered municipal services, while Southeast Asia’s manufacturing migration is accelerating local edge adoption. Japan’s NTT Docomo and South Korea’s SK Telecom integrate edge into autonomous vehicle pilots, while Australia exploits edge compute in remote mining where satellite backhaul is constrained.
EMEA and South America Edge Computing Market
Europe held roughly 24% of global spend in 2025, buoyed by the EU Data Act’s sovereignty requirements and 1,836 documented nodes. Germany, France, and the Netherlands host 61% of these installations, covering automotive, finance, and healthcare. Smart-city mega-projects in Saudi Arabia’s NEOM and the UAE’s Dubai Smart City spearhead Middle East demand, whereas South America clusters center on Brazilian industrial automation and Argentine telecom modernization. Regional spending profiles mirror policy commitments: the U.S. CHIPS and Science Act injects USD 52 billion into domestic semiconductors, and the EU Digital Decade targets 10,000 nodes by 2030, ensuring sustained capex pipelines.

Regulatory Landscape
Edge deployments are increasingly shaped by data sovereignty, product security, and critical-infrastructure cyber rules that influence where workloads run and how edge nodes are hardened. In Europe, Regulation (EU) 2023/2854 (EU Data Act) has been enforceable since September 2025, increasing audit scrutiny on data portability and localization and reinforcing regional micro data centers for regulated workloads. The EU AI Act (Regulation (EU) 2024/1689) adds risk-based obligations for high-risk AI systems, which directly affects edge AI used in safety-critical industrial control, transport, and medical device contexts where on-device inference and logging are common compliance patterns.
Cybersecurity regulation and standards are also moving closer to the hardware and firmware layers used at the edge. The EU Cyber Resilience Act direction on secure-by-design and lifecycle controls increases documentation, vulnerability handling, and event log expectations for connected edge devices sold into the region. In the United States, the Federal Energy Regulatory Commission (FERC) approved updated NERC CIP Reliability Standards in March 2026 (CIP-003-9 through CIP-013-3), including virtualization-related definitions such as Virtual Cyber Asset and Management Interface, shaping how virtualized edge and MEC assets are classified and protected in bulk electric system environments. NIST also released a May 2026 draft on hardware-enabled security techniques, reinforcing baseline approaches such as confidential computing and platform-rooted trust for distributed edge and cloud infrastructure.
Value Chain Analysis
The edge computing value chain covers silicon and hardware (CPUs/SoCs/ASIC accelerators, NICs, memory, ruggedized servers and gateways), platform software (lightweight Kubernetes distributions, device management, observability, and security), connectivity and hosting (private 5G/standalone 5G, carrier MEC sites, and micro data centers), and solution delivery (ISVs, system integrators, and managed services). Hyperscalers extend control planes into operator facilities and enterprise sites through offerings such as AWS Wavelength/AWS Outposts and Azure Edge Zones, while telcos supply real estate, network proximity, and operations to monetize low-latency endpoints for industrial and real-time applications.
Supply constraints remain a gating factor for performance-centric edge AI, especially for advanced accelerators and high-speed networking components. Foundry capacity, including at TSMC, is a recurring bottleneck for AI-oriented silicon used in telco MEC builds, and optical transceiver availability (including 800G and emerging 1.6T) plus related PCB lead times can slow edge-to-core backhaul upgrades. Ecosystem partnerships increasingly bundle hardware reference designs, networking, and lifecycle tooling to shorten integration cycles, illustrated by telco and vendor collaborations in 2026 such as AT&T working with Cisco and NVIDIA on Cisco AI Grid deployments at edge locations, and Nokia agreeing to deploy AI-ready networking solutions across Telefonica edge data centers in Spain.
Competitive Landscape
The top three hyperscalers, AWS, Microsoft, and Google, collectively captured 42% of edge infrastructure revenue in 2025, but hardware vendors, telcos, and niche software firms fragment the remaining pool. Competitive friction centers on orchestration neutrality; enterprises insist on Kubernetes-native stacks that span on-premises gateways, carrier MEC, and public cloud regions. Vapor IO’s tower-based micro data centers, offering edge-as-a-service, and startups commercializing RISC-V silicon compete on cost and vendor lock-out avoidance.
Security capabilities are rapidly differentiating portfolios. Cisco’s USD 1.2 billion acquisition of Isovalent embeds eBPF observability into its industrial security platform, and Palo Alto Networks extends zero-trust to LTE routers. Standards divergence remains unresolved: ETSI MEC profiles, O-RAN disaggregated RAN, and Linux Foundation Edge projects prescribe overlapping APIs, forcing customers either to custom-integrate or embrace closed ecosystems.
Strategic partnerships multiply. AWS teams with Verizon and Vodafone for Wavelength zones, Microsoft aligns with AT&T and Telefónica, and Google allies with Ericsson and Nokia to market Distributed Cloud Edge. Dell, HPE, and Lenovo pre-package edge servers certified for Azure Stack HCI, speeding channel adoption. The competitive map, therefore, resembles a matrix, not a pyramid, with orchestration breadth, vertical solution depth, and security layer completeness shaping win-rates more than raw compute horsepower.
Edge Computing Industry Leaders
Amazon Web Services, Inc.
Microsoft Corporation
Cisco Systems Inc.
Huawei Technologies Co. Ltd.
IBM Corporation
- *Disclaimer: Major Players sorted in no particular order
Edge Computing Market Companies Covered in this Report
- Amazon Web Services, Inc.
- Microsoft Corporation
- Cisco Systems Inc.
- Huawei Technologies Co. Ltd.
- IBM Corporation
- Hewlett Packard Enterprise (HPE)
- Dell Technologies Inc.
- Google LLC (Alphabet Inc.)
- Intel Corporation
- NVIDIA Corporation
- Juniper Networks Inc.
- Advantech Co. Ltd.
- ADLINK Technology Inc.
- Schneider Electric SE
- Siemens AG
- Capgemini Engineering
- MachineShop Inc.
- Vapor IO Inc.
- Litmus Automation
- FogHorn Systems
- Lumen Technologies Inc.

Market Opportunities and Future Outlook
Opportunities are emerging where standards-led federation and sovereign initiatives reduce fragmentation across carrier, enterprise, and public-cloud edge domains. ETSI continued to update MEC guidance with the June 2026 release of ETSI GR MEC 059 V4.1.1 and ETSI GR MEC 001 V4.1.1, supporting more consistent implementation profiles for multi-operator and multi-vendor deployments. European operator collaboration on a federated edge continuum has also moved from concept to demonstration, with Deutsche Telekom and partners showcasing a European Edge Continuum connecting multiple operator networks, which aligns with the market need for Kubernetes-native orchestration across heterogeneous nodes.
Infrastructure build programs also point to whitespace around AI-ready edge and regional capacity beyond traditional metro hubs, shaped by latency, data residency, and power availability. Available Infrastructure launched Project Qestrel in March 2026 with a plan to deploy AI-ready edge data centers across US cities, targeting distributed footprints for inference and industrial workloads. In Southeast Asia, Digital Edge announced a USD 4.5 billion CGK Campus investment in Indonesia (500MW with scalability to 1GW), adding another anchor for cloud-to-edge buildouts supporting manufacturing and digital services growth corridors. Together, these programs reinforce demand for edge platforms that can operate across new site types, from carrier central offices to purpose-built campuses, with security-by-design and auditable data-handling features aligned to sovereignty and AI governance requirements.
Recent Industry Developments in Edge Computing Market
- July 2026: AWS announced a gated preview of AWS Interconnect - last mile in partnership with AT&T in the United States, targeting automated network connectivity between remote locations and AWS. The initiative reduces operational friction for connecting distributed sites, which is important for scaling edge deployments that rely on reliable, policy-driven links back to cloud control planes.
- December 2025: Microsoft expanded Azure Edge Zones to 12 additional Asia-Pacific and European metros, embedding compute in carrier central offices for sub-10-millisecond latency in manufacturing hubs. The expansion deepens the carrier-hyperscaler model for delivering edge compute where data sovereignty and deterministic latency are procurement requirements.
- September 2024: NIST published Cybersecurity Framework 2.0, adding updated governance and risk-management guidance that many enterprises and service providers use to structure security programs for distributed systems. Edge operators increasingly map device identity, secure boot, certificate rotation, and monitoring practices to this framework as the attack surface grows with node count.


Edge Computing Market Report Scope and Research Methodology
Market Definition and Coverage
For this study, the market covers spending on edge computing hardware, enabling software, and managed services used to process data close to where it is created, and then only send selected data back to central cloud when needed.
Scope exclusions: We exclude centralized hyperscale data center infrastructure and consumer smartphones because their cost structure and buying cycles are different from edge deployments.
Segments Covered in This Report
- By Component
- Hardware
- Software
- Services
- By Deployment Mode
- On-Premise
- Cloud
- By End-User Industry
- Manufacturing and Industrial
- Energy and Utilities
- Healthcare and Life Sciences
- Retail and E-Commerce
- Banking, Financial Services, and Insurance (BFSI)
- Telecommunications and IT
- Other End-User Industries
- By Application
- Industrial IoT and Predictive Maintenance
- Video Analytics and Surveillance
- Autonomous Vehicles and Drones
- Other Applications
- By Organisation Size
- Large Enterprises
- Small and Medium Enterprises
- By Geography
- North America
- United States
- Canada
- Mexico
- Europe
- Germany
- United Kingdom
- France
- Russia
- Rest of Europe
- Asia-Pacific
- China
- Japan
- India
- South Korea
- Australia
- Rest of Asia-Pacific
- Middle East and Africa
- Middle East
- Saudi Arabia
- United Arab Emirates
- Rest of Middle East
- Africa
- South Africa
- Egypt
- Rest of Africa
- Middle East
- South America
- Brazil
- Argentina
- Rest of South America
- North America
Data Sources, Market Sizing, and Validation
Desk Research
Desk work starts by mapping what counts as edge, and what does not, so the model does not accidentally include core cloud or general device spend. We use public sources such as US Census ICT surveys, Eurostat ICT usage statistics, the OECD digital economy datasets, ITU connectivity indicators, and NIST publications on edge and distributed computing to set realistic adoption context.
Next, we pull supporting signals from company filings, earnings call transcripts, and investor presentations to understand spending direction across edge servers, gateways, and edge software stacks. We also review reputable press coverage, standards and whitepapers from industry bodies, and peer reviewed papers to check technical trends like low latency requirements and local AI inference. Where useful, a paid subscription for company financials and news, plus a patent database, is used to validate timelines of product launches and investment focus. These sources are illustrative, and many other public references were also used for data collection, cross-checks, and clarification.
Primary Interviews and Surveys
Primary work focuses on confirming what customers and suppliers count as an edge deployment, and how budgets are split between on-prem edge nodes, micro data centers, and managed edge services. We spoke with a mix of infrastructure providers, software and platform specialists, integrators, and enterprise buyers across IT and telecom, manufacturing, retail, healthcare, and public sector, with coverage across APAC, EMEA, and the Americas to reduce single-region bias.
Distribution of primary research fieldwork respondents
| Company type | Respondent position | Region |
|---|---|---|
| Top tier: 30% | CXOs: 19% | APAC: 44% |
| Mid tier: 51% | Functional/Unit leaders: 35% | EMEA: 31% |
| Smaller Players: 19% | Managers: 46% | Americas: 25% |
Market-Sizing & Forecasting
Sizing is built using top-down and bottom-up logic together, with the top-down path starting from digital infrastructure and edge-ready workload growth and then filtering down using adoption and spending shares that are specific to edge use cases. In practice, the demand pool is reconstructed using indicators such as connected device growth, 5G coverage expansion, latency-sensitive application uptake, edge server and gateway shipment direction, and the shift toward local AI inference at the endpoint.
Those totals are then corroborated through selective bottom-up approximations, where sampled average selling prices are combined with estimated unit volumes for edge nodes, plus reasonableness checks on managed edge service spending by vertical. When data gaps show up, we use conservative ranges from interviews and published public benchmarks, and then tighten the range during review until the assumptions are explainable. Forecasts lean on scenario analysis supported by a simple multivariate regression view, where the main drivers (like enterprise digitization pace, connectivity rollout, and edge software attachment rates) are stress-tested with expert feedback before finalizing yearly values.
Data Validation & Update Cycle
Validation is done through multiple checks that look for mismatches between the model and real market signals, such as sudden jumps that do not align with enterprise IT spending direction or rollout timelines. If a region or component looks off, we re-check inputs, revisit conversion logic, and re-contact selected interviewees to confirm whether a one-time event, a definition issue, or a timing shift is driving the variance.
Before sign-off, the work goes through step-by-step analyst reviews, including assumption review, math consistency checks, and sanity checks against independent indicators. Reports are refreshed annually, and interim updates are made when material events occur that can move adoption or pricing. Right before delivery, a final pass is completed so clients receive the most current view based on the latest available signals.
Mordor Intelligence's Edge Computing Market Size Versus Other Published Estimates
Published market sizes for edge computing can look far apart even when they talk about the same theme, because the boundaries of what counts as edge are not uniform. Differences usually come from what is counted as hardware versus core cloud, how services are treated, and which year and currency basis are used.
Shipment direction for edge servers and gateways, plus adoption signals tied to 5G rollout and low-latency workload growth, are the checks that keep Mordor Intelligence aligned to spending that happens within one network hop of data creation, and not broader cloud infrastructure totals. Other estimates often move because they bundle adjacent spend categories, apply aggressive price and volume ramps, or do not state clear exclusions, which then changes the starting value and the growth curve.
Benchmark comparison
| Source | Market Size | Gaps in Research Methodology |
|---|---|---|
| Mordor Intelligence | USD 257.76 B (2026) | |
| Global Consultancy A | USD 658.10 B (2026) | This figure appears to use a wider revenue pool that can include broader edge-related infrastructure and platform revenues, with limited visible exclusions for core data center or adjacent cloud spend, which can inflate the total. |
| Industry Publication B | USD 25.63 B (2026) | This estimate likely applies a narrower interpretation that emphasizes software and selected services, and may exclude a larger share of edge hardware and micro data center deployments, which pulls the market value down. |
The spread across publishers mainly comes from what is included in the edge boundary and how hardware and services are treated across years. By tying the model to observable deployment and adoption signals, and by keeping inclusions and exclusions explicit, the sizing stays traceable to inputs that a buyer can understand and replicate.


Key Questions Answered in the Report
How large is the edge computing market in 2026?
The edge computing market size reached USD 257.76 billion in 2026 and is projected to climb to USD 479.97 billion by 2031.
Which segment is growing fastest within edge computing?
Autonomous vehicles and drones represent the fastest-growing application, advancing at a 14.11% CAGR as regulatory approvals expand.
Why are services outpacing hardware sales?
Enterprises prefer recurring edge-as-a-service models that bundle compute, orchestration, and security, converting capex into opex and accelerating deployment.
Which region will add the most new spending?
Asia-Pacific is forecast to post a 14.21% CAGR through 2031, powered by China’s 5G roll-out and India’s smart-city investments.
What is the top security challenge in edge deployments?
A broader cyber-attack surface emerges because each edge node can serve as an entry point, necessitating zero-trust architectures and continuous authentication.
Page last updated on:


