E-waste Management Market Size and Share
Market Overview
| Study Period | 2020 - 2031 |
|---|---|
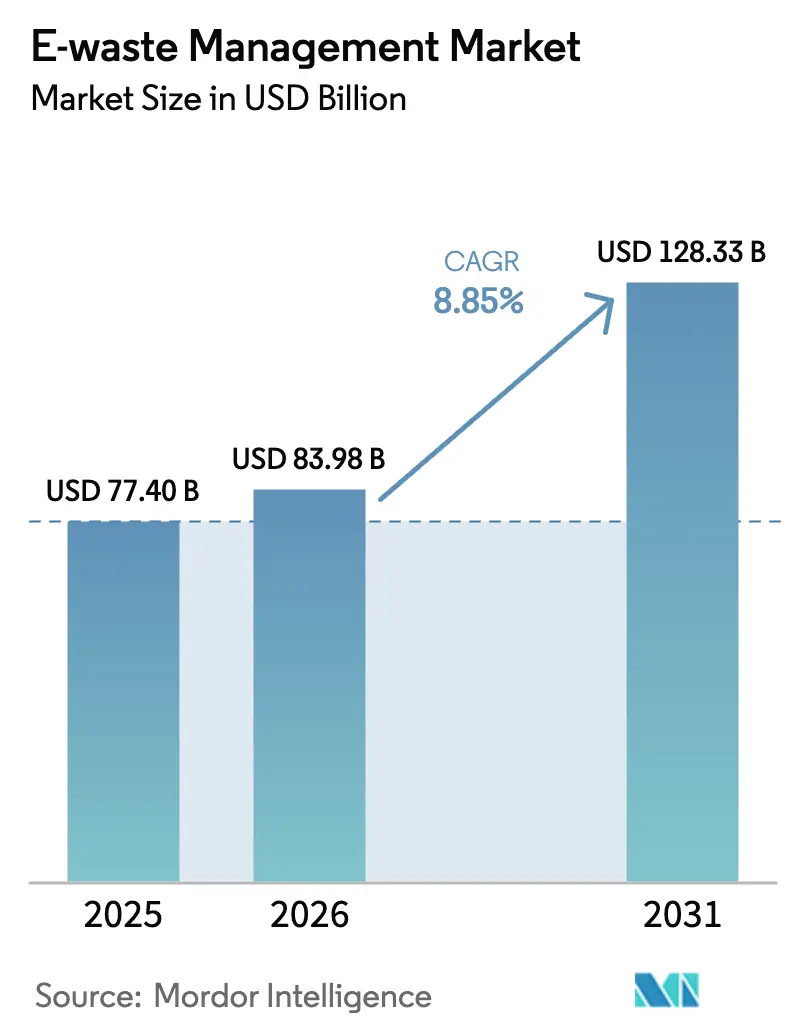
| Market Size (2026) | USD 83.98 Billion |
| Market Size (2031) | USD 128.33 Billion |
| Growth Rate (2026 - 2031) | 8.85% CAGR |
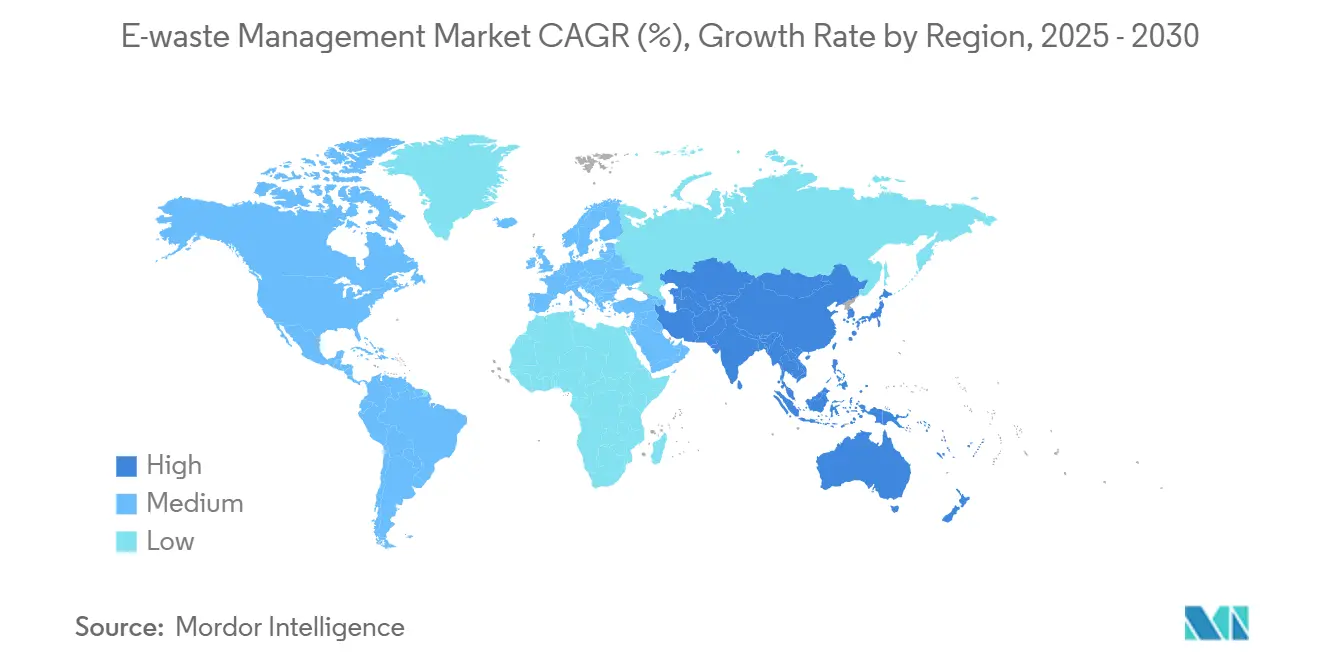
| Fastest Growing Market | Asia Pacific |
| Largest Market | Asia Pacific |
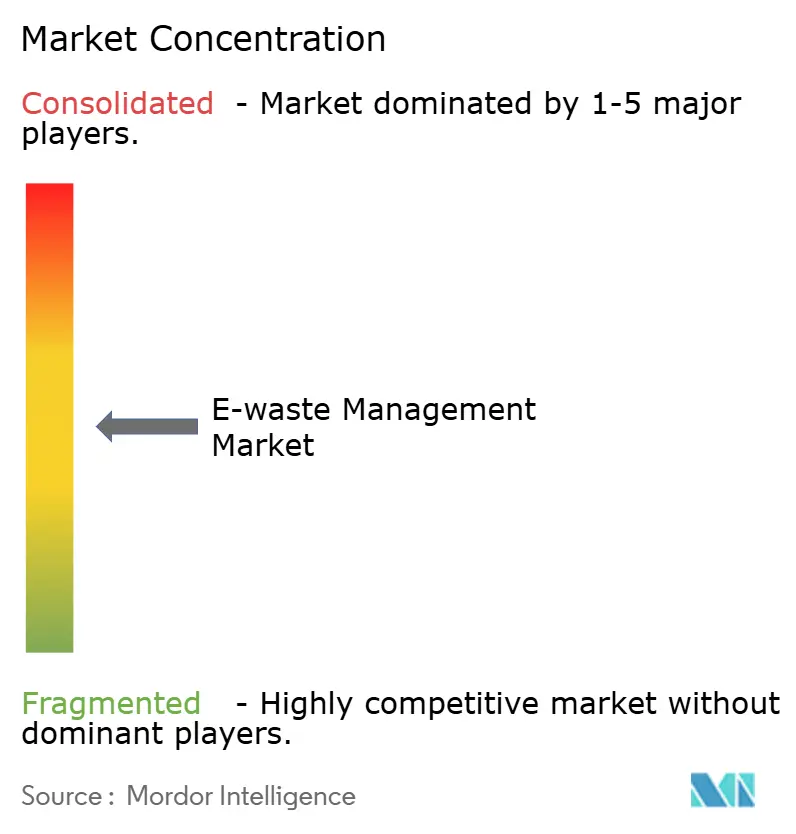
| Market Concentration | Medium |
Major Players
*Disclaimer: Major Players sorted in no particular order Image © Mordor Intelligence. Reuse requires attribution under CC BY 4.0. |
|
E-waste Management Market Analysis by Mordor Intelligence
The E-waste Management Market size is expected to grow from USD 77.4 billion in 2025 to USD 83.98 billion in 2026 and is forecast to reach USD 128.33 billion by 2031 at 8.85% CAGR over 2026-2031. Tighter Prior Informed Consent (PIC) rules under the 2025 Basel Convention amendments, formal extended-producer-responsibility (EPR) mandates that set 70–80% recycling targets in the European Union (EU), India, and China, and more than USD 3 billion in U.S. federal grants for battery-recycling plants are together steering material flows away from informal yards toward licensed processors equipped with hydrometallurgical and pyrometallurgical lines. Formal recyclers are scaling robotics and debond-on-demand adhesives to lower disassembly costs, while hyperscale data-center refresh cycles are releasing high-grade printed-circuit boards rich in precious metals into Organization for Economic Cooperation and Development (OECD) markets. Strong commodity prices for copper, nickel, and lithium sustain urban-mining economics, and new provincial take-back rules in China, Canada, and Brazil are enlarging the legal collection pool, further supporting E-waste management market growth. Competitive rivalry is intensifying as metals refiners such as Umicore and Aurubis integrate upstream into collection and sorting in order to secure feedstock certainty.[1]United Nations Environment Programme (UNEP). "Basel Convention E-Waste Amendments." Accessed March 2026. https://www.unep.org.
Key Report Takeaways
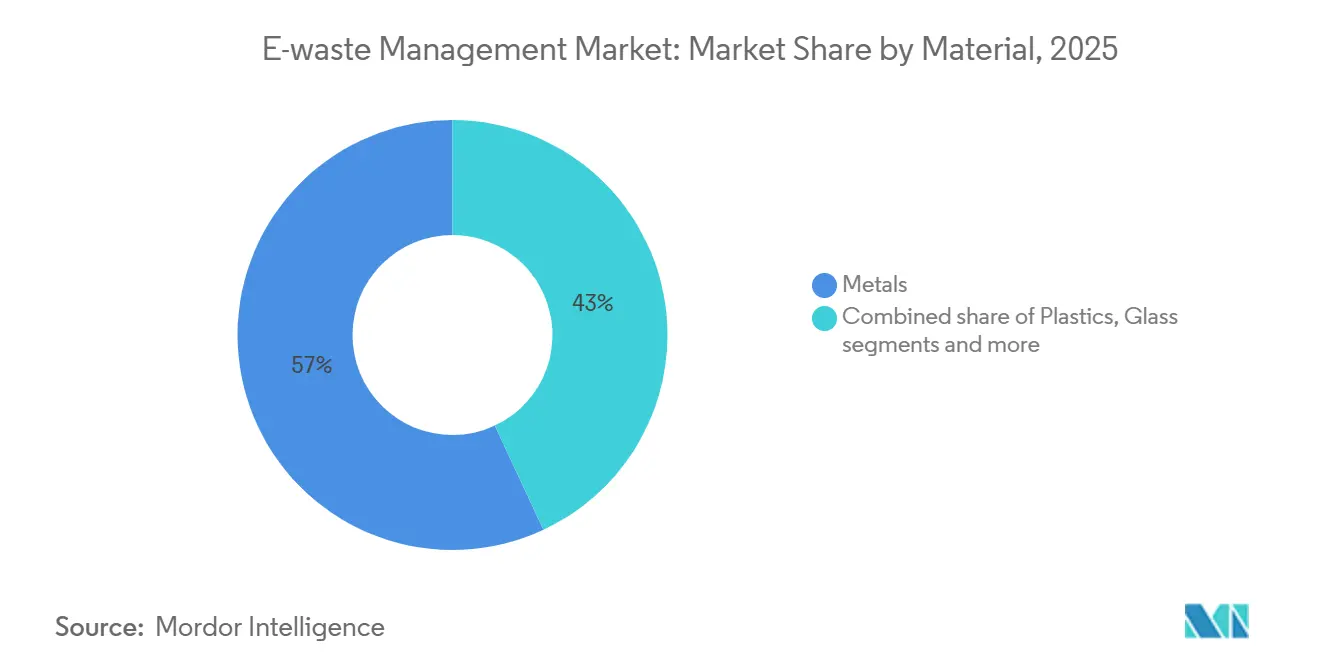
- By material, metals led with 56.96% of the e-waste management market share in 2025. Metals are advancing at the fastest 10.45% CAGR through 2031.
- By source, consumer electronics commanded 37.75% revenue share of the e-waste management market size in 2025. Electric-vehicle batteries are the quickest-rising source segment at a 12.35% CAGR to 2031.
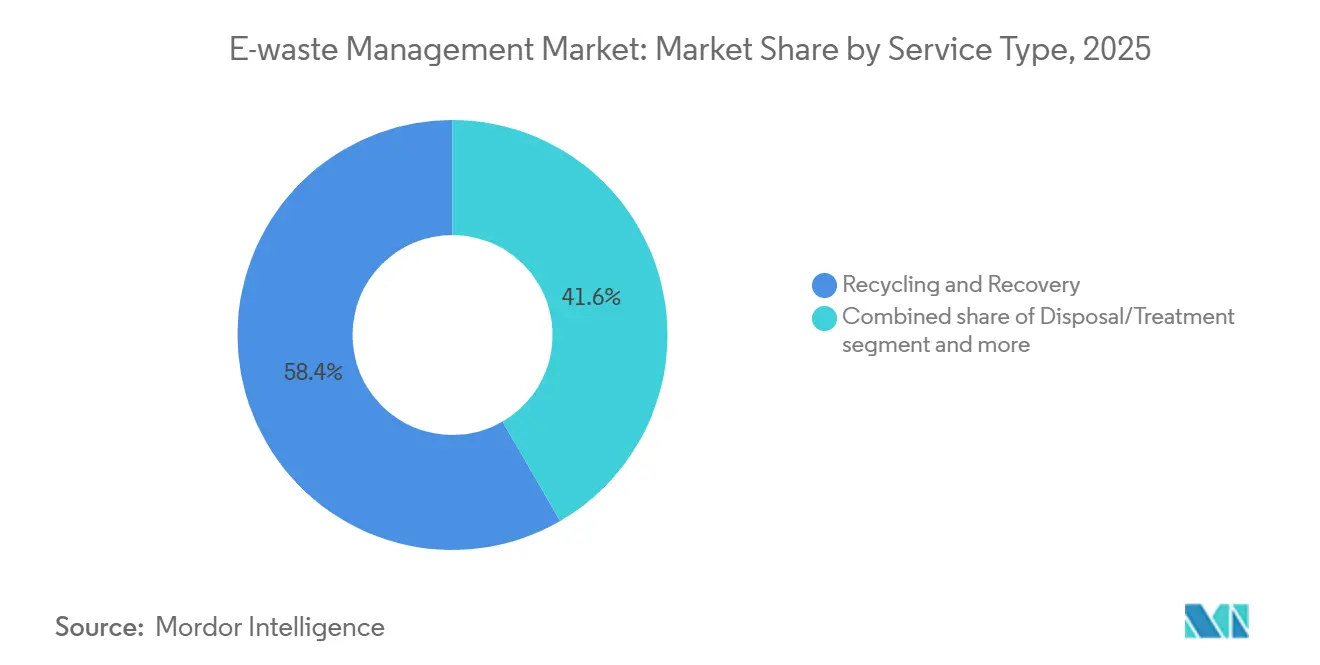
- By service type, recycling and recovery services captured 58.35% of 2025 revenue in the e-waste management market share in 2025. The Hydrometallurgical Process is set to expand at a 10.4% CAGR up to 2031.
- By geography, Asia-Pacific commanded 44.45% revenue share of the e-waste management market size in 2025 and is set to expand at a 9.5% CAGR up to 2031.
Note: Market size and forecast figures in this report are generated using Mordor Intelligence’s proprietary estimation framework, updated with the latest available data and insights as of January 2026.
Global E-waste Management Market Trends and Insights
Drivers Impact Analysis*
| Drivers | (~) % Impact on CAGR Forecast | Geographic Relevance | Impact Timeline |
|---|---|---|---|
| Mandatory 70–80% EPR Recycling Targets & Real-time Certificate Trading in EU, India, China | 2.1% | EU, India, China; spillover effects in ASEAN and Latin America | Medium term (2-4 years) |
| Tightened 2025 Basel Convention E-Waste Amendments Mandating Prior-Informed Consent Globally | 1.8% | Global, with acute enforcement in EU, North America, and select Asia-Pacific jurisdictions | Medium term (2-4 years) |
| U.S. IIJA & BIL Funding Waves Fueling USD 3 Billion+ Battery-Recycling Capacity Build-out | 1.5% | North America, with secondary benefits in allied supply chains (Japan, South Korea, Australia) | Short term (≤ 2 years) |
| Debond-On-Demand Adhesives & Modular Design Standards Slashing Disassembly Costs | 1.2% | Global, with early adoption in EU and North America driven by right-to-repair legislation | Long term (≥ 4 years) |
| EU WEEE Directive Revision Drafts Introducing CRM-Focused Recovery Targets & Separate PV Stream | 1.0% | EU, with potential replication in UK, Switzerland, and Norway | Medium term (2-4 years) |
| Data-Center Server Decommissioning for AI Workloads Releasing High-Grade e-Scrap in OECD | 0.9% | North America, Western Europe, select Asia-Pacific hubs (Singapore, Tokyo, Sydney) | Short term (≤ 2 years) |
| Source: Mordor Intelligence | |||
Mandatory 70–80% EPR Recycling Targets & Real-time Certificate Trading in EU, India, China
The EU Waste Electrical and Electronic Equipment (WEEE) Directive, India’s E-waste Management Rules 2022, and China’s subsidy scheme now oblige producers to meet 70–80% collection ratios by weight. Real-time digital portals in Brussels, New Delhi, and Beijing let manufacturers buy electronic certificates from recyclers, converting compliance into a tradable asset and injecting liquidity into the E-waste management market. India’s portal registered 1,200 Producer-Responsibility Organizations (PROs) by May 2024, trimming paperwork costs 20-30% and driving higher formal collections. China disbursed USD 390 million in 2025 to licensed dismantlers, raising throughput and depressing informal tonnage. The combined policies accelerate capital spending on automated plants and stimulate secondary-material supply chains.[2]European Commission, “Evaluation of the WEEE Directive 2025,” europeancommission.europa.eu
Tightened 2025 Basel Convention E-waste Amendments Mandating Prior-Informed Consent Globally
The January 2025 Basel Convention revisions recategorize electronic scrap under hazardous (A1181) and non-hazardous (Y49) codes, forcing exporters to secure written clearance before shipment. Global transboundary flows fell 12% in the first half of 2025 versus 2024 as compliance paperwork extended transit by 4-8 weeks and raised freight bills 15-25%. Licensed processors in the EU and North America gained feedstock that previously leaked to informal hubs, lifting throughput rates and supporting the E-waste management market. Smaller brokers exited the trade due to the administrative load, prompting consolidation among large logistics providers. Over the medium term, the rule is expected to cement formal supply chains while shrinking the cost advantage of unregulated operators.
U.S. IIJA & BIL Funding Waves Fueling USD 3 Billion Battery-Recycling Capacity Build-out
The United States Department of Energy (DOE) committed USD 3 billion of Infrastructure Investment and Jobs Act (IIJA) and Bipartisan Infrastructure Law (BIL) funds to domestic battery-materials processing. Three grant rounds between 2022 and 2024 handed USD 335 million to projects led by Redwood Materials, Ascend Elements, and American Battery Technology, covering shredding, hydrometallurgical refining, and precursor-cathode synthesis. Redwood’s USD 3.5 billion Nevada complex came online in February 2025, capable of treating 100 GWh of spent lithium-ion cells each year. New capacity shortens reverse-logistics hauls, cuts carbon footprints, and ensures critical-mineral security. As plants ramp up, hydrometallurgy’s share in the E-waste management market is set to widen.
Debond-On-Demand Adhesives & Modular Design Standards Slashing Disassembly Costs
Adhesives that release under light or moderate heat shrink manual tear-down time by 30-40%, slashing labor costs at refurbishers and recyclers. Standards bodies, the Institute of Electrical and Electronics Engineers (IEEE) and International Electrotechnical Commission (IEC), draft modular guidelines that call for snap-fit housings and coded polymer grades, enabling robotic separation steps. Early adopters such as Fairphone and Framework extend device life to 8–10 years through module swaps, delaying end-of-life volumes. Right-to-repair laws in the EU and California propel adoption by penalizing hard-to-disassemble products. Over the long term, easier teardown will raise component recovery rates and enhance the E-waste management market’s profitability.[3] Institute of Electrical and Electronics Engineers, “Modular Electronics Design Standards in Draft,” ieee.org
Restraints Impact Analysis*
| Restraints | (~) % Impact on CAGR Forecast | Geographic Relevance | Impact Timeline |
|---|---|---|---|
| Entrenched Informal Dismantling Ecosystems in South & Southeast Asia Skewing Material Flows | -1.4% | South Asia (India, Pakistan, Bangladesh), Southeast Asia (Vietnam, Indonesia, Philippines) | Medium term (2-4 years) |
| 2025 Basel PIC Rules Raising Logistics & Compliance Costs for Cross-Border e-Scrap Shipments | -0.8% | Global, with an acute impact on exporters in OECD and importers in developing economies | Short term (≤ 2 years) |
| High-Adhesive, Miniaturized Consumer Devices Breaching New Contamination Thresholds for Plastics | -0.6% | Global, with heightened challenges in high-volume consumer electronics markets (China, India, U.S.) | Medium term (2-4 years) |
| Solid-State Battery Chemistries Lacking Industrial Recycling Routes & Safety Protocols | -0.5% | Global, concentrated in regions with advanced battery R&D (Japan, South Korea, U.S., EU) | Long term (≥ 4 years) |
| Source: Mordor Intelligence | |||
Entrenched Informal Dismantling Ecosystems in South & Southeast Asia Skewing Material Flows
Informal recyclers in India, Pakistan, Bangladesh, Vietnam, Indonesia, and the Philippines still treat 70-80% of discarded electronics in these countries, relying on open-burning and acid-leaching methods that expose laborers to toxic metals. Informal operators undercut licensed facilities by 20-30% because they skip environmental controls and taxes, diverting feedstock away from formal plants. Child involvement persists; the World Health Organization (WHO) estimates 18 million minors work in informal waste globally, many in e-waste. Enforcement of new EPR portals is uneven outside metro areas, allowing illegal yards to survive. Such leakage curbs collection for certified processors and drags on the E-waste management market revenue.
2025 Basel PIC Rules Raising Logistics & Compliance Costs for Cross-border E-scrap Shipments
Mandatory PIC documentation lengthens shipping lead times by up to 8 weeks and inflates paperwork and storage fees 15-25%, squeezing margins for small exporters. Several brokers exited the market in 2025, and developing-nation regulators struggle to clear permits within the 60-day Basel window, causing backlogs. Delays increase demurrage bills and raise the temptation for illegal dumping. The bottleneck temporarily depresses formal trade volumes and compresses recycler profitability in the E-waste management market. Over time, scale efficiencies may soften impacts, but near-term pressure remains.
*Our forecasts treat driver/restraint impacts as directional, not additive. The impact forecasts reflect baseline growth, mix effects, and variable interactions.
Segment Analysis
By Material: Metals, Anchor Value Recovery Economics
Metals secured 56.96% of the E-waste management market share in 2025, reflecting their superior intrinsic value relative to plastics and glass. Copper yields from end-of-life electronics now meet 15% of refined demand, and gold and palladium extracted from printed-circuit boards command premium spot prices. Aurubis processed more than 1 million t of electronic scrap at its Lünen and Hamburg complexes in 2025, recovering copper, gold, and silver for semiconductor and wire clients. Rare-earth magnets recovered from hard-disk drives add neodymium and dysprosium to the supply pool as China narrows export quotas.
Urban-mining economics benefit from persistent high LME (London Metal Exchange) prices and declining average ore grades in primary mines, which shift capital toward recycling plants. Hydrometallurgical leaching lines at Umicore’s Hoboken site uplift lithium-ion black-mass recovery rates to 95% for lithium, cobalt, and nickel. ISO 14001 and R2v3 certifications have become procurement prerequisites, funneling high-grade feedstock into certified smelters. As critical-material quotas under the EU Critical Raw Materials Act firm up, metal recovery is projected to expand at a 10.45% CAGR, further enlarging the E-waste management market size for metals.


By Source: Consumer Electronics Lead, EV Batteries Surge
Consumer electronics generated 37.75% of 2025 global e-scrap tonnage, making it the largest source within the E-waste management market. Short design cycles of smartphones, laptops, and tablets drive continual discard flows, and right-to-repair policies are only slowly extending device life. Data-center hardware refreshing for AI accelerators pushes high-grade server boards into OECD recycling pools, raising precious-metal yields. Home appliances add heavy tonnage but contribute less value per kilogram due to lower metal content.
Electric-vehicle batteries represent the fastest-growing source at a 12.35% CAGR through 2030. DOE modeling shows that around 1 million t of used packs will require treatment annually by the end of the decade. Redwood Materials’ Nevada campus processes 100 GWh of spent packs each year, closing the loop by supplying copper foil and cathode powders back to Panasonic and Ford. PV modules and medical devices remain niche streams today, but will climb as solar arrays age and healthcare digitizes. The shifting mix bolsters black-mass volumes and underpins future E-waste management market gains.
By Service Type: Hydrometallurgy Gains Ground
Recycling and recovery services captured 58.35% of 2025 revenue within the E-waste management market, underscoring regulators’ preference for material reclamation over landfill. Within this bucket, hydrometallurgy is on track for a 10.4% CAGR to 2031 due to its ability to recover lithium and cobalt at purities above 90%. Umicore’s hybrid flow pyro pre-treatment, followed by aqueous leaching, yields battery-grade lithium carbonate and nickel sulfate while reducing energy intensity by half compared with traditional smelting.
Mechanical shredding and density-based separation remain universal front-end steps, supplying feed to hydrometallurgical or smelting lines. Boliden’s Rönnskär smelter melts 300,000 t of circuit boards a year to reclaim copper, gold, and indium via slag refining. Collection and logistics, though smaller in revenue, enable regulated flows; stricter Basel PIC compliance is elevating demand for licensed carriers. Biometallurgy using bacteria to leach metals stays at pilot scale but may grow after 2028 if yields improve. Together, evolving process routes fortify the E-waste management market structure.
Geography Analysis
Asia-Pacific held 44.45% of the E-waste management market share in 2025 and is forecast to rise at a 9.5% CAGR through 2031. China awarded USD 390 million of 2025 dismantling subsidies that pushed informal operators toward licensing and doubled annual throughput in its top ten cities. India’s live EPR-certificate portal lets producers trade obligations instantly, accelerating formal collections and imposing penalties on non-compliant brands. Japan’s Home Appliance Recycling Act and South Korea’s producer-take-back scheme both exceed 70% collection, creating a mature flow for high-value metals. Emerging ASEAN economies are drafting national frameworks but still struggle with enforcement; informal yards persist in rural belts.
Europe ranked second in 2025, buoyed by the WEEE Directive and the Basel PIC clampdown that keeps material inside the bloc. Yet only three member states met the 65% collection target in 2023, and the EU-wide average stood at 37.5%. Brussels now proposes tougher fines and CRM-recovery quotas that could lift regional hydrometallurgical capacity. Market leaders Veolia, ALBA, and Stena Metall are buying smaller firms to secure feedstock as exports narrow. Separate PV obligations under Directive 2024/884 will unlock new glass-to-glass lines, diversifying revenue streams.
North America is undergoing a capacity surge, anchored by USD 3 billion of IIJA and BIL grants. Redwood Materials, Ascend Elements, and American Battery Technology opened or expanded sites, and Li-Cycle secured Glencore offtake for its black mass. State EPR mandates in California, New York, and Washington plus Canada’s provincial rules encourage large collectors such as ERI to standardize processes across borders. South America, the Middle East, and Africa remain nascent but Brazil and South Africa are drafting EPR bills that could seed future growth for the E-waste management market.[4]Central Pollution Control Board, “Extended Producer Responsibility Portal Statistics 2025,” cpcb.nic.in
Mordor Intelligence provides coverage of the e-waste management market across other key regional markets, including North America, Europe, and Asia, each with their regulatory frameworks and demand patterns. Detailed country-level analysis extends to India and United Arab Emirates incorporating local coverage and market participation, as required.

Competitive Landscape
The E-waste management market is moderately fragmented. Veolia Environnement and ALBA Group use municipal waste contracts to secure household electronics, then channel feedstock to in-house processing lines. Electronics-only specialists like Electronic Recyclers International (ERI) and TES differentiate by bundling secure data-erasure and refurbishment services that satisfy corporate ESG (environmental, social, governance) audits. Metals refiners Umicore, Aurubis, and Boliden integrate backward into collection hubs to guarantee supply for smelters facing falling ore grades.
Strategic moves between 2024 and 2025 centered on capacity expansions and vertical integration. Veolia bought a 70% stake in a Polish recycler, adding 25,000 t of throughput, while Umicore invested USD 160 million to quintuple Hoboken lithium-ion capacity. TES launched a Singapore data-center decommissioning hub to capture GPU server boards, and Sims Lifecycle Services automated precious-metal sort lines in the United States. Li-Cycle partnered with Glencore for European black-mass refining after pausing its Rochester Hub, highlighting execution risks in greenfield megaprojects.
Technology disruption is rising. Apple’s Daisy robot strips 200 iPhones per hour, and AI-guided vision systems are spreading across European sort lines. Certification under R2v3 or e-Stewards has become a bidding requirement for municipal contracts, and processors lacking audits are losing share. White-space arenas solid-state battery recycling, PV panel take-back, and rare-earth extraction invite startups with novel chemistries. Overall, rivalry is expected to intensify as policy locks more waste inside domestic borders, expanding the addressable E-waste management market.
E-waste Management Industry Leaders
-
Veolia Environnement SA
-
TES – Sustainable IT Lifecycle Services
-
Sims Lifecycle Services
-
Umicore SA
-
Electronic Recyclers International (ERI)
- *Disclaimer: Major Players sorted in no particular order

Recent Industry Developments
- March 2026: Metallium Ltd. officially transitioned its advanced e-waste metal recovery technology to commercial operations by launching an 8,000-ton capacity processing facility in Houston, Texas, backed by supply agreements with giants like Glencore.
- December 2025: Japan's Mitsubishi Materials Corporation (MMC) announced the strategic acquisition of shares in Elemental USA E-Waste & ITAD, Inc., a subsidiary of global urban-mining group Elemental Holding SA.
- February 2025: Redwood Materials finished Phase 1 of its USD 3.5 billion Nevada campus, adding 100 GWh of battery-recycling capacity and outputting anode copper foil and cathode powders for Toyota and Ford supply contracts.
- January 2025: Basel Convention e-waste amendments requiring global PIC documentation took effect, redirecting 15–20% of flows into OECD facilities.


Research Methodology Framework and Report Scope
Market Definitions and Key Coverage
Our study defines the global e-waste management market as the revenue earned from formal collection, transportation, refurbishment, material recovery, and environmentally sound disposal of discarded electrical and electronic equipment across all end-use sectors. According to Mordor Intelligence, this market is valued at USD 77.40 billion in 2025.
We exclude hazardous industrial residues that lack electronic circuitry, construction and demolition waste, and wholly informal backyard recycling activities.
Segmentation Overview
-
By Material
- Metals
- Plastics
- Glass
- Others
-
By Source
- IT & Telecommunication Equipment
- Consumer Electronics
- Household Appliances
- Medical Equipment
- Industrial Equipment
- EV Batteries
- Solar PV Panels
- Others (Agricultural Equipment, Curb-side waste, construction, etc.)
-
By Service Type
- Collection, Trasportation & Sorting
-
Disposal/ Treatment
- Refurbishment & Reuse
- Landfill/ Incineration
-
Recycling & Recovery
- Mechanical Separation
- Hydrometallurgical Process
- Pyrometallurgical Process
- Biometallurgical Process
-
By Geography
-
North America
- United States
- Canada
- Mexico
-
South America
- Brazil
- Argentina
- Chile
- Rest of South America
-
Europe
- United Kingdom
- Germany
- France
- Italy
- Spain
- BENELUX (Belgium, Netherlands, and Luxembourg)
- NORDICS (Denmark, Finland, Iceland, Norway, and Sweden)
- Rest of Europe
-
Middle East and Africa
- Saudi Arabia
- United Arab Emirates
- Qatar
- Kuwait
- Turkey
- Egypt
- South Africa
- Nigeria
- Rest of Middle East and Africa
-
Asia-Pacific
- China
- India
- Japan
- South Korea
- Australia
- ASEAN (Indonesia, Thailand, Philippines, Malaysia, Vietnam)
- Rest of Asia-Pacific
-
North America
Detailed Research Methodology and Data Validation
Primary Research
We interviewed licensed recyclers in China and India, compliance officers at producer-responsibility organizations in the European Union, and municipal collection managers across North America. Insights on real collection ratios, processing yields, gate fees, and upcoming regulatory targets allowed us to refine assumptions derived from secondary work.
Desk Research
We begin by mapping device stocks and waste flows using open datasets such as the United Nations University Global E-waste Monitor, the Global E-waste Statistics Partnership, Eurostat WEEE registers, and US EPA disposition reports. Trade and pricing inputs are drawn from customs records accessed through Volza, London Metal Exchange spot averages, and recent filings of listed recyclers. These sources anchor generation volumes and material values, which are aligned to the segmentation outlined in Mordor's Table of Contents. Paid resources like D&B Hoovers and Dow Jones Factiva help validate company footprints and capacity additions. The sources noted are illustrative; many other publications supported data collection, validation, and clarification.
Market-Sizing & Forecasting
A combined top-down, bottom-up approach starts with national e-waste generation that we reconstruct through device stock, replacement cycle, and GDP-per-capita elasticities. Results are cross-checked with sampled processor revenues and average service prices. Key variables like formal collection share, precious-metal recovery yield, average fee per ton, statutory recycling targets, and spot copper price drive our model. We apply multivariate regression to forecast 2025-2030 outcomes, and gaps for data-poor countries are bridged with regional analogs verified by experts.
Data Validation & Update Cycle
Our outputs undergo variance checks against historical series, metal price movements, and public company disclosures before senior review. Reports refresh every year, and material regulatory shifts trigger interim updates; a final analyst sweep ensures clients receive the most current view.
Why Mordor's E-waste Management Baseline Commands Decision Trust
We observe that published 2025 values range widely: USD 65.9 billion, USD 81.3 billion, and USD 85.1 billion.
Divergence usually reflects mixed inclusion of informal flows, contrasting service price decks, and differing currency conversion dates.
Benchmark comparison
| Market Size | Anonymized source | Primary gap driver |
|---|---|---|
| USD 77.40 B | Mordor Intelligence | - |
| USD 65.9 B | Global Consultancy A | Excludes refurbishment revenue, conservative scrap pricing |
| USD 81.3 B | Industry Association B | Relies on 2024 data without policy refresh |
| USD 85.1 B | Research Boutique C | Adds informal backyard activity and optimistic metal prices |
Our disciplined scope, verified service pricing, and annual refresh cadence give decision-makers a balanced, transparent baseline that is traceable to clear variables and repeatable steps.


Key Questions Answered in the Report
How large will global E-waste volumes be by 2031?
The E-waste management market size is forecast to reach USD 128.33 billion by 2031, supported by an 8.85% CAGR driven by stricter regulations and battery-recycling demand.
Which region contributes the most to formal recycling revenue?
Asia-Pacific held 44.45% of global revenue in 2025 and is expanding at 9.5% CAGR through 2030 on the back of subsidy programs in China and India.
What material offers the highest economic return in recycled electronics?
Metals dominate, capturing 56.96% of 2025 market share, with copper, gold, and palladium delivering the strongest revenue per kilogram.
Why is hydrometallurgy gaining favor over smelting?
Hydrometallurgical processes recover lithium, cobalt, and nickel at over-90% purity while using lower temperatures, which cuts energy use and carbon emissions.
How fast is the EV-battery waste stream growing?
Operators deploy AI-powered vision systems and robotics that now achieve 83% sorting accuracy, lowering manual labor and boosting material purity.
Page last updated on:


