Waste Management Equipment Market Size and Share
Market Overview
| Study Period | 2020 - 2031 |
|---|---|
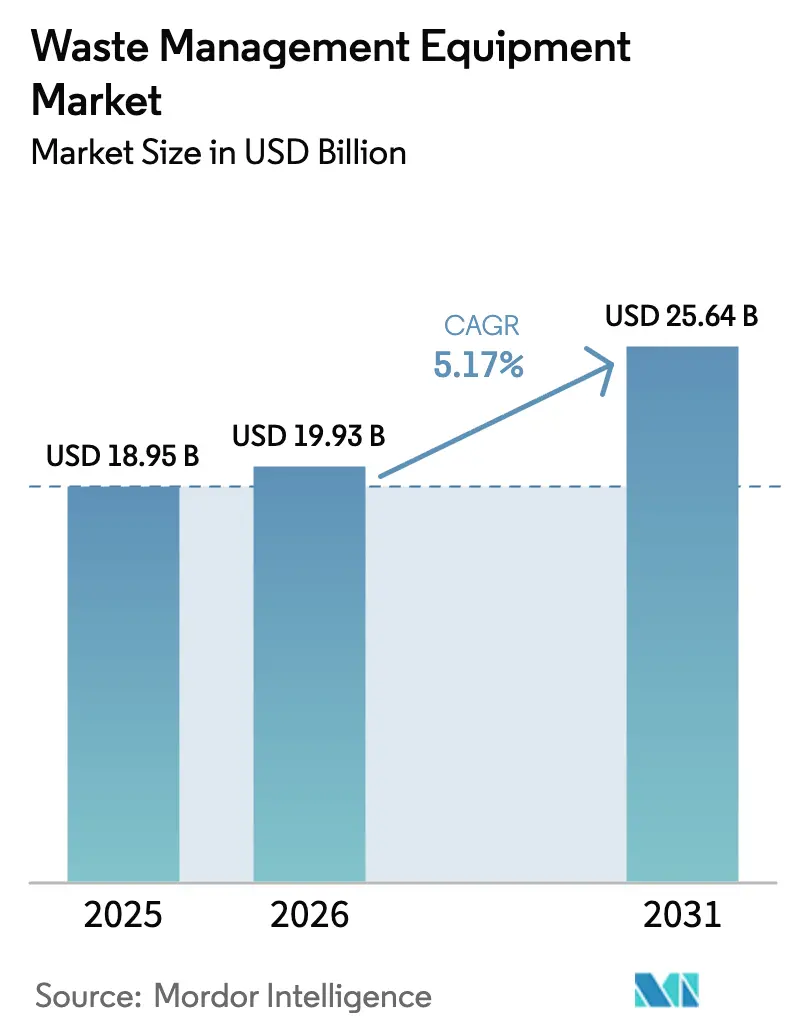
| Market Size (2026) | USD 19.93 Billion |
| Market Size (2031) | USD 25.64 Billion |
| Growth Rate (2026 - 2031) | 5.17% CAGR |
| Fastest Growing Market | Middle East and Africa |
| Largest Market | Asia Pacific |
| Market Concentration | Low |
Major Players *Disclaimer: Major Players sorted in no particular order Image © Mordor Intelligence. Reuse requires attribution under CC BY 4.0. | |
Waste Management Equipment Market Analysis by Mordor Intelligence
The Waste Management Equipment Market size is expected to increase from USD 18.95 billion in 2025 to USD 19.93 billion in 2026 and reach USD 25.64 billion by 2031, growing at a CAGR of 5.17% over 2026-2031.
Producers’ compliance costs under Extended Producer Responsibility programs, escalating landfill levies, and carbon-pricing schemes are funnelling capital toward technologically advanced material-recovery facilities capable of sorting 15 polymer types at conveyor speeds above 3 m/s.[1]European Commission, “Packaging and Packaging Waste Regulation,” EUROPA.eu Higher disposal taxes in the United Kingdom, Sweden, and the Netherlands are pushing waste generators toward mechanical-biological treatment and pyrolysis, while corporate zero-waste-to-landfill pledges from global retailers are accelerating on-site compactor and baler installations. At the same time, AI-enabled hyperspectral sorters and IoT-connected compactors are embedding predictive-maintenance analytics across fleets, lowering downtime and fuel use. Capital spending is at its highest in Asia-Pacific, where government sanitation grants and the upscaling of industrial-scale battery manufacturing underpin orders for hazardous-waste shredders and rotary-kiln incinerators.
Key Report Takeaways
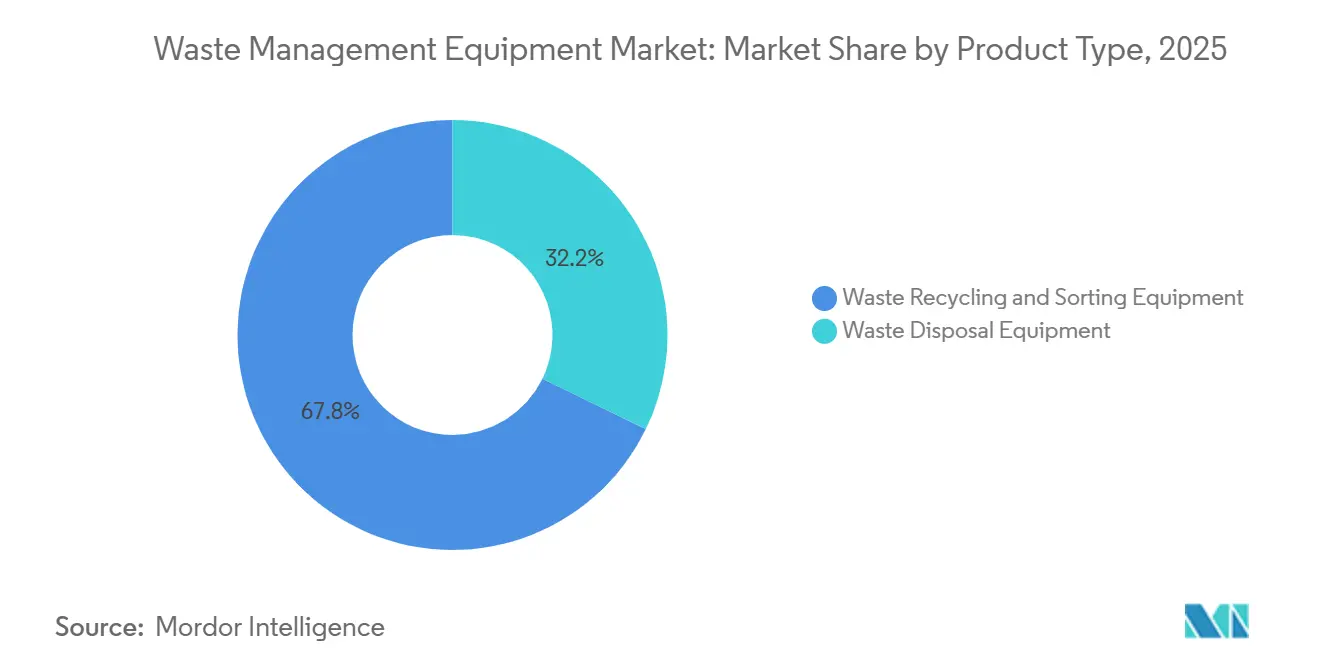
- By product type, waste recycling & sorting equipment led with 67.8% of 2025 revenue, while waste disposal equipment is projected to expand at a 7.05% CAGR through 2031.
- By waste type, non-hazardous streams accounted for 91.05% of 2025 tonnage; hazardous-waste handling equipment is forecast to grow at a 6.41% CAGR over 2026-2031.
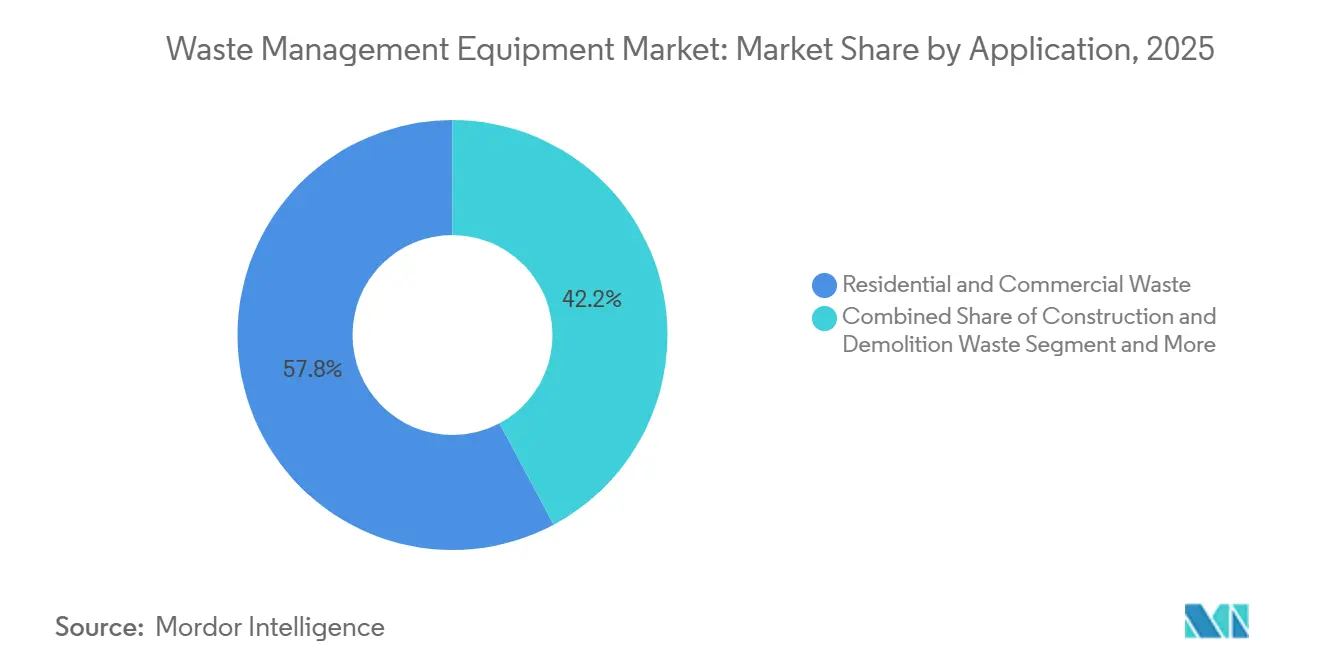
- By application, residential & commercial waste accounted for 57.8% of 2025 demand, whereas industrial waste equipment is set to record the fastest 6.12% CAGR to 2031.
- By technology, semi-automated systems accounted for 29.5% of 2025 deployments; fully automated IoT-enabled platforms will post a 6.97% CAGR through 2031.
- By geography, Asia-Pacific commanded 45.65% of 2025 revenue, but the Middle East & Africa region is poised for the highest 6.48% CAGR during 2026-2031.
- Veolia, SUEZ, Waste Management Inc., TOMRA, and Republic Services collectively held 28% of the installed capacity in the waste management equipment market in 2025.
Note: Market size and forecast figures in this report are generated using Mordor Intelligence’s proprietary estimation framework, updated with the latest available data and insights as of 2026.
Global Waste Management Equipment Market Trends and Insights
Drivers Impact Analysis*
| Drivers | (~) % Impact on CAGR Forecast | Geographic Relevance | Impact Timeline |
|---|---|---|---|
| Mandatory EPR schemes expansion (EU, India, Canada) | +1.2% | EU core, India urban clusters, Ontario & Quebec | Medium term (2-4 years) |
| AI-enabled hyperspectral optical sorters retrofit cycle | +1.1% | APAC core, spill-over to MEA and Latin America | Long term (≥ 4 years) |
| Escalating landfill taxes & carbon-pricing on incineration | +0.9% | UK, Netherlands, Sweden, select US states | Short term (≤ 2 years) |
| Circular-economy infrastructure funds backing EaaS models | +0.8% | EU, North America, with pilot programs in APAC | Medium term (2-4 years) |
| Zero-waste-to-landfill corporate commitments | +0.7% | Global, concentrated in North America & Western Europe | Medium term (2-4 years) |
| ISSB/CSRD audit-grade waste-data compliance push | +0.6% | EU mandatory, North America voluntary adoption, APAC emerging | Short term (≤ 2 years) |
| Source: Mordor Intelligence | |||


Mandatory EPR Schemes Expansion Drives Equipment Upgrades
Packaging regulations in the European Union, India, and Canada now oblige brand owners to fund collection and sorting, channeling fresh capital toward automated material-recovery lines. The EU Packaging and Packaging Waste Regulation, provisionally applied since 2025, requires converters to achieve 65% plastic recycling by 2030, spurring the installation of near-infrared units that can recognize black PET. India’s Central Pollution Control Board reported that only 34% of producers met 2023-2024 targets, so non-compliance fees are being redirected to municipal MRF upgrades in Bengaluru, Pune, and Ahmedabad.[2]Central Pollution Control Board India, “EPR Compliance Status Report 2024,” cpcb.nic.in Ontario’s Blue Box rule shifted residential packaging costs to producers in 2025, unlocking USD 100 million annually for balers and sorters at the Brampton hub.
AI-Enabled Hyperspectral Optical-Sorter Retrofit Cycle Gains Momentum
Hyperspectral cameras analyse 100-plus wavelength bands, allowing MRFs to double throughput compared with legacy dual-wavelength units. TOMRA’s AUTOSORT CYBOT hit 98% polypropylene purity while trimming manual labor by 60% at Veolia’s Lyon plant in 2026. The U.S. Department of Energy granted USD 14 million to build open-source spectral libraries for flexible films.[3]U.S. Department of Energy, “Plastics Innovation Challenge Awards,” energy.gov China added hyperspectral sorters to its 2025 encouraged-equipment catalog, awarding 15% tax rebates that drove 47 installations in Guangdong, Zhejiang, and Jiangsu.
Escalating Landfill Taxes and Carbon Pricing Shift Disposal Economics
The United Kingdom lifted its landfill tax to USD 129 per tonne in 2024, making mechanical-biological treatment economically attractive for low-calorific waste. EU incinerators entered the Emissions Trading System in 2026 at EUR 85 per tonne of CO₂, adding EUR 0.17 per kg of waste combusted. Sweden’s waste-to-energy operators now retrofit carbon-capture units to curb allowance costs, while the Netherlands overlays a national incineration levy that already forced three aging plants offline.
Circular-economy infrastructure funds backing EaaS models
Circular-economy infrastructure funds are heavily backing Equipment-as-a-Service (EaaS) models, fundamentally accelerating growth across the waste management equipment market. By injecting green capital into equipment providers, these funds enable flexible, subscription-based leasing arrangements for municipalities and industrial users. This financial structure eliminates prohibitive upfront capital expenditures, driving rapid adoption of high-tech sorting, recycling, and electrified collection machinery. EaaS contracts ensure consistent equipment upgrades, high utilization, and comprehensive maintenance without straining corporate budgets.
Restraints Impact Analysis*
| Restraints | (~) % Impact on CAGR Forecast | Geographic Relevance | Impact Timeline |
|---|---|---|---|
| Secondary commodity-price volatility (for example OCC -35% YoY) | -0.8% | Global, acute in North America & Europe | Short term (≤ 2 years) |
| High CAPEX & permitting for pyrolysis/gasification units | -0.6% | OECD markets, emerging in APAC | Medium term (2-4 years) |
| Skilled mechatronics workforce shortage | -0.5% | Global, most severe in India, Brazil, and Eastern Europe | Long term (≥ 4 years) |
| Data-sovereignty & cybersecurity hurdles for cloud platforms | -0.4% | China, EU (NIS2 compliance), with spillover to other regions | Medium term (2-4 years) |
| Source: Mordor Intelligence | |||
Secondary Commodity-Price Volatility Compresses Recycler Margins
Old Corrugated Cardboard prices in the United States slid 35% to USD 62 per tonne by March 2025 as containerboard overcapacity in Southeast Asia depressed demand, forcing several U.S. MRFs into negative EBITDA and delaying USD 85 million of automation upgrades. Mixed-plastic bale prices in Europe fell 28% in early 2025 when virgin polyethylene reached price parity, stalling robotic-sorter orders. Although aluminum scrap held at USD 1,650 per tonne, that metal’s low tonnage share limits its balancing effect on recycler revenue.
High CAPEX and Permitting Hurdles Constrain Thermal-Treatment Adoption
A 50,000 t-per-year pyrolysis plant costs USD 30–50 million, and the United States, as well as the European Union, requires best-available scrubbers and continuous emissions monitoring. Germany’s average 32-month approval timeline under its Federal Immission Control Act has slowed deployment, despite modern units emitting below 0.1 ng/m³ of dioxins. Japan approved only three new gasification projects in 2025 after post-earthquake seismic upgrades raised capital needs.[4]Ministry of the Environment Japan, “Gasification Project Approvals 2025,” env.go.jp Reactors also require low-PVC, sub-2% moisture feedstock, adding USD 5–8 million for upstream washing and density-separation equipment.
*Our forecasts treat driver/restraint impacts as directional, not additive. The impact forecasts reflect baseline growth, mix effects, and variable interactions.
Segment Analysis
By Product Type: Waste Recycling & Sorting Equipment Commands Installed Base
Waste recycling & sorting equipment captured 67.8% of the 2025 waste management equipment market share, reflecting the global fleet of 12,000 material-recovery facilities that deploy optical sorters, eddy-current separators, and robotic picking arms. Demand is concentrated in jurisdictions that mandate 65%–70% recycling rates, such as the European Union and South Korea, which require high-purity outputs for bottle-to-bottle loops. However, the waste disposal equipment line-up gasification systems, compactors, and balers is on a faster 7.05% CAGR trajectory as coal-dependent economies replace retiring incinerators with plasma-arc units capable of generating low-carbon baseload power.
Capital spending in the waste management equipment market for disposal units is being propelled by Japan’s order for a 600-t-per-day gasification plant in Tokyo and Saudi tenders for refuse-derived fuel lines tied to cement kilns. E-commerce warehouses are another bright spot, installing high-density corrugated balers that compress to 600 kg/m³, reducing haulage costs. Conversely, MRF operators are deferring some recycling-line replacements until OCC and mixed-plastic prices recover, lengthening upgrade cycles to nine years in North America.


By Waste Type: Non-Hazardous Streams Dominate Volume, Hazardous Lines Outpace Growth
Non-hazardous streams, including municipal solid waste and construction debris, accounted for 91.05% of 2025 throughput, anchoring fleet orders for front-end loaders, transfer-station compactors, and single-stream sorters. Fleet-renewal programs in U.S. municipalities, where refuse trucks average 9.2 years in service, are driving purchases of compressed-natural-gas and battery-electric vehicles equipped with automated arms.
Hazardous-waste handling lines are growing at a 6.41% CAGR, buoyed by lithium-ion battery gigafactories in China and pharmaceutical clusters in India that need negative-pressure shredders, autoclaves, and rotary-kiln incinerators that meet 1,200 °C combustion thresholds. The Basel Convention’s 2024 e-waste amendment reclassified many devices as hazardous, obliging EU dismantlers to fit fume-extraction hoods and heavy-metal filtration units.
By Application: Residential & Commercial Waste Retains Lead
Residential & commercial waste lines accounted for 57.8% of 2025 installations, supported by urbanization in Asia-Pacific and by European curbside programs that require leak-proof compactor chambers and bin-lift modules for source-separated organics. The segment benefits from corporate sustainability audits that track real-time bin weights via IoT sensors for ESG reporting.
Industrial waste equipment is poised for the fastest 6.12% CAGR, driven by on-site briquetting presses that cut metal-chip volumes by 85% and generate clean scrap sales at USD 320 per tonne. Construction-and-demolition sites in India are also adopting mobile crushers compliant with IS 383:2016 recycled-aggregate norms, ensuring steady demand for jaw and impact crushers.
By Technology: Semi-Automated Lines Prevail Today, Fully Automated Platforms Accelerate
Semi-automated configurations accounted for 29.5% of 2025 deployments, combining manual pre-sorting with screens, magnetic drums, and single-wavelength NIR scanners to achieve 85% aluminum and PET recovery rates. Labor unions in Brazil and Mexico continue to staff conveyors, although ergonomic risks and rising wages are nudging operators toward robotics.
Fully automated platforms will register a 6.97% CAGR as convolutional neural networks learn from 100 million labeled images to hit 80 picks per minute with ≤2% contamination. AMP Robotics’ roll-out across 22 U.S. MRFs under Waste Management Inc.’s USD 200 million retrofit plan exemplifies this trajectory. IoT-enabled compactors that transmit compaction ratios and predictive-maintenance alerts further extend equipment life from eight to 11 years and trim fuel use by 15%.
Geography Analysis
Asia-Pacific generated 45.65% of 2025 revenue for the waste management equipment market, underpinned by China’s USD 25 billion sanitation grants and India’s USD 17 billion Swachh Bharat Mission 2.0 allocations. Japan processed 32.1 million t of municipal solid waste into 9.8 TWh of electricity in 2025, yet a 28-year-old incinerator fleet is driving orders for low-dioxin stoker-grate and fluidized-bed upgrades. South Korea’s 92% beverage-container return rate created a USD 45 million market for reverse-vending sorters throughout 18,000 retail sites.
Middle East & Africa will log the fastest 6.48% CAGR through 2031, as Saudi Arabia tenders USD 3.2 billion in anaerobic digestion and RDF projects to meet its 95% diversion target, and the UAE enforces its single-use plastic ban, triggering optical-sorter retrofits in Dubai and Abu Dhabi. South Africa redirected USD 150 million in producer fees to municipal sorting centers, while Nigeria expanded compactor-truck fleets and opened five transfer stations to improve collection coverage for Lagos’ 15 million residents.
North America and Europe have mature replacement cycles but remain regulatory pacesetters. The U.S. Infrastructure Law supplied USD 275 million in modernization grants across 28 MRFs, targeting a 50% national recycling rate by 2030. Canada’s plastics registry mandates granular packaging reporting, accelerating RFID-tagged bin adoption. Germany’s Packaging Act now requires 30% recycled content in PET bottles, sparking EUR 420 million in washing-line and pelletizing expansions.


Competitive Landscape
Competition in the waste management equipment market is moderate, with the top five vertically integrated service providers such as Veolia, SUEZ, Waste Management Inc., TOMRA, and Republic Services collectively holding 28% of worldwide installed capacity. These players bundle collection contracts with in-house MRFs and thermal-treatment assets to secure feedstock and hedge commodity swings. Equipment specialists such as CP Manufacturing, Bollegraaf, and Machinex differentiate through proprietary hyperspectral sensors and AI software, commanding 20%–35% price premiums but facing margin pressure from low-cost Chinese entrants whose export models undercut European hardware by 40%.
Strategic moves center on digitalization and circular-economy partnerships. Republic Services’ USD 145 million purchase of IoT-compactor firm Waste Harmonics expanded its data-as-a-service portfolio to 8,500 commercial locations. Veolia signed a EUR 85 million deal with TOMRA for 47 hyperspectral units to meet audit-grade purity demands under Europe’s CSRD. SUEZ’s joint venture with Plastic Energy to build three chemical-recycling plants will secure 90,000 t/year of TACOIL feedstock, aligning equipment sales with offtake agreements.
Business models are shifting toward Equipment-as-a-Service (EaaS). Wastequip’s SmartPack platform keeps ownership of balers and compactors and bills per tonne processed, lowering customer CapEx while locking in multi-year parts and telemetry contracts. Mobile, containerized shredders from TANA Oy rent on monthly terms to demolition sites, bypassing lengthy permits, while Dover’s patents on regenerative hydraulic drives for electric refuse trucks aim to extend range by 18%.
Waste Management Equipment Industry Leaders
Wastequip LLC
Dover Corp. (Environmental Solutions Group)
TOMRA Systems ASA
CP Manufacturing Inc.
Bollegraaf Recycling Solutions
- *Disclaimer: Major Players sorted in no particular order


Recent Industry Developments
- February 2026: TOMRA Systems secured a EUR 85 million order from Veolia for 47 AUTOSORT hyperspectral units to be installed across Europe by Q4 2026.
- January 2026: Republic Services closed the USD 145 million acquisition of Waste Harmonics, adding 8,500 IoT-enabled compactors to its digital fleet.
- December 2025: Hitachi Zosen won a USD 120 million contract to build a 600 t/day waste-to-energy gasification plant for Tokyo, with carbon-capture readiness.
- November 2025: SUEZ and Plastic Energy formed a venture to construct three chemical-recycling plants totaling 90,000 t/year, backed by EUR 120 million in EU Innovation Fund grants.


Global Waste Management Equipment Market Report Scope
The waste management equipment involves collecting solid, liquid, and gas waste. This includes the activities and actions required to manage waste from its inception to the final stage of disposal. This comprises of collection, transport, treatment, and disposal of waste coupled with monitoring and regulation of the waste management process. A complete background analysis of the Global waste management equipment market, including the assessment of the economy and contribution of sectors in the economy, market overview, market size estimation for key segments, and emerging trends in the market segments, market dynamics, and geographical trends, and COVID-19 impact is included in the report.
The Global Waste Management Equipment Market is segmented By Product Type, (Waste Disposal Equipment and Waste Recycling & Sorting Equipment), By Waste Type (Hazardous and Non-hazardous), By Application (Industrial Waste, Municipal Waste, and Others), and By Geography (North America (US, Canada, Mexico), Europe (Spain, Germany, France, UK, Portugal, Greece, Italy, rest of Europe), Asia-Pacific (China, Japan, South Korea, India, rest of Asia-Pacific), LAMEA (UAE, Saudi Arabia, Brazil, South Africa, rest of LAMEA)). The report offers market size and forecasts in values (USD billion) for all the above segments.
| Waste Disposal Equipment |
| Waste Recycling & Sorting Equipment |
| Hazardous |
| Non-Hazardous |
| Residential & Commercial Waste |
| Industrial Waste (Hazardous & Non-Hazardous) |
| Construction & Demolition Waste |
| Healthcare Waste |
| Others(Agriculture Waste, Mining & Extraction Waste, etc.) |
| Manual |
| Semi-Automated |
| Fully Automated(Smart IoT / AI-Enabled, etc.) |
| North America | United States |
| Canada | |
| Mexico | |
| South America | Brazil |
| Argentina | |
| Peru | |
| Rest of South America | |
| Europe | United Kingdom |
| Germany | |
| France | |
| Italy | |
| Spain | |
| BENELUX (Belgium, Netherlands, and Luxembourg) | |
| NORDICS (Denmark, Finland, Iceland, Norway, and Sweden) | |
| Rest of Europe | |
| Asia-Pacific | China |
| India | |
| Japan | |
| Australia | |
| South Korea | |
| ASEAN (Indonesia, Thailand, Philippines, Malaysia, Vietnam) | |
| Rest of Asia-Pacific | |
| Middle East and Africa | Saudi Arabia |
| United Arab Emirates | |
| Qatar | |
| Kuwait | |
| Turkey | |
| Egypt | |
| South Africa | |
| Nigeria | |
| Rest of Middle East and Africa |
| By Product Type | Waste Disposal Equipment | |
| Waste Recycling & Sorting Equipment | ||
| By Waste Type | Hazardous | |
| Non-Hazardous | ||
| By Application | Residential & Commercial Waste | |
| Industrial Waste (Hazardous & Non-Hazardous) | ||
| Construction & Demolition Waste | ||
| Healthcare Waste | ||
| Others(Agriculture Waste, Mining & Extraction Waste, etc.) | ||
| By Technology | Manual | |
| Semi-Automated | ||
| Fully Automated(Smart IoT / AI-Enabled, etc.) | ||
| By Geography | North America | United States |
| Canada | ||
| Mexico | ||
| South America | Brazil | |
| Argentina | ||
| Peru | ||
| Rest of South America | ||
| Europe | United Kingdom | |
| Germany | ||
| France | ||
| Italy | ||
| Spain | ||
| BENELUX (Belgium, Netherlands, and Luxembourg) | ||
| NORDICS (Denmark, Finland, Iceland, Norway, and Sweden) | ||
| Rest of Europe | ||
| Asia-Pacific | China | |
| India | ||
| Japan | ||
| Australia | ||
| South Korea | ||
| ASEAN (Indonesia, Thailand, Philippines, Malaysia, Vietnam) | ||
| Rest of Asia-Pacific | ||
| Middle East and Africa | Saudi Arabia | |
| United Arab Emirates | ||
| Qatar | ||
| Kuwait | ||
| Turkey | ||
| Egypt | ||
| South Africa | ||
| Nigeria | ||
| Rest of Middle East and Africa | ||


Key Questions Answered in the Report
What is the current global size of the waste management equipment market?
The waste management equipment market size reached USD 19.93 billion in 2026.
Which product segment dominates equipment demand?
Waste recycling & sorting equipment leads with 67.8% of 2025 revenue share.
Which region will grow fastest through 2031?
The Middle East & Africa is projected to post the highest 6.48% CAGR as diversion mandates accelerate new plant builds.
How are Extended Producer Responsibility rules influencing equipment purchases?
EPR frameworks in the EU, India, and Canada are pushing brand owners to fund advanced optical sorters and balers so facilities can hit higher recycling-rate thresholds.
Why are fully automated systems gaining traction?
AI-guided robots and IoT sensors improve purity to ≥98%, halve manual labor, and extend equipment life, driving a 6.97% CAGR for fully automated platforms.
What are the main barriers to adopting pyrolysis plants?
High capital costs of USD 30 million–50 million per facility and 32-month permitting timelines under stringent emission standards slow wider uptake.
Page last updated on:


