E-Waste Recycling Market Size and Share
Market Overview
| Study Period | 2020 - 2031 |
|---|---|
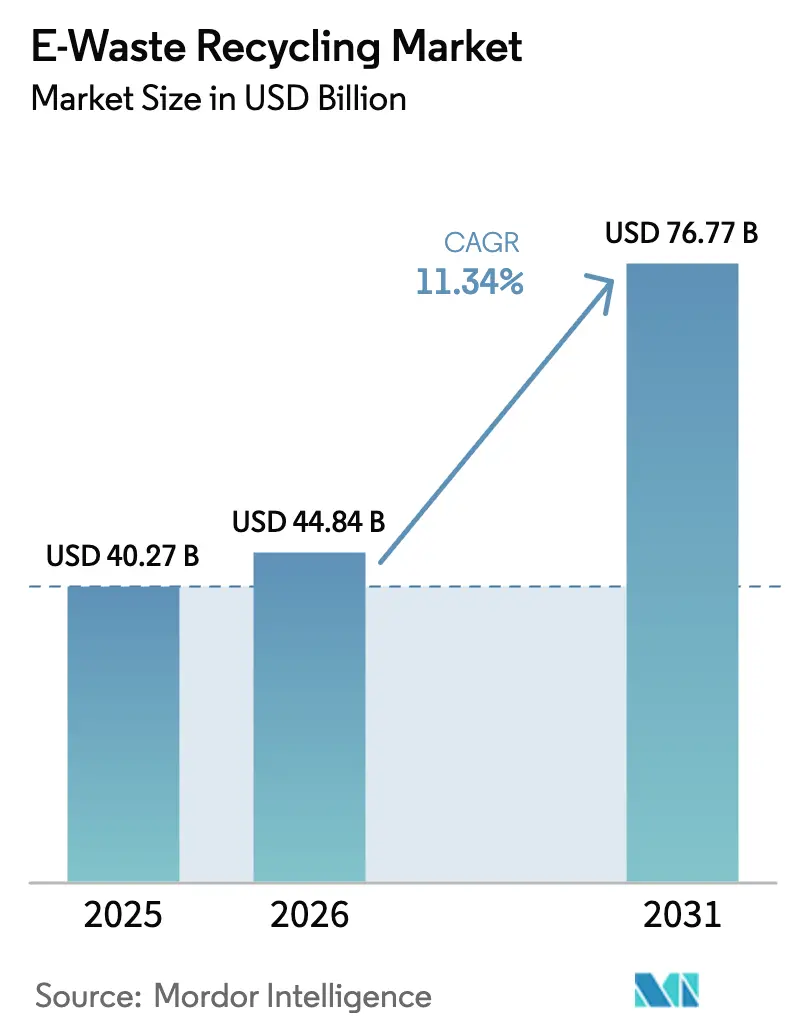
| Market Size (2026) | USD 44.84 Billion |
| Market Size (2031) | USD 76.77 Billion |
| Growth Rate (2026 - 2031) | 11.34% CAGR |
| Fastest Growing Market | Middle East and Africa |
| Largest Market | Asia Pacific |
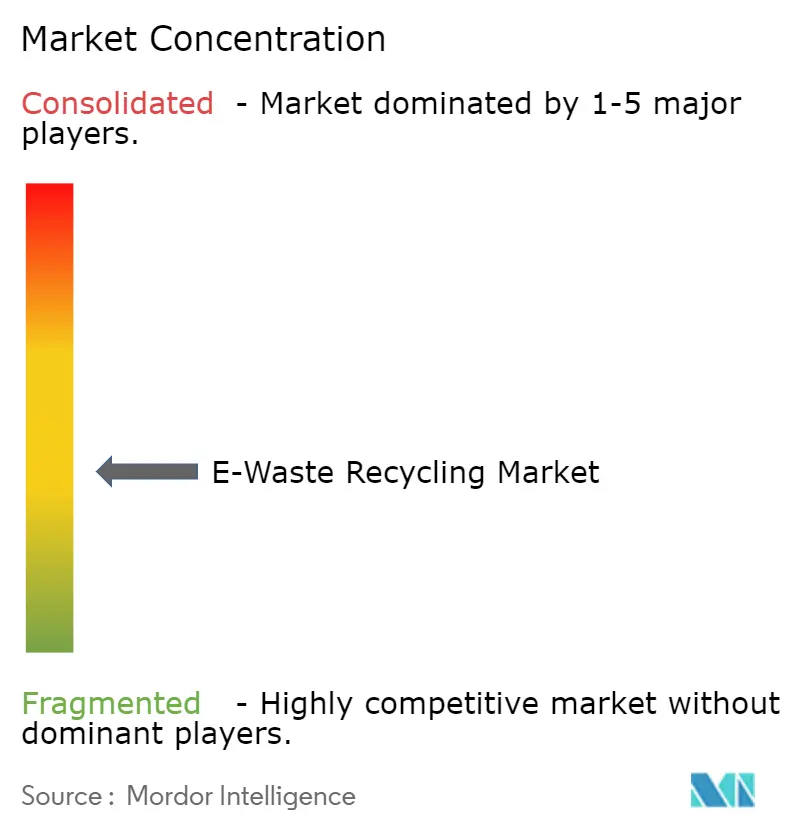
| Market Concentration | Medium |
Major Players*Disclaimer: Major Players sorted in no particular order Image © Mordor Intelligence. Reuse requires attribution under CC BY 4.0. | |
E-Waste Recycling Market Analysis by Mordor Intelligence
E-waste recycling market size in 2026 is estimated at USD 44.84 billion, growing from 2025 value of USD 40.27 billion with 2031 projections showing USD 76.77 billion, growing at 11.34% CAGR over 2026-2031. The growth trajectory reflects the shift from basic waste disposal to strategic resource recovery as governments toughen take-back laws, manufacturers face critical-material shortages, and investors channel capital toward circular-economy assets. Regulatory mandates are the keystone: Extended Producer Responsibility (EPR) schemes in the European Union, India, and South Korea steered roughly 2.1 million t of e-waste into certified plants during 2024, establishing formal revenue streams for processors.[1]European Commission, “What is Green Public Procurement,” ec.europa.eu On the supply side, Asia-Pacific governments view discarded electronics as “urban mines.” Japan alone committed JPY 30 billion (USD 191 million) to build ten hubs dedicated to copper and critical-metal recovery, underscoring policy focus on domestic resource security.[2]Nikkei Asia, “Japan plans 10 e-waste hubs to mine copper and metal resources,” asia.nikkei.com Meanwhile, corporate net-zero pledges create captive demand for certified recyclate, exemplified by Samsung sourcing more than 90% of the cobalt in its Galaxy S25 batteries from recycled streams.[3]Samsung Electronics, “Inside Samsung’s Circular Battery Supply Chain,” news.samsung.com Despite these positives, persistent informal recycling in emerging economies diverts high-value flows, while volatile gold and copper prices complicate project finance-even as automated processing and AI-enabled sorting begin to lower cost curves.
Key Report Takeaways
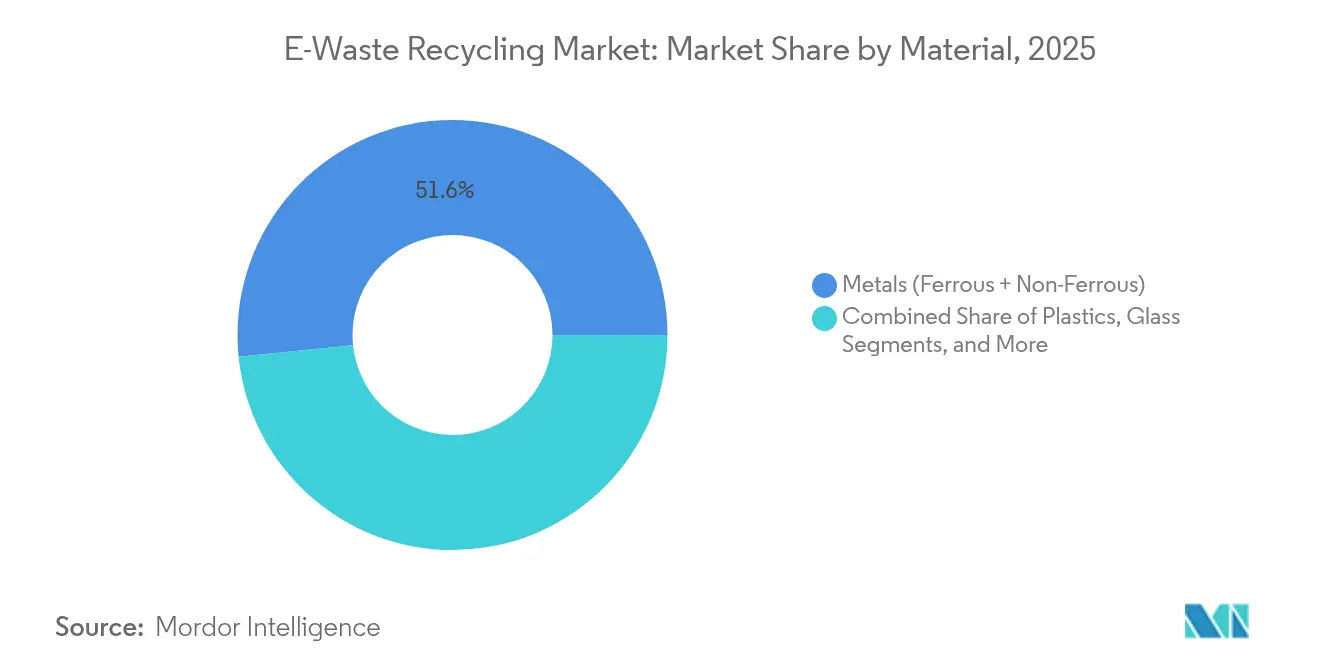
- By material, metals recovery led with 51.62% of the E-waste recycling market share in 2025, while plastics is projected to log the fastest growth at a 13.78% CAGR through 2031.
- By source, consumer electronics accounted for 39.10% of the E-waste recycling market size in 2025; IT & telecom equipment is forecast to expand at the highest 14.55% CAGR to 2031.
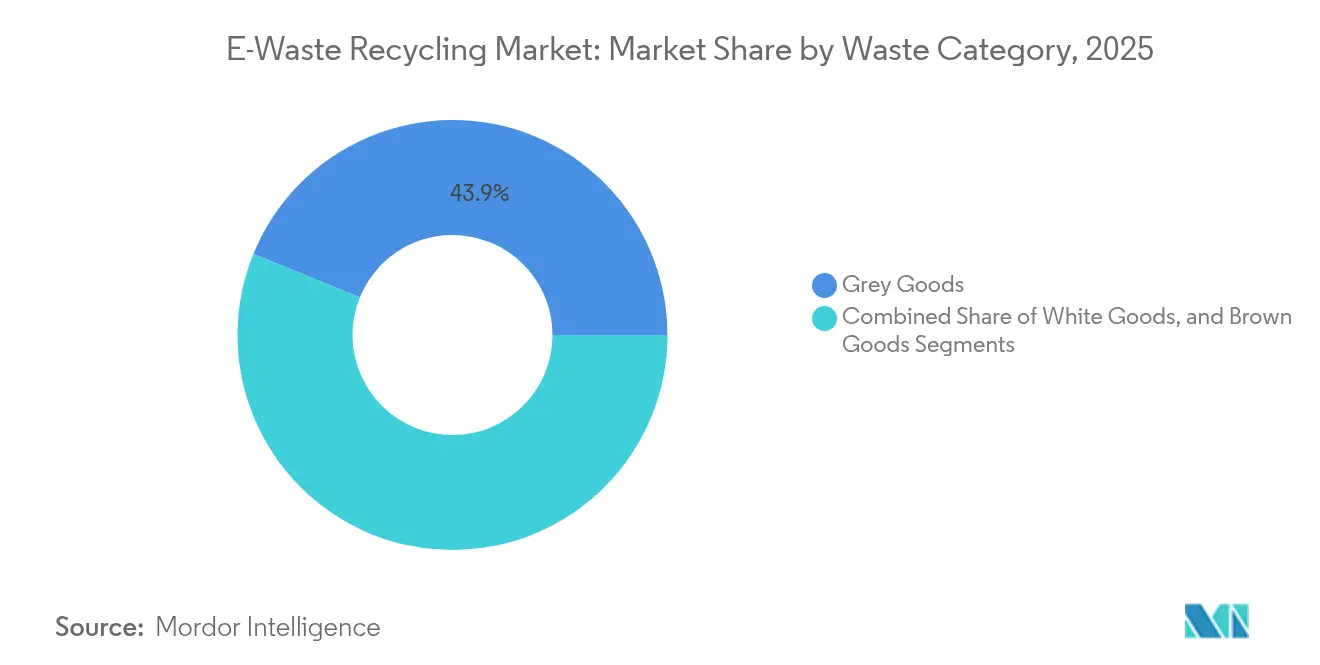
- By waste category, grey goods dominated with 43.85% revenue share in 2025, whereas brown goods are poised to grow quickest at a 12.76% CAGR during the forecast period.
- By disposal method, recycling and material recovery captured 60.88% share of the E-waste recycling market size in 2025; refurbishment and re-use activities are expected to register the top CAGR of 12.21% through 2031.
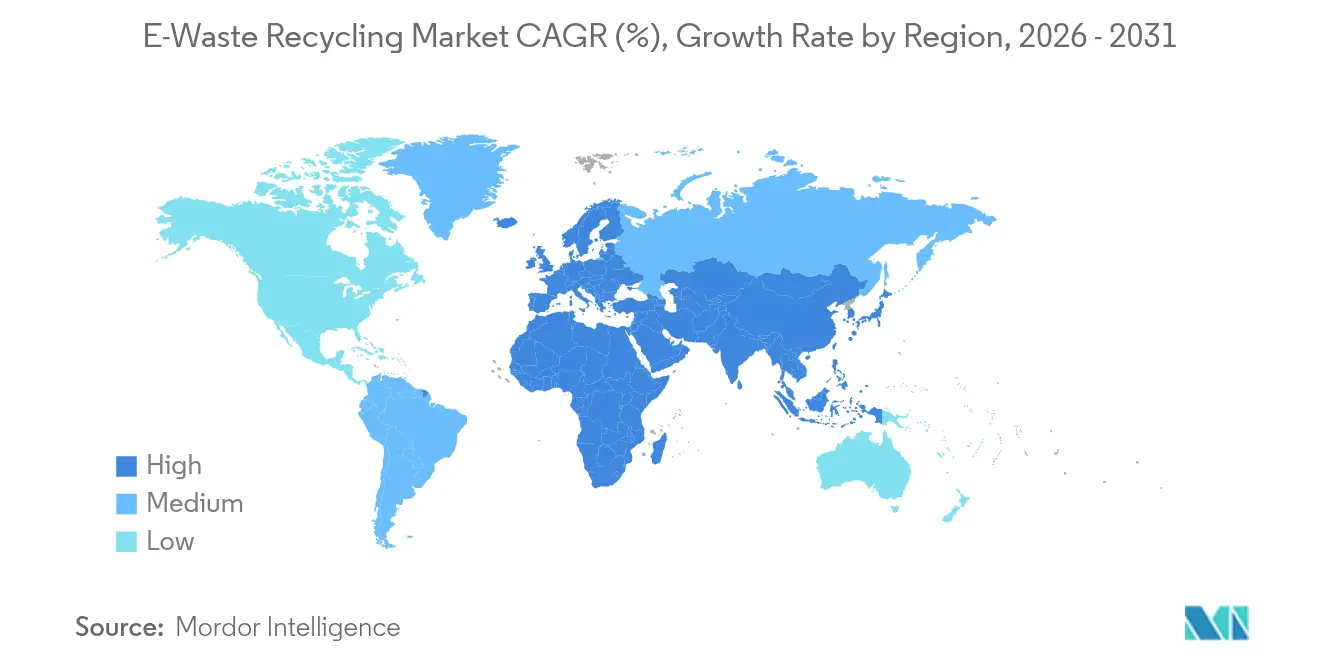
- By geography, Asia-Pacific held 46.25% revenue share in 2025, while the Middle East & Africa region is predicted to lead growth at a 15.62% CAGR up to 2031.
Note: Market size and forecast figures in this report are generated using Mordor Intelligence’s proprietary estimation framework, updated with the latest available data and insights as of 2026.
Global E-Waste Recycling Market Trends and Insights
Drivers Impact Analysis*
| Driver | (~) % Impact on CAGR Forecast | Geographic Relevance | Impact Timeline |
|---|---|---|---|
| Extended Producer Responsibility mandates across EU, India, South Korea | +2.8% | EU, India, South Korea expanding into ASEAN | Medium term (2-4 years) |
| Urban-mining initiatives by OEMs in Asia-Pacific for critical-metal recovery | +1.9% | Asia-Pacific core, spillover to North America | Long term (≥4 years) |
| Rising secondary-resource demand from EV and battery industries | +2.4% | China, EU, North America | Short term (≤2 years) |
| Government green public-procurement targets | +1.2% | OECD, selected emerging markets | Medium term (2-4 years) |
| Corporate net-zero objectives driving closed-loop electronics | +1.6% | Global | Long term (≥4 years) |
| Source: Mordor Intelligence | |||
Implementation of Extended Producer Responsibility (EPR) Mandates across EU, India and South Korea
EPR rules shift the financial burden of collection and treatment from municipalities to manufacturers, locking in predictable funding for the formal E-waste recycling market. South Korea’s September 2024 law widened EPR coverage to every electronic device, diverting an extra 340,000 t annually from informal chains. India’s amended 2024 rules introduced tradable EPR certificates priced at INR 15–25 kg, rewarding efficiency and creating a secondary revenue stream for compliant recyclers. In Europe, the new battery regulation demanding 65% cobalt recovery by 2031 links downstream recyclers with upstream cell manufacturers, guaranteeing offtake for certified material and reinforcing the E-waste recycling market.
Urban-Mining Initiatives by OEMs in Asia-Pacific for Critical-Metal Recovery
Electronics makers now treat discarded devices as strategic ore bodies. Japan aims to double rare-metal recovery to 420,000 t y by 2030, focusing on lithium, nickel and cobalt retrieved from imported circuit boards.[4]Yomiuri Shimbun, “Urban-mine rare-metal recovery target doubled,” yomiuri.co.jp Mitsubishi Materials and peers operate dedicated “urban-mining” lines that process about 600,000 t of small appliances a year, securing more than 200,000 t of valuable metals. Microsoft’s investment in Cyclic Materials’ magnet-recovery technology shows how IT giants fortify supply-chain resilience while keeping rare earths out of geopolitically sensitive channels.
Rising Secondary-Resource Demand from EV and Battery Industries
Electric-vehicle adoption is rewriting commodity flows. Global lithium-ion battery recycling capacity reached 1.6 million t in 2025 and is on track to top 3 million t before 2030 as first-generation EV battery packs retire. Europe’s battery law stipulates 16% recycled cobalt in cells by 2031, rising to 26% by 2036, creating a regulated floor price for certified material. China’s EPR-for-batteries model hard-wires the link between cell makers and recyclers, ensuring continuous feedstock despite commodity price swings.
Government Green Public-Procurement (GPP) Targets
Public agencies spend hundreds of billions on IT hardware annually, and new GPP rules give preference to products that document recycled content and end-of-life recyclability. The European Commission already requires environmental criteria in tenders covering PCs, monitors, and servers. Norway’s 2021-2030 plan ranks circular-economy compliance on par with price in public bids. Similar guidelines from the US EPA and Australia’s federal procurement authority are now steering bulk purchase orders toward manufacturers aligned with the e-waste recycling market.
Restraints Impact Analysis*
| Restraint | (~) % Impact on CAGR Forecast | Geographic Relevance | Impact Timeline |
|---|---|---|---|
| Persistence of informal recycling sector in emerging economies | -2.1% | Sub-Saharan Africa, South Asia, Latin America | Long term (≥4 years) |
| Fragmented collection networks inflating reverse-logistics cost | -1.4% | Global, acute in developing markets | Medium term (2-4 years) |
| Technological barriers in recycling multi-material miniaturised devices | -1.8% | Advanced markets | Long term (≥4 years) |
| Price volatility in recovered precious metals | -1.3% | Commodity-dependent regions | Short term (≤2 years) |
| Source: Mordor Intelligence | |||
Persistence of Informal Recycling Sector in Emerging Economies
Unregulated dismantling hubs such as Ghana’s Agbogbloshie handle roughly 215,000 t a year using open-burn and acid-leach methods that deliver quick cash returns but externalize environmental costs. India’s informal collectors still process close to 90% of the nation’s 3.8 million t annual e-waste while licensed plants stand idle at only 50% utilization. Informal actors can outbid formal recyclers by 20-40% when purchasing scrap because they ignore compliance overheads, depriving the E-waste recycling market of critical feedstock. Pilot programs in Egypt that aggregate informal volumes for hand-off to certified plants demonstrate a workable bridge, but scaling requires sustained incentives and enforcement.
Technological Barriers in Recycling Multi-Material Miniaturised Devices
Smartphones, tablets, and wearables pack dozens of materials into adhesive-sealed micro-assemblies, complicating automated shredding and separation. Mechanical pre-treatment of phones achieves only 85% printed-circuit separation versus manual dismantling, leaving valuable gold and palladium unrecovered. EU REACH and RoHS rules require bromine and chlorine checks before plastics re-enter the supply chain, adding time and cost. Research labs have demonstrated recyclable circuit boards using dynamic polymers, but cost premiums still deter mass adoption. Until design-for-disassembly becomes standard, recovery rates and margins across the E-waste recycling market will remain under pressure.
*Our forecasts treat driver/restraint impacts as directional, not additive. The impact forecasts reflect baseline growth, mix effects, and variable interactions.
Segment Analysis
By Material: Metals Retain Value Leadership
Metals reclamation contributed 51.62% of the E-waste recycling market in 2025, underpinning revenue through established ferrous and precious-metal refining. The segment’s large installed base and high residual values ensure stable throughput even when commodity prices gyrate. Non-ferrous streams such as copper, aluminum, and gold drive profit intensity, while new technologies targeting tantalum and rare earths add upside potential. Advanced microwave-assisted processes now extract tantalum at 97% purity, trimming energy use and boosting yields. Plastics rank as the fastest-growing material class, rising at 13.78% CAGR as automakers and packaging groups mandate recycled resin content. Murata’s silver closed-loop program, launched in 2025, illustrates how horizontal recycling of niche metals can anchor future revenue streams.
Second-generation hydrometallurgical lines also broaden the total E-waste recycling market size for metals by raising the economic floor of lower-grade input. Pilot plants in the United States recover manganese, magnesium, and dysprosium from mixed shred using non-toxic reagents, aligning with stricter environmental permits. As policy mandates raise minimum recovery thresholds, producers that master selective leaching and solvent extraction will capture share from traditional high-temperature smelters.


By Source: IT and Telecom Equipment Accelerates
Consumer electronics generated 39.10% of global input in 2025, driven by smartphone replacement and home-appliance turnover. Yet IT & telecom hardware is poised for a 14.55% CAGR, outpacing every other source category as data-center upgrades, cloud migrations, and 5G rollouts swell server and base-station retirement volumes. The E-waste recycling market size for this segment is projected to expand in lock-step with hyperscaler server refresh cycles, which average 3-4 years. Automated micro-factories co-developed by ABB Robotics and Molg now dismantle racks of decommissioned servers within minutes, cutting labor cost per kilogram by 30%.
IoT sensors, smart meters, and wearables are the next frontier. Though small in mass, they carry high value concentration, potentially accounting for 20% of aggregate material value by 2030 according to circular-economy think-tanks. Recyclers are therefore redesigning intake lines to screen coin-cell batteries and rare-earth magnets that these devices contain.
By Waste Category: Grey Goods Present Complexity
Grey goods-PCs, servers, telecom racks-made up 43.85% of volumes in 2025, reflecting enterprise refresh tempos and cloud-edge deployments. Brown-goods streams such as TVs will rise at 12.76% CAGR as consumers upgrade to micro-LED screens that render first-generation flat panels obsolete. Automated disassembly modeling, now under validation at research institutes, is closing the cost gap between manual and robotic processing for densely packed grey-goods assemblies.
White goods-refrigerators, washing machines-continue to dominate tonnage but generate the lowest margin. Policy incentives that allow retailers to take back old units at point of sale ease collection friction, but high ferrous content depresses unit economics relative to circuit-board-rich grey goods. Incremental profits will therefore come from integrating heat-pump foam degassing or refrigerant capture that unlocks carbon-credit value streams.
By Disposal Method: Recycling Commands the Mainstream
Recycling captured 60.88% of all formally handled e-waste in 2025, cementing its position as the default end-of-life path amid mounting landfill bans. Refurbishment and reuse will grow fastest at 12.21% CAGR as corporations adopt device-as-a-service models that monetize second-life hardware. Mechanical shredding dominates bulk handling, but pyro- and hydro-metallurgical lines claim price premiums for high-grade concentrates. Microwave-induced pyrolysis now offers a route to delaminate cable polymers and salvage copper without generating dioxins, addressing the current 35% cable-insulation recovery rate.
Collection remains the cost bottleneck, eating 15-25% of total expense per tonne, especially in rural catchments. Digital tracking and reverse-logistics platforms that link consumers, retailers, and processors could compress transport costs and release margin for processors that scale.
Geography Analysis
Asia-Pacific dominated the E-waste recycling market with a 46.25% revenue share in 2025, helped by manufacturing proximity, dense population centers, and policy-led investments in formal capacity. China’s November 2024 rule reclassifying high-grade scrap copper and aluminum as resources instead of waste reopened import channels, boosting feedstock for local smelters and widening the E-waste recycling market share of Chinese operators. India is following suit with an INR 15,000 crore (USD 1.8 billion) incentive scheme for critical-minerals recycling, aimed at scaling domestic capacity from 10 firms to 100 within five years.
Europe maintains the world’s most comprehensive regulatory framework, rooted in the WEEE directive and reinforced by new battery and ecodesign laws. High labor costs and stringent permitting push processors toward automation and high-grade specialty flows; Umicore and Aurubis anchor regional capacity with proprietary metallurgical lines that recover more than 95% of precious-metal content.
North America ranks third by revenue but continues to grapple with fragmented state-level legislation and dispersed population centers that inflate reverse-logistics spending. Aurubis’ new US refinery and Balcones-Sims’ merger signal a shift toward scale-based economics and local smelting options that shorten haul distances.
The Middle East and Africa displays the fastest growth at 15.62% CAGR, albeit from a smaller base. Gulf states channel petro-revenues into industrial diversification, including metals recovery parks, while donor-funded programs in sub-Saharan Africa support pilot facilities that formalize informal collectors. Successful scale-up here hinges on harmonized customs codes, stronger enforcement, and technology transfer from mature markets.

Competitive Landscape
The E-waste recycling market is moderately fragmented: no single firm exceeds a 10% global revenue share, but regional clusters drive localized consolidation. Incumbents differentiate through metallurgical IP, integrated collection networks, and compliance management. Umicore’s pyro-hydrometallurgical platform secures >95% nickel, copper, and cobalt yields and positions the firm to capture future battery-scrap flows, though it has postponed its next mega-plant to 2032 to avoid oversupply. Aurubis processes around 1 million t of multi-feed recyclables annually and recently invested EUR 130 million to cut emissions and raise throughput in Lünen.
Strategic partnerships grow as OEMs internalize circular-economy metrics. Samsung, Dell, and Cisco embed take-back clauses in supply contracts, guaranteeing volumes for certified recyclers and ensuring that recycled cobalt, silver, and plastics feed back into next-generation products. Technology upgrades also influence market share. AI-driven visual sorters raise precious-metal yields and lower labor spend, giving early adopters a unit-cost edge. Consolidation continues: Balcones Resources’ merger with Sims Municipal Recycling formed a processor handling over 1 million t annually across 14 US metros.
Start-ups play in specialized niches-rare-earth magnet recovery, lithium-battery black mass refining-often backed by OEM or climate-tech funds. Cyclic Materials’ forthcoming Arizona plant will target end-of-life hard drives, reflecting demand for on-shore critical-material streams in the United States .
E-Waste Recycling Industry Leaders
Sims Limited
Aurubis AG
Electronic Recyclers International, Inc. (ERI)
Umicore
Enviro-Hub Holdings Ltd.
- *Disclaimer: Major Players sorted in no particular order

Recent Industry Developments
- June 2025: India’s Ministry of Mines finalized an INR 15,000 crore (USD 1.8 billion) incentive program for critical-minerals recycling, aimed at licensing 100 companies within five years.
- June 2025: Murata Manufacturing began industry-first horizontal silver recycling for electromagnetic-interference components
- April 2025: Aurubis started capacity ramp-up at its new US copper-recycling plant.
- April 2025: Cyclic Materials won construction approval for a rare-earth magnet recycling facility in Mesa, Arizona.
- March 2025: Samsung sourced more than 90% of cobalt for Galaxy S25 batteries from recycled feedstock.


Global E-Waste Recycling Market Report Scope
The e-waste recycling market involves the collection, dismantling, and processing of discarded electronic devices to recover valuable materials such as metals, plastics, and rare earth elements. This market aims to reduce environmental pollution, promote sustainability, and recover resources for reuse in manufacturing. It is driven by increasing electronic consumption, government regulations, and the growing need for responsible waste management solutions.
The E-Waste Recycling Market is segmented by material (metal, plastic, glass, other materials), source (household appliances, consumer electronics, industrial equipment, medical devices, other sources), and geography (North America, Europe, Asia Pacific, Latin America, Middle East and Africa). The market sizes and forecasts are provided in terms of value (USD) for all the above segments.
| Ferrous Metals |
| Non-Ferrous Metals (Copper, Aluminium, Precious) |
| Plastics (ABS, HIPS, PP, Others) |
| Glass |
| Others (Ceramics, Silicon, Composites) |
| Household Appliances | Large White Goods |
| Small Domestic Appliances | |
| Consumer Electronics | Smartphones and Tablets |
| TVs and Monitors | |
| Computers and Peripherals | |
| IT and Telecom Equipment | Servers and Data-centre HW |
| Industrial Equipment | Automation and Control |
| Medical Devices | Diagnostic Imaging |
| Others |
| White Goods |
| Brown Goods |
| Grey Goods |
| Collection and Logistics | |
| Refurbishment and Re-use | |
| Recycling and Material Recovery | Mechanical |
| Pyro-/Hydro-Metallurgical | |
| Landfilling and Incineration |
| North America | United States | |
| Canada | ||
| Mexico | ||
| Europe | Germany | |
| United Kingdom | ||
| France | ||
| Nordics | ||
| Rest of Europe | ||
| South America | Brazil | |
| Rest of South America | ||
| Asia-Pacific | China | |
| Japan | ||
| India | ||
| South-East Asia | ||
| Rest of Asia-Pacific | ||
| Middle East and Africa | Middle East | Gulf Cooperation Council Countries |
| Turkey | ||
| Rest of Middle East | ||
| Africa | South Africa | |
| Rest of Africa | ||
| By Material | Ferrous Metals | ||
| Non-Ferrous Metals (Copper, Aluminium, Precious) | |||
| Plastics (ABS, HIPS, PP, Others) | |||
| Glass | |||
| Others (Ceramics, Silicon, Composites) | |||
| By Source | Household Appliances | Large White Goods | |
| Small Domestic Appliances | |||
| Consumer Electronics | Smartphones and Tablets | ||
| TVs and Monitors | |||
| Computers and Peripherals | |||
| IT and Telecom Equipment | Servers and Data-centre HW | ||
| Industrial Equipment | Automation and Control | ||
| Medical Devices | Diagnostic Imaging | ||
| Others | |||
| By Waste Category | White Goods | ||
| Brown Goods | |||
| Grey Goods | |||
| By Disposal Method | Collection and Logistics | ||
| Refurbishment and Re-use | |||
| Recycling and Material Recovery | Mechanical | ||
| Pyro-/Hydro-Metallurgical | |||
| Landfilling and Incineration | |||
| By Geography | North America | United States | |
| Canada | |||
| Mexico | |||
| Europe | Germany | ||
| United Kingdom | |||
| France | |||
| Nordics | |||
| Rest of Europe | |||
| South America | Brazil | ||
| Rest of South America | |||
| Asia-Pacific | China | ||
| Japan | |||
| India | |||
| South-East Asia | |||
| Rest of Asia-Pacific | |||
| Middle East and Africa | Middle East | Gulf Cooperation Council Countries | |
| Turkey | |||
| Rest of Middle East | |||
| Africa | South Africa | ||
| Rest of Africa | |||


Key Questions Answered in the Report
What is the current value of the E-waste recycling market?
The E-waste recycling market is valued at USD 44.84 billion in 2026 and is projected to reach USD 76.77 billion by 2031.
Which material stream generates the most revenue
Metals recovery leads with 51.62% of global revenue thanks to the high value of copper, gold, and other non-ferrous metals.
Which region is expanding fastest?
The Middle East & Africa region is forecast to post the highest growth, advancing at a 15.62% CAGR between 2026 and 2031.
Why are EV batteries important for e-waste recyclers?
Mandatory recycled-content targets in European battery regulations and China’s battery-EPR model guarantee demand for cobalt, nickel, and lithium recovered from end-of-life packs, bolstering recycler margins.
How do EPR rules benefit recyclers?
Extended Producer Responsibility transfers collection and processing costs to manufacturers, ensuring stable funding for formal recyclers and expanding certified feedstock volumes.
What are the main obstacles facing the industry?
Informal recycling in emerging economies, fragmented collection networks, and the technical complexity of miniaturized devices continue to suppress recovery rates and profitability.
Page last updated on:


