Market Overview
| Study Period | 2019 - 2031 |
|---|---|
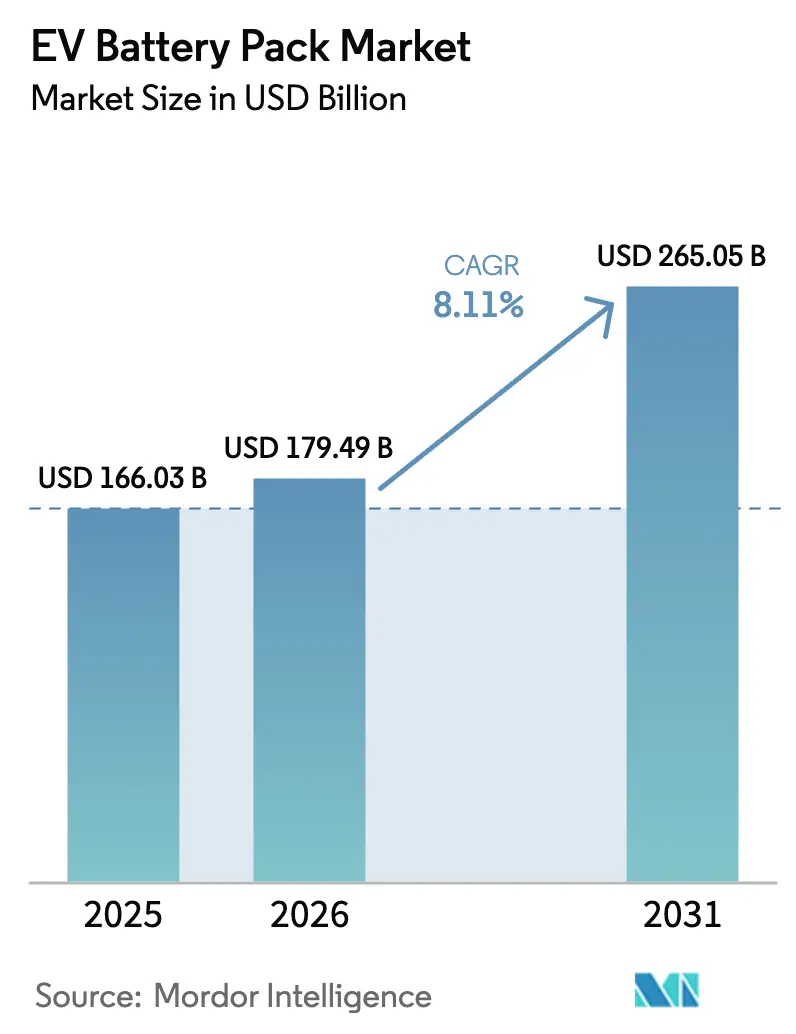
| Market Size (2026) | USD 179.49 Billion |
| Market Size (2031) | USD 265.05 Billion |
| Growth Rate (2026 - 2031) | 8.11% CAGR |
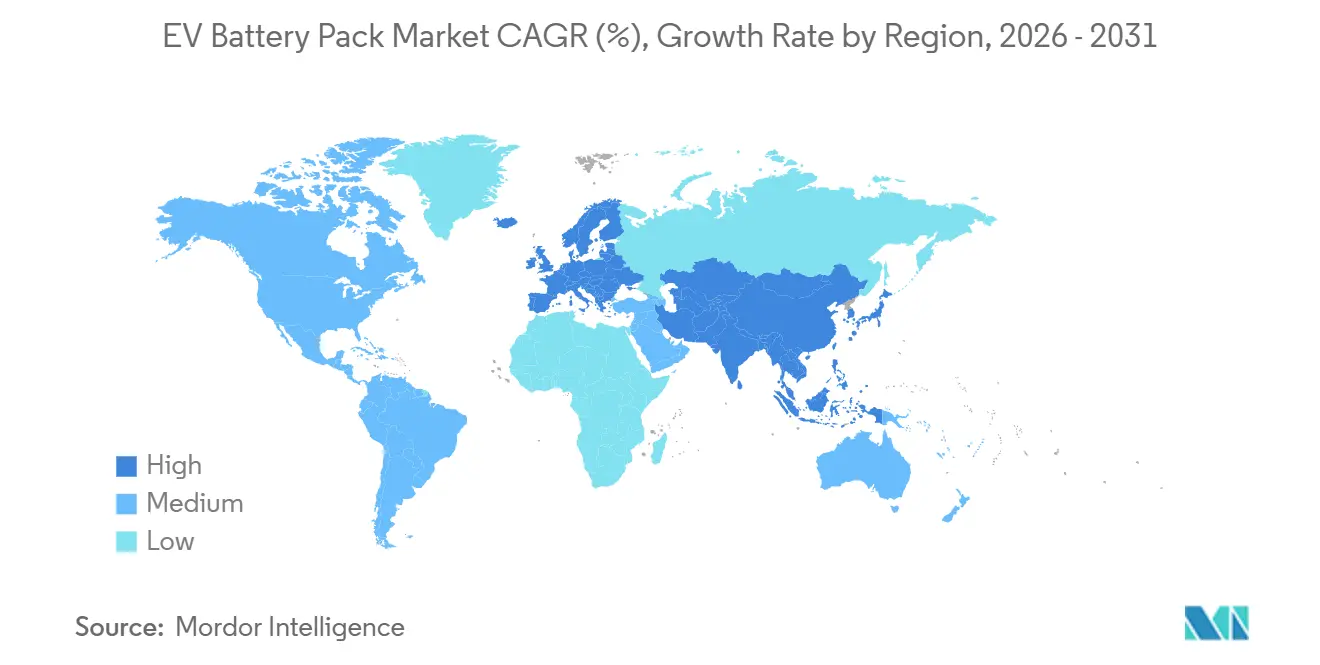
| Fastest Growing Market | Europe |
| Largest Market | Asia-Pacific |
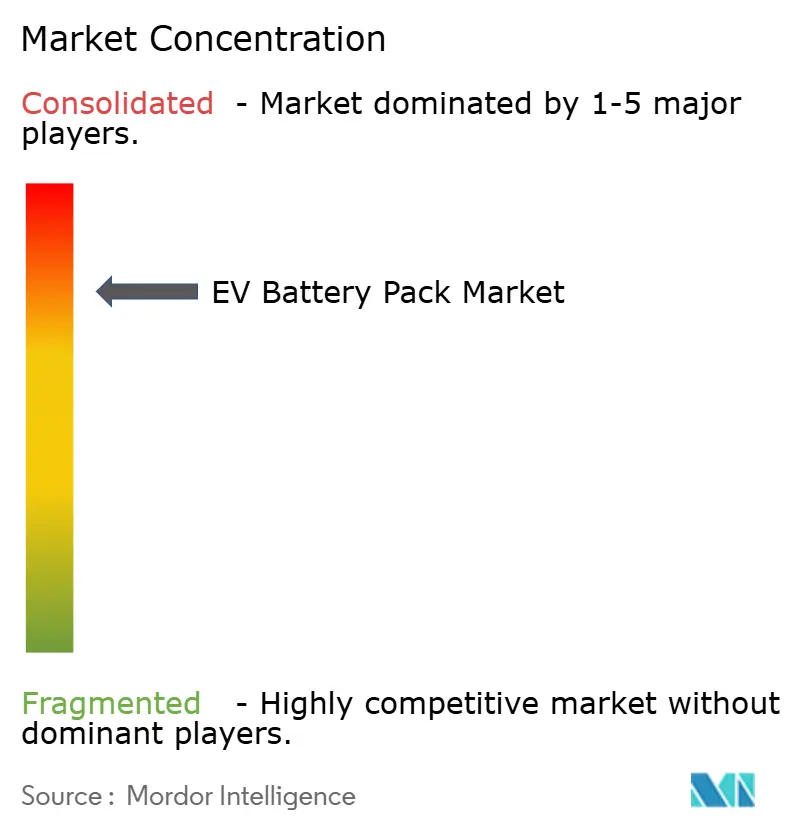
| Market Concentration | High |
Major Players*Disclaimer: Major Players sorted in no particular order Image © Mordor Intelligence. Reuse requires attribution under CC BY 4.0. | |
EV Battery Pack Market Analysis by Mordor Intelligence
The EV battery pack market size is expected to grow from USD 166.03 billion in 2025 to USD 179.49 billion in 2026 and is forecast to reach USD 265.05 billion by 2031 at an 8.11% CAGR over 2026–2031. Falling lithium-iron-phosphate prices, rapid scale-up of gigafactories, and the spread of cell-to-pack integration are closing the cost gap with internal-combustion powertrains, accelerating adoption across passenger and commercial vehicle segments. Automakers are bringing battery manufacturing in-house to lock in supply and capture margins, while solid-state roadmaps introduce technology and capital-allocation uncertainty. Raw-material constraints for lithium and nickel remain the chief risk to sustained volume growth, but investments in recycling and alternative chemistries such as LMFP are beginning to ease pressure. These opposing forces create a dynamic yet resilient growth outlook for the EV battery pack market through the end of the decade.
Key Report Takeaways
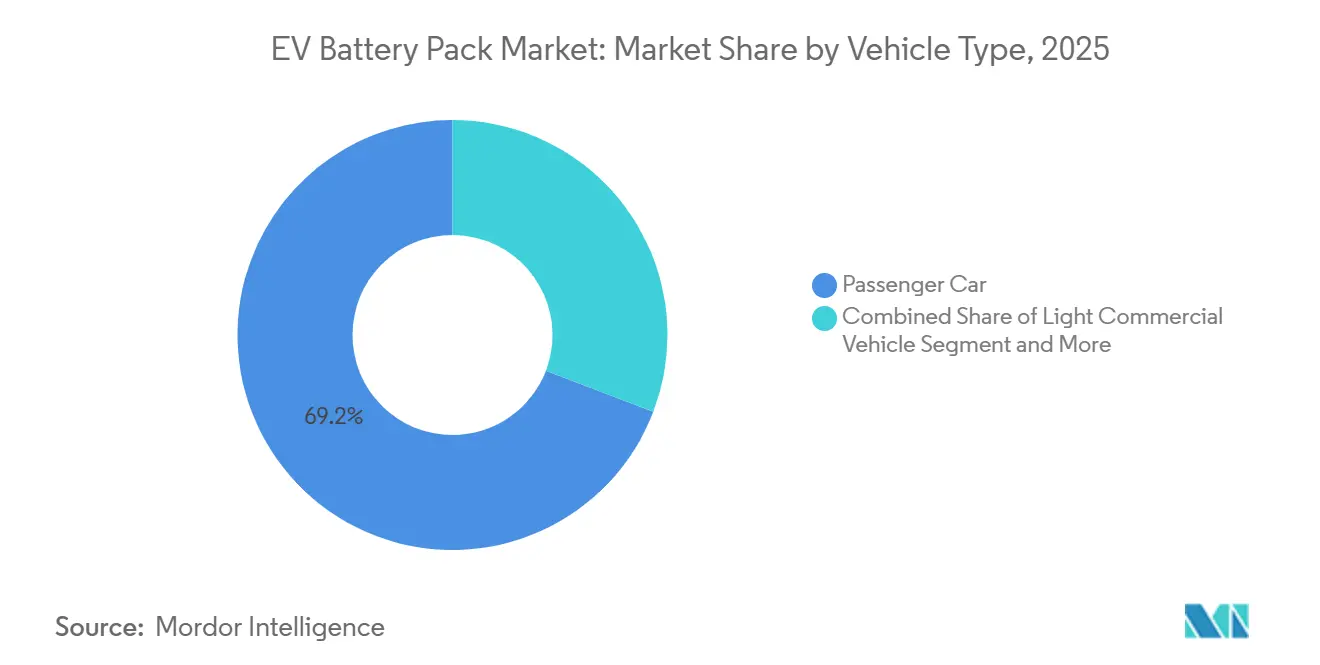
- By vehicle type, passenger cars led with 69.16% of the EV battery pack market share in 2025; medium- and heavy-duty trucks are forecast to advance at a 9.98% CAGR to 2031.
- By propulsion, BEVs accounted for an 81.62% share of the EV battery pack market size in 2025 and are growing at a 10.16% CAGR through 2031.
- By chemistry, NMC commanded 52.09% of the EV battery pack market share in 2025, while LMFP records the highest projected CAGR at 10.52% through 2031.
- By battery form, prismatic cells captured 46.46% of the EV battery pack market share in 2025; cylindrical cells are advancing at a 9.28% CAGR through 2031.
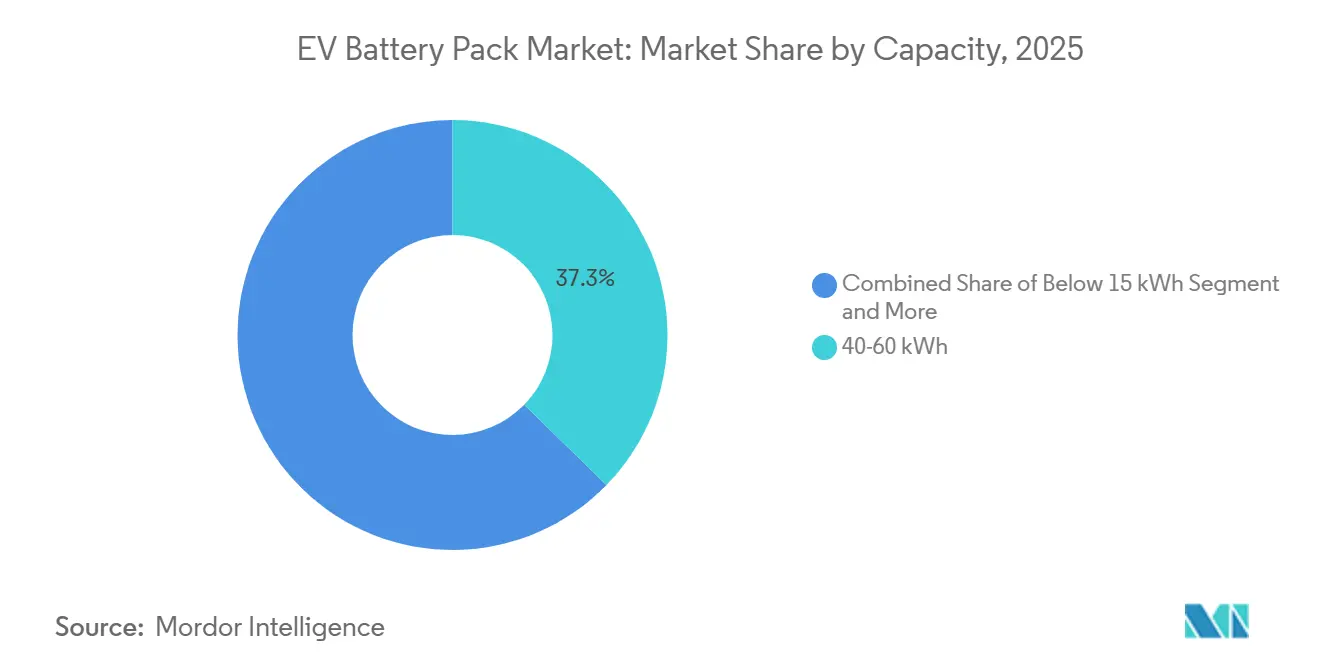
- By capacity, the 40-60 kWh band led with 37.28% of EV battery pack market share in 2025; the 100-150 kWh band is forecast to grow at a 9.71% CAGR to 2031.
- By voltage class, below-400 V systems held 63.41% of EV battery pack market share in 2025; 600-800 V systems are set to rise at a 9.16% CAGR through 2031.
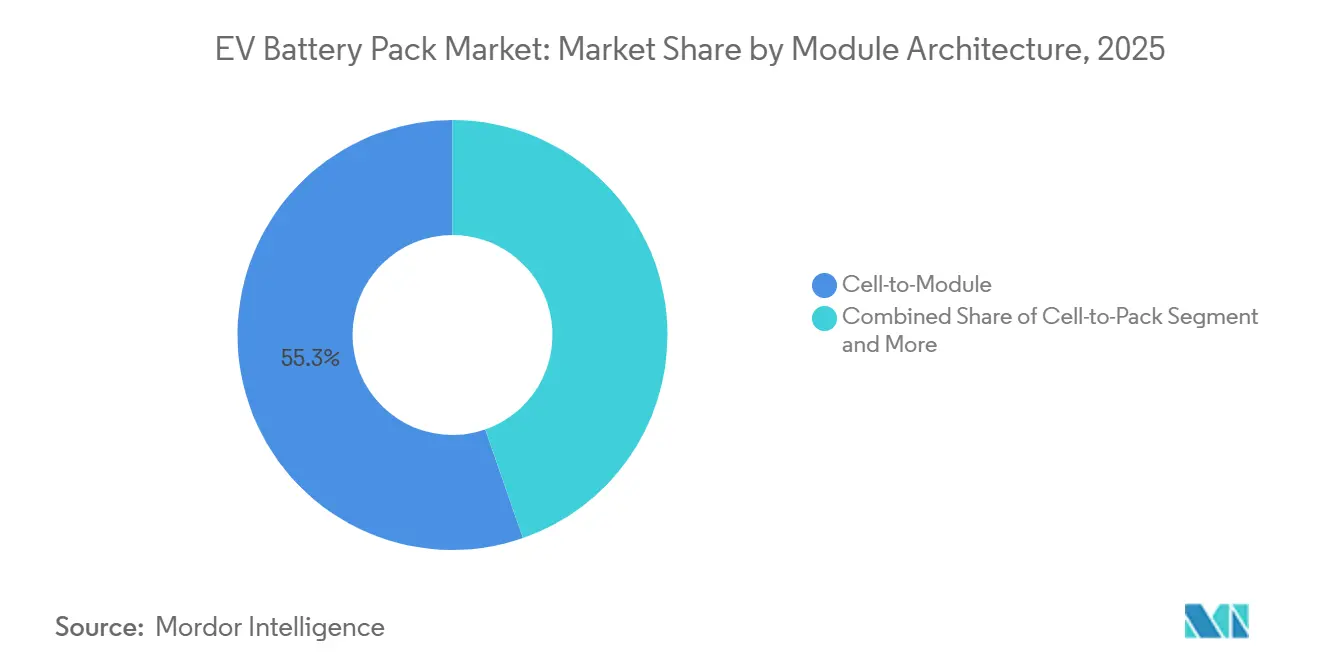
- By module architecture, CTM retained 55.32% of the EV battery pack market share in 2025, whereas CTP platforms record a 9.41% CAGR through 2031.
- By component, cathodes represented 41.12% of EV battery pack market share in 2025; separators show the fastest growth at 9.82% CAGR to 2031.
- Asia-Pacific held 62.39% of the EV battery pack market share by region in 2025; Europe is projected to expand at a 9.12% CAGR through 2031.
Note: Market size and forecast figures in this report are generated using Mordor Intelligence’s proprietary estimation framework, updated with the latest available data and insights as of January 2026.
Market Trends and Insights
Drivers Impact Analysis of EV Battery Pack Market*
| Driver | (~) % Impact on CAGR Forecast | Geographic Relevance | Impact Timeline |
|---|---|---|---|
| Lower Cell Costs | +2.1% | Global, led by Asia-Pacific | Medium term (2-4 years) |
| Gigafactory Expansion | +1.8% | North America and Europe | Long term (≥ 4 years) |
| ZEV Targets | +2.3% | Europe and California, spreading worldwide | Short term (≤ 2 years) |
| Cell-to-Pack Design | +1.5% | Global, pioneered by Chinese OEMs | Medium term (2-4 years) |
| Local Content Rules | +1.4% | North America, Europe, India | Medium term (2-4 years) |
| Second-Life Revenue | +0.9% | Europe and North America | Long term (≥ 4 years) |
| Source: Mordor Intelligence | |||


ZEV Mandates and Increasingly Stringent CO₂ Targets
California’s ACC II requires 100% zero-emission light-duty sales by 2035, while the EU’s Fit-for-55 package demands a 55% fleet-average CO₂ cut by 2030, locking in demand visibility for the EV battery pack market [1]“Advanced Clean Cars II Regulation,”, California Air Resources Board, arb.ca.gov. Automakers face steep penalties for non-compliance, as evidenced by Stellantis’s EUR 1.8 billion fine in 2024, propelling electrification spending. Policymakers are harmonizing measurement through ISO 14064 standards, streamlining reporting across regions. These mandates reduce investor risk, unlocking capital for gigafactories and next-generation chemistries.
Falling Cell Costs From High-Nickel and LFP Chemistries
LFP pack prices dropped 20% in 2024 to USD 115 per kWh, while high-nickel NMC variants fell to USD 110 per kWh, enabling competitive mass-market vehicle pricing and faster uptake in the EV battery pack market. Chinese manufacturers drive this cost curve through integrated supply chains, high utilization rates, and supportive subsidies. Reduced cobalt content in high-nickel cathodes further insulates producers from volatile metals markets. Automakers translate these savings into lower sticker prices without compressing margins, widening the addressable consumer base. ISO 14040 life-cycle assessments are embedded in procurement frameworks, incentivizing chemistries with favorable environmental footprints.
OEM Gigafactory Build-Outs and Vertical Integration
Ford’s USD 11.4 billion multi-site investment targeting 600 GWh annual output by 2026 exemplifies the drive to internalize cell production and secure supply [2]“Ford+ Plan Capital Markets Day,”, Ford Investor Relations, ford.com. Similar strategies at General Motors and Stellantis compress tier-1 supplier roles and allow tighter alignment between cell design and vehicle platforms. Local-content credits in the U.S. Inflation Reduction Act and the EU Green Deal sharpen the cost advantage of domestic plants, steering gigafactory siting decisions. Vertical integration also gives OEMs direct control over intellectual property, safety protocols, and recycling pathways, reinforcing a longer-term shift toward closed-loop value chains in the EV battery pack market.
Cell-To-Pack Architecture Boosts Energy Density
CATL’s Qilin CTP 3.0 reaches 255 Wh/kg and a 1,000 km range, while trimming packs cost 10% compared to module-based designs [3]“CATL 2024 Annual Report,”, Contemporary Amperex Technology, catl.com. BYD’s Blade battery underscores safety gains by eliminating module casings and improving thermal dispersion. Direct cell integration lightens pack weight, freeing chassis space for passengers or cargo. However, it requires sophisticated thermal management and high-precision welding, creating openings for specialized subsystem suppliers. Adoption rates are highest among Chinese OEMs, yet Western manufacturers certify similar architectures for 2027 model launches.
Restraints Impact Analysis of EV Battery Pack Market*
| Restraint | (~) % Impact on CAGR Forecast | Geographic Relevance | Impact Timeline |
|---|---|---|---|
| Mineral Supply Bottlenecks (Li, Co, Ni) | -1.7% | Global, acute in Europe and North America | Short term (≤ 2 years) |
| Cap-Intensive Manufacturing and Low Margins | -1.2% | Emerging markets primarily | Long term (≥ 4 years) |
| Thermal Safety Risks and Recall Exposure | -0.8% | Worldwide, with stricter scrutiny in developed markets | Medium term (2-4 years) |
| Solid-State Roadmaps Delay Legacy Investment | -0.6% | Japan and Europe leading R&D | Long term (≥ 4 years) |
| Source: Mordor Intelligence | |||
Critical-Mineral Supply Bottlenecks (Li, Co, Ni)
Lithium market volatility in early 2024 revealed significant constraints in supply responsiveness. The sharp rise and subsequent easing in prices highlighted the limited elasticity of lithium availability, underscoring ongoing challenges in securing stable inputs for the EV battery pack industry. Over-reliance on the Democratic Republic of Congo for cobalt and on Indonesia and Russia for nickel exposes producers to geopolitical shocks. Automakers are signing direct offtake agreements, pursuing chemical diversification toward LFP and LMFP, and ramping recycling investments to curb primary demand. European and North American cell makers, lacking domestic mines, face the greatest exposure, sometimes absorbing higher feedstock costs that compress margins.
Thermal-Runaway Safety and Recall Risk
GM’s recall of 142,000 Bolt vehicles cost USD 1.9 billion and spotlighted how a single defect can ripple across global operations. UN ECE R100 phase-2 standards and UL 2580 testing protocols now require more rigorous abuse testing, elongating development timelines. Investments in ceramic-coated separators, silicon-carbide power modules, and predictive analytics aim to cut incident rates. Nevertheless, high-energy-density chemistries inherently carry thermal-runaway risk, sustaining cautious pack designs and quality-control overhead in the EV battery pack market.
*Our forecasts treat driver/restraint impacts as directional, not additive. The impact forecasts reflect baseline growth, mix effects, and variable interactions.
EV Battery Pack Market Segment Analysis
By Vehicle Type:
Commercial Fleets Drive ElectrificationThe segment secured 69.16% of the EV battery pack market share in 2025 through passenger-car volumes, but medium- and heavy-duty trucks will outpace all categories at a 9.98% CAGR to 2031. Light-duty vans for last-mile delivery and e-buses for public transit accelerate adoption in regions where zero-emission zones and toll exemptions directly lower operating costs.
Fleet operators cite fuel savings and maintenance cuts versus diesel vehicles, tipping the total cost of ownership in favor of electrification. Long-haul trucking adoption remains gated by charging infrastructure, yet dedicated depot charging and megawatt-level connectors are narrowing the gap. Europe’s 2025 CO₂ standards for heavy-duty vehicles and China’s New Energy Vehicle quotas anchor demand forecasts, ensuring stable volume growth within the EV battery pack market.


By Propulsion Type:
BEV Dominance SolidifiesBattery electric platforms covered 81.62% of 2025 demand and are set to rise at a 10.16% CAGR, underpinning BEVs' growing weight in the EV battery pack market. Improved energy density and broader charging coverage erode the residual appeal of plug-in hybrids, whose share is forecast to contract as incentive structures pivot toward zero-tailpipe-emission compliance.
China and Europe exemplify the shift as subsidies emphasize pure electric range thresholds. Tesla’s product strategy further sidelines hybrids, pressuring incumbents to allocate R&D budgets toward 800 V BEV architectures that future-proof charging performance. Compliance alignment with ISO 26262 functional-safety milestones becomes critical as BEV control systems converge with autonomous-driving feature sets.
By Battery Chemistry:
LMFP Disrupts NMC HegemonyNMC held 52.09% share in 2025, yet LMFP is projected to register the fastest 10.52% CAGR, reshaping chemistry preferences within the EV battery pack market. LMFP couples LFP’s cost and safety profile with Mn-assisted energy density improvements, crossing the 190 Wh/kg threshold that meets mainstream range needs.
Tesla’s 2024 rollout validates large-scale manufacturability and signals reliable supply chains. High-nickel NMC variants remain indispensable for premium and performance models that target >600 km ranges, although raw-material volatility raises cost headwinds. LFP sustains strong pull in commercial vehicles where cycle life and safety trump density, while sodium-ion chemistries move from pilot to early-commercial phases for stationary storage.
By Capacity:
High-Capacity Packs Gain MomentumThe 40-60 kWh band retained 37.28% share in 2025, reflecting cost-optimized crossovers and compact SUVs. Yet the 100-150 kWh segment will advance at a 9.71% CAGR as premium SUVs and long-haul trucks demand extended ranges, enriching the EV battery pack market.
Consumer range expectations inch upward, particularly in North America, where average daily commutes run longer. Automakers are adding high-capacity trims that command premium pricing, balancing pack cost increases with revenue gains. Energy-density advances let higher-kWh packs fit existing chassis envelopes, softening the weight penalty and preserving payload.
By Battery Form:
Cylindrical Cells ResurgePrismatic formats led with 46.46% share in 2025, but cylindrical cells will climb at 9.28% CAGR through 2031, buoyed by structural pack designs built around 4680 and next-generation large-format cells. Cylinders support high-speed line automation and consistent quality, expanding gross-margin headroom.
Prismatic cells remain favored by Chinese OEMs for packaging flexibility and simpler busbar layouts. Pouch cells retain niches in performance EVs where low stack height enhances aerodynamics but face greater swelling and thermal-runaway management complexity. The form-factor mix therefore converges around application-specific trade-offs in volumetric efficiency versus mechanized throughput across the EV battery pack market.
By Voltage Class:
High-Voltage Transition AcceleratesBelow-400 V architectures held 63.41% share in 2025; 600-800 V systems will record a 9.16% CAGR, reflecting the quest for 15-minute, sub-10%-to-80% fast charging. High-voltage platforms cut copper mass, boost inverter efficiency, and enable thinner cables, improving overall vehicle weight distribution.
Silicon-carbide MOSFETs and advanced coolant plates remain supply-constrained, tempering near-term penetration. Early adopters like Porsche and Hyundai Motor Group validate cost-benefit trade-offs, prompting mid-size brands to commit to 800 V rollouts from 2027 onward. Above-800 V exploration continues for heavy trucks and aviation prototypes within the EV battery pack market.
By Module Architecture:
CTP Integration AdvancesCTM still accounted for 55.32% share in 2025, yet CTP integration will rise at a 9.41% CAGR, compressing bill-of-materials cost by eliminating module frames. Mass adoption depends on advanced fire-proof foams, precision cell bonding, and robust crashworthiness testing.
Chinese OEMs harness in-house tooling advantages, while European and North American peers phase in CTP after completing homologation cycles. Module-to-pack (MTP) serves as an interim step, offering some energy-density gains without dismantling existing supply contracts. The shift reshapes aluminum extrusion and thermal-interface material demand across the EV battery pack market.
By Component:
Separator Innovation Drives GrowthCathodes represented 41.12% of component spend in 2025, but separators will expand at 9.82% CAGR as ceramic-coated films gain favor for thermal-runaway mitigation. Separator upgrades unlock higher charge rates while extending cycle life, directly improving residual value for second-life applications.
Anode evolution toward silicon-enhanced graphite raises swelling management and binder durability challenges. Electrolytes are trending toward flame-retardant additives and early solid-state hybrids that reduce flammability. Component suppliers increasingly collaborate in consortia to balance material compatibility, accelerating ecosystem learning curves within the EV battery pack market.
Geography Analysis
APAC EV Battery Pack Market
Asia-Pacific dominated the EV battery pack market with 62.39% share in 2025 thanks to China’s cradle-to-grave supply chain that integrates mineral refining, cell production, and vehicle assembly. Subsidies, high domestic demand, and tightly knit logistics minimize landed costs. Japan contributes solid-state R&D prowess, while South Korea excels in premium high-nickel chemistries, completing a diversified regional cluster that supports both economy and performance segments.
Europe EV Battery Pack Market
Europe is the fastest-growing geography at a 9.12% CAGR through 2031 as Fit-for-55 regulations, the Green Deal, and the European Battery Alliance direct public and private capital toward domestic gigafactories. Germany and Sweden lead capacity additions, leveraging renewable-energy grids to cut scope-2 emissions and satisfy EU taxonomy criteria. Local-content rules trigger joint ventures between automakers and cell specialists, building resilience against external supply disruptions and underpinning a sustainable growth path for the EV battery pack market.
North America EV Battery Pack Market
North America shows steady momentum under the Inflation Reduction Act, which ties tax credits to regionally sourced materials and manufacturing. The United States accelerates gigafactory groundbreakings in Michigan, Kentucky, and Tennessee, while Canada promotes mining incentives for nickel and cobalt. Mexico emerges as a cost-competitive assembly hub that meets USMCA content thresholds. Successful execution of these initiatives will determine whether the region can capture a larger slice of the EV battery pack market by decade-end.

Competitive Landscape
The EV battery pack market is characterized by intense competition among major players like CATL, LG Energy Solution, BYD, SK Innovation, and Samsung SDI. CATL leverages technical leadership in CTP and high-manganese chemistries to defend share, while BYD uses vertical integration from cell to vehicle to maximize margin retention. South Korean suppliers focus on high-nickel variants for premium European OEMs, positioning themselves as technology leaders.
Traditional automakers are eroding supplier dominance by building in-house plants or equity-linked joint ventures. Ford, General Motors, and Stellantis announced more than 700 GWh planned capacity, positioning themselves as formidable entrants by 2030. Intellectual-property disputes are growing as patents around dry-electrode coating, fast-charging protocols, and silicon-anode formulations multiply, making IP strategy a central competitive weapon in the EV battery pack market.
QuantumScape, Solid Power, and Northvolt start-ups pursue solid-state breakthroughs that could disrupt incumbent chemistries, though commercialization timelines remain uncertain. Meanwhile, raw-material suppliers seek off-take agreements that embed price floors, shifting bargaining leverage upstream. Marine, aviation, and grid applications provide white-space opportunities where specialized safety and energy-density requirements create barriers for generalist cell makers.
EV Battery Pack Industry Leaders
BYD Company Ltd.
Contemporary Amperex Technology Co. Ltd. (CATL)
LG Energy Solution Ltd.
Samsung SDI Co. Ltd.
SK Innovation Co. Ltd.
- *Disclaimer: Major Players sorted in no particular order
EV Battery Pack Market Companies Covered in this Report
- Contemporary Amperex Technology Co. Ltd.
- BYD Company Ltd.
- LG Energy Solution Ltd.
- Panasonic Holdings Corp.
- Samsung SDI Co. Ltd.
- SK Innovation (Co. Ltd.)
- Envision AESC Ltd.
- EVE Energy Co. Ltd.
- Primearth EV Energy Co. Ltd.
- Guoxuan High-Tech (Gotion)
- Farasis Energy (Ganzhou) Co. Ltd.
- SVOLT Energy Technology
- China Aviation Battery (CALB)
- Toshiba Corp.
- Northvolt AB
- Automotive Cells Company (SE)
- Hitachi Astemo Battery Systems
- Microvast Holdings Inc.
- Energy Absolute (Amita)

Recent Industry Developments in EV Battery Pack Market
- September 2025: CATL has launched Shenxing Pro, the world's first lithium iron phosphate (LFP) battery. This innovative battery boasts the ability to maintain a high voltage supply, retain power, and operate without fire or smoke even after a thermal runaway. Tailored for Europe's e-mobility demands, Shenxing Pro redefines standards in safety, longevity, driving range, and ultra-fast charging. This positions it as the premier choice for Europe's burgeoning electric vehicle (EV) market.


Global EV Battery Pack Market Report Scope
The EV Battery Pack Market Report is Segmented by Vehicle Type (Passenger Car, and More), Propulsion Type (BEV, and More), Battery Chemistry (LFP, and More), Capacity (Less Than 15 KWh, and More), Battery Form (Cylindrical, and More), Voltage Class (Below 400V, and More), Module Architecture (CTM, and More), Component (Anode, Cathode, and More) and Geography. Market Forecasts are Provided in Terms of Value (USD).
Segmentation Overview
By Vehicle Type
| Passenger Car |
| Light Commercial Vehicle |
| Medium and Heavy Duty Truck |
| Bus |
By Propulsion Type
| Baterry Electric Vehicle |
| Plug-in Hybrid Electric Vehicle |
By Battery Chemistry
| LFP |
| LMFP |
| NMC (111/523/622/712/811) |
| NCA |
| LTO |
| Others |
By Capacity
| Below 15 kWh |
| 15-40 kWh |
| 40-60 kWh |
| 60-80 kWh |
| 80-100 kWh |
| 100-150 kWh |
| Above 150 kWh |
By Battery Form
| Cylindrical |
| Pouch |
| Prismatic |
By Voltage Class
| Below 400 V (48-350 V) |
| 400-600 V |
| 600-800 V |
| Above 800 V |
By Module Architecture
| Cell-to-Module (CTM) |
| Cell-to-Pack (CTP) |
| Module-to-Pack (MTP) |
By Component
| Anode |
| Cathode |
| Electrolyte |
| Separator |
By Geography
| North America | United States |
| Canada | |
| Rest of North America | |
| South America | Brazil |
| Argentina | |
| Rest of South America | |
| Europe | Germany |
| United Kingdom | |
| France | |
| Italy | |
| Spain | |
| Rest of Europe | |
| Asia-Pacific | China |
| India | |
| Japan | |
| South Korea | |
| Rest of Asia-Pacific | |
| Middle East and Africa | United Arab Emirates |
| Saudi Arabia | |
| South Africa | |
| Turkey | |
| Rest of Middle East and Africa |
| By Vehicle Type | Passenger Car | |
| Light Commercial Vehicle | ||
| Medium and Heavy Duty Truck | ||
| Bus | ||
| By Propulsion Type | Baterry Electric Vehicle | |
| Plug-in Hybrid Electric Vehicle | ||
| By Battery Chemistry | LFP | |
| LMFP | ||
| NMC (111/523/622/712/811) | ||
| NCA | ||
| LTO | ||
| Others | ||
| By Capacity | Below 15 kWh | |
| 15-40 kWh | ||
| 40-60 kWh | ||
| 60-80 kWh | ||
| 80-100 kWh | ||
| 100-150 kWh | ||
| Above 150 kWh | ||
| By Battery Form | Cylindrical | |
| Pouch | ||
| Prismatic | ||
| By Voltage Class | Below 400 V (48-350 V) | |
| 400-600 V | ||
| 600-800 V | ||
| Above 800 V | ||
| By Module Architecture | Cell-to-Module (CTM) | |
| Cell-to-Pack (CTP) | ||
| Module-to-Pack (MTP) | ||
| By Component | Anode | |
| Cathode | ||
| Electrolyte | ||
| Separator | ||
| By Geography | North America | United States |
| Canada | ||
| Rest of North America | ||
| South America | Brazil | |
| Argentina | ||
| Rest of South America | ||
| Europe | Germany | |
| United Kingdom | ||
| France | ||
| Italy | ||
| Spain | ||
| Rest of Europe | ||
| Asia-Pacific | China | |
| India | ||
| Japan | ||
| South Korea | ||
| Rest of Asia-Pacific | ||
| Middle East and Africa | United Arab Emirates | |
| Saudi Arabia | ||
| South Africa | ||
| Turkey | ||
| Rest of Middle East and Africa | ||


Market Definition
- Battery Chemistry - Various types of battery chemistry considred under this segment include LFP, NCA, NCM, NMC, Others.
- Battery Form - The types of battery forms offered under this segment include Cylindrical, Pouch and Prismatic.
- Body Type - Body types considered under this segment include, passenger cars, LCV (light commercial vehicle), M&HDT (medium & heavy duty trucks)and buses.
- Capacity - Various types of battery capacities inldude under theis segment are 15 kWH to 40 kWH, 40 kWh to 80 kWh, Above 80 kWh and Less than 15 kWh.
- Component - Various components covered under this segment include anode, cathode, electrolyte, separator.
- Material Type - Various material covered under this segment include cobalt, lithium, manganese, natural graphite, nickel, other material.
- Method - The types of method covered under this segment include laser and wire.
- Propulsion Type - Propulsion types considered under this segment include BEV (Battery electric vehicles), PHEV (plug-in hybrid electric vehicle).
- ToC Type - ToC 1
- Vehicle Type - Vehicle type considered under this segment include passenger vehicles, and commercial vehicles with various EV powertrains.
| Keyword | Definition |
|---|---|
| Electric vehicle (EV) | A vehicle which uses one or more electric motors for propulsion. Includes cars, buses, and trucks. This term includes all-electric vehicles or battery electric vehicles and plug-in hybrid electric vehicles. |
| PEV | A plug-in electric vehicle is an electric vehicle that can be externally charged and generally includes all electric vehicles as well as plug-electric vehicles as well as plug-in hybrids. |
| Battery-as-a-Service | A business model in which the battery of an EV can be rented from a service provider or swapped with another battery when it runs out of charge |
| Battery Cell | The basic unit of an electric vehicle's battery pack, typically a lithium-ion cell, that stores electrical energy. |
| Module | A subsection of an EV battery pack, consisting of several cells grouped together, often used to facilitate manufacturing and maintenance. |
| Battery Management System (BMS) | An electronic system that manages a rechargeable battery by protecting the battery from operating outside its safe operating area, monitoring its state, calculating secondary data, reporting data, controlling its environment, and balancing it. |
| Energy Density | A measure of how much energy a battery cell can store in a given volume, usually expressed in watt-hours per liter (Wh/L). |
| Power Density | The rate at which energy can be delivered by the battery, often measured in watts per kilogram (W/kg). |
| Cycle Life | The number of complete charge-discharge cycles a battery can perform before its capacity falls under a specified percentage of its original capacity. |
| State of Charge (SOC) | A measurement, expressed as a percentage, that represents the current level of charge in a battery compared to its capacity. |
| State of Health (SOH) | An indicator of the overall condition of a battery, reflecting its current performance compared to when it was new. |
| Thermal Management System | A system designed to maintain optimal operating temperatures for an EV's battery pack, often using cooling or heating methods. |
| Fast Charging | A method of charging an EV battery at a much faster rate than standard charging, typically requiring specialized charging equipment. |
| Regenerative Braking | A system in electric and hybrid vehicles that recovers energy normally lost during braking and stores it in the battery. |


Research Methodology
Mordor Intelligence follows a four-step methodology in all its reports.
- Step-1: Identify Key Variables: To build a robust forecasting methodology, the variables and factors identified in Step-1 are tested against available historical market numbers. Through an iterative process, the variables required for market forecast are set and the model is built based on these variables.
- Step-2: Build a Market Model: Market-size estimations for the historical and forecast years have been provided in revenue and volume terms. Market revenue is calculated by multiplying the volume demand with volume-weighted average battery pack price (per kWh). Battery pack price estimation and forecast takes into account various factors affecting ASP, such as inflation rates, market demand shifts, production costs, technological developments, and consumer preferences, providing estimations for both historical data and future trends.
- Step-3: Validate and Finalize: In this important step, all market numbers, variables, and analyst calls are validated through an extensive network of primary research experts from the market studied. The respondents are selected across levels and functions to generate a holistic picture of the market studied.
- Step-4: Research Outputs: Syndicated Reports, Custom Consulting Assignments, Databases & Subscription Platforms


