India E-waste Management Market Size and Share
Market Overview
| Study Period | 2020 - 2031 |
|---|---|
| Forecast Data Period | 2026 - 2031 |
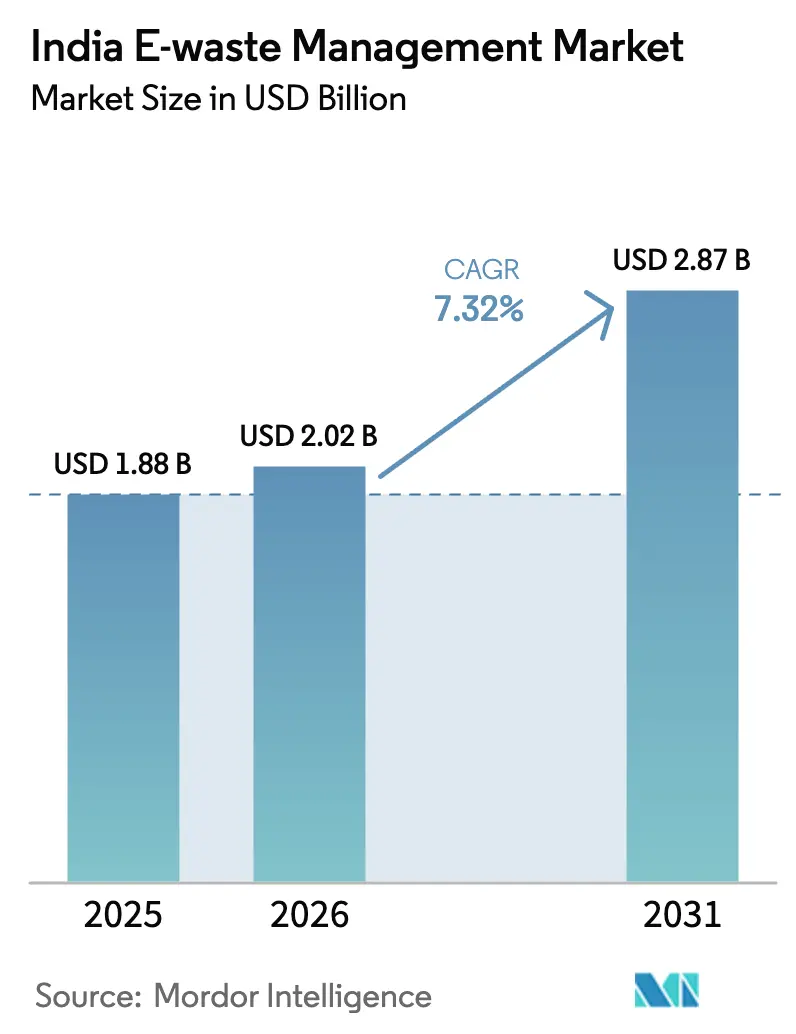
| Base Year Market Size (2025) | USD 1.88 Billion |
| Market Size (2026) | USD 2.02 Billion |
| Market Size (2031) | USD 2.87 Billion |
| Growth Rate (2026 - 2031) | 7.32% CAGR |
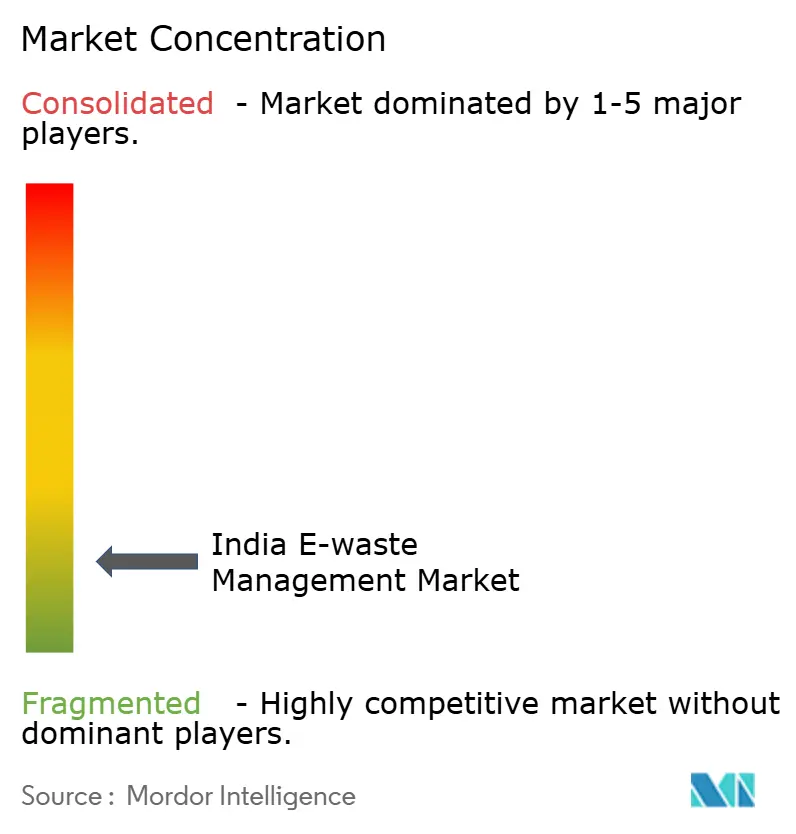
| Market Concentration | Low |
Major Players *Disclaimer: Major Players sorted in no particular order Image © Mordor Intelligence. Reuse requires attribution under CC BY 4.0. | |
India E-waste Management Market Analysis by Mordor Intelligence
The India E-waste Management Market size was valued at USD 1.88 billion in 2025 and estimated to grow from USD 2.02 billion in 2026 to reach USD 2.87 billion by 2031, at a CAGR of 7.32% during the forecast period (2026-2031). Heightened enforcement of the E-Waste(Management) Rules 2022 is driving formalization by shifting recycling costs to producers through 60% mandatory targets and environmental compensation penalties, expanding the value of tradable EPR certificates. Rising device turnover, particularly smartphones and IT hardware in Tier-2 and Tier-3 cities, adds fresh scrap volumes, while precious-metal recovery economics are buoyed by gold and palladium price trends that make hydrometallurgy commercially attractive. Input-credit provisions under the Goods and Services Tax (GST) have started to widen the cost gap between compliant recyclers and informal handlers, stimulating new plant investments. At the same time, corporate ESG disclosures under SEBI’s Business Responsibility and Sustainability Report (BRSR) framework are institutionalising certified disposal practices across the technology, BFSI, and manufacturing sectors[1]Ministry of Environment Forest & Climate Change, “E-Waste (Management) Rules 2022,” Government of India, moef.gov.in.
Key Report Takeaways
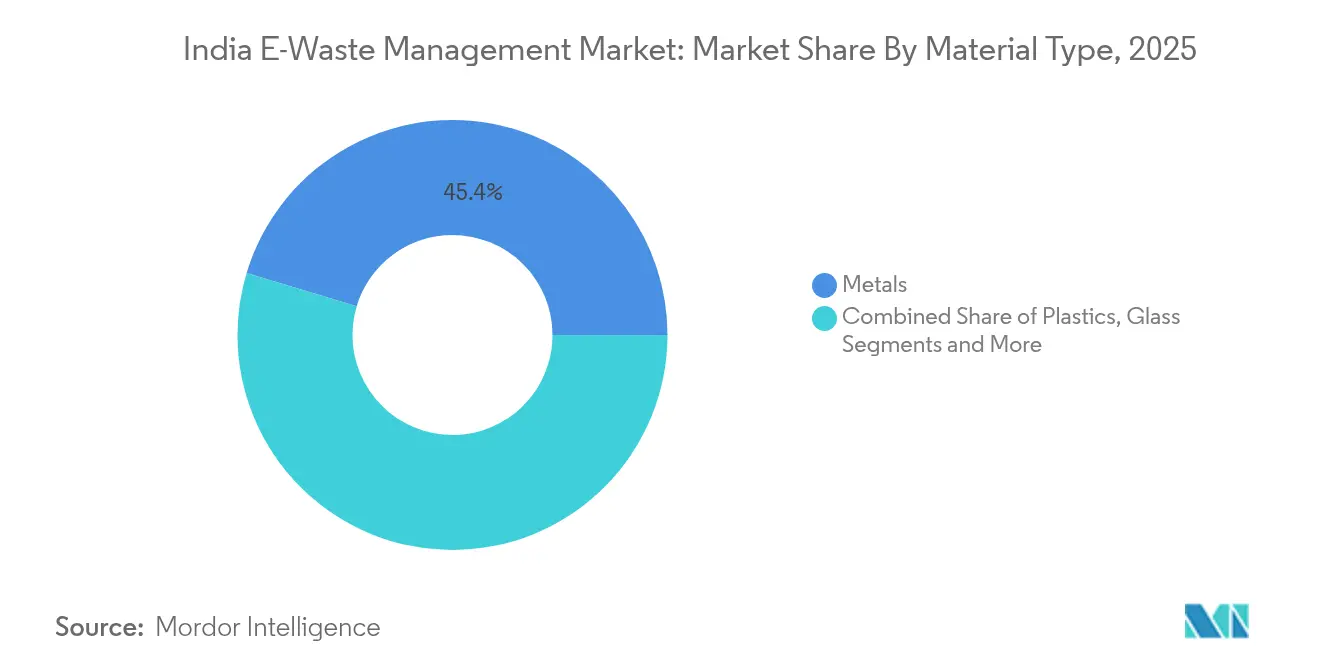
- By material type, metals held 45.35% of the India e-waste management market share in 2025, while plastics are projected to post the fastest 7.85% CAGR through 2031.
- By source, consumer electronics accounted for 37.25% of the India e-waste management market size in 2025; industrial equipment is poised to expand at an 8.45% CAGR to 2031.
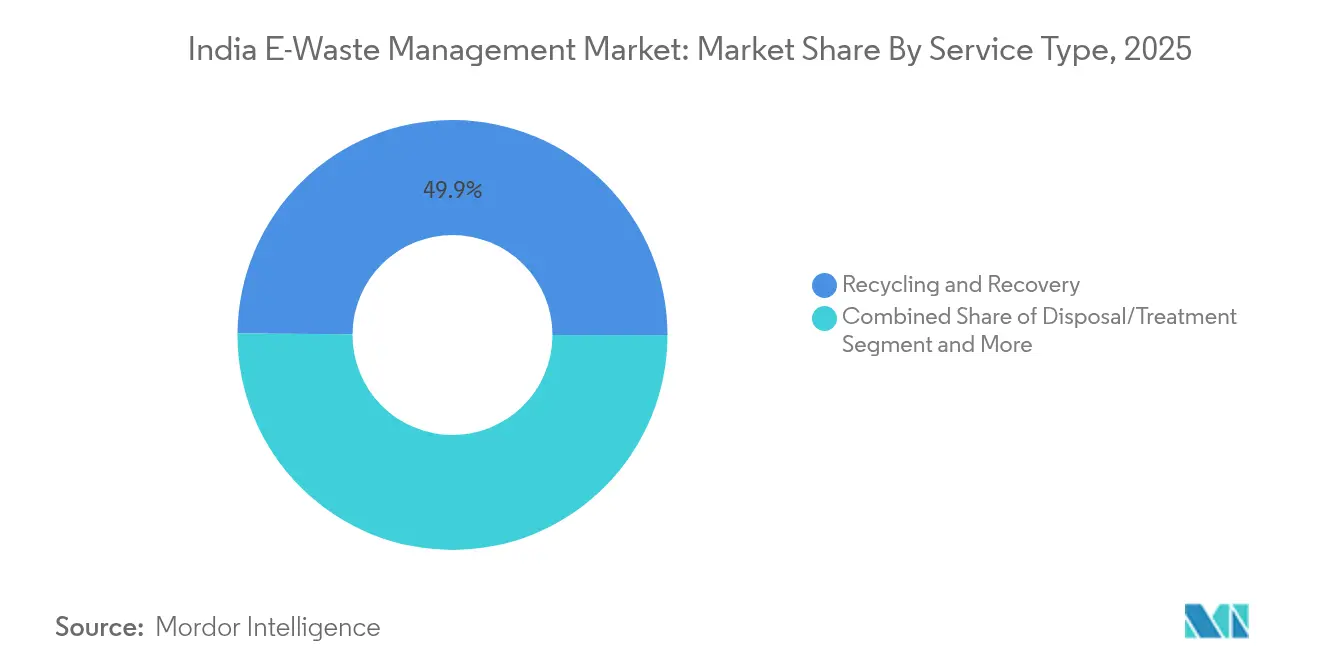
- By service type, recycling and recovery dominated with 49.88% revenue share in 2025, whereas hydrometallurgy is expected to lead growth at a 8.74% CAGR.
- By geography, West India led with a 28.55% share of the India e-waste management market in 2025, while North India is forecast to register the highest 8.3% CAGR during 2026-2031.
Note: Market size and forecast figures in this report are generated using Mordor Intelligence’s proprietary estimation framework, updated with the latest available data and insights as of 2026.
Competitive positioning in India includes both locally based firms and those operating across multiple regions. The market landscape in the global e-waste management industry research shows how these players are arranged internationally.
India E-waste Management Market Trends and Insights
Drivers Impact Analysis*
| Driver | (~) % Impact on CAGR Forecast | Geographic Relevance | Impact Timeline |
|---|---|---|---|
| Enforced EPR targets under E-Waste Rules 2022 | +2.1% | National; strongest in Maharashtra, Gujarat, Karnataka | Medium term (2–4 years) |
| Rapid smartphone & IT device replacement in Tier-2/3 cities | +1.8% | North & Central India; spill-over to East India | Long term (≥ 4 years) |
| Stronger precious-metal price cycle | +1.3% | West & South India processing hubs | Short term (≤ 2 years) |
| GST input-credit advantages for formal recyclers | +0.9% | Industrial states nationwide | Medium term (2–4 years) |
| Corporate ESG mandates for certified disposal | +0.8% | South & West India IT corridors | Medium term (2–4 years) |
| E-commerce doorstep take-back programmes | +0.7% | Urban centres pan-India | Short term (≤ 2 years) |
| Source: Mordor Intelligence | |||
Enforced EPR Targets under E-Waste Rules 2022
Mandatory 60% recycling obligations introduced in 2023 created a USD 65 million annual EPR-certificate market, compelling producers to contract accredited recyclers and elevating compliance costs that favour organized players. Between 2021 and 2024, authorised capacity expanded from 1.1 million tonnes to 1.8 million tonnes as capital flowed into new plants. The framework now spans 106 product categories, including solar PV panels and EV batteries, broadening future feedstock visibility. Multiple trading platforms have reduced certificate-price volatility, yet market participants remain cautious about data-verification risks. The net result is accelerated consolidation as smaller dismantlers seek alliances or exit rather than finance environmental upgrades.
Rapid Smartphone & IT Device Replacement in Tier-2/3 Cities
Tier-2/3 locations contributed 70% of smartphone sales growth in 2024, with replacement cycles shortening to 2-3 years amid 5G adoption. These areas now generate dispersed e-waste streams that demand regionally distributed collection depots. Household scrap accounts for 70% of India’s 3.8 million-tonne annual volumes, stretching reverse-logistics networks whose costs run 40-60% higher outside metros. Simultaneously, fintech proliferation is driving POS terminal turnover, while rural mechanisation embeds electronics in agricultural equipment, enlarging the waste footprint beyond cities. Forward-looking recyclers are piloting micro-hubs near consumption clusters to control transport expense and boost collection yields[2]Rohit Gupta, “Wireless Data Usage Trends 2024,” Telecom Regulatory Authority of India, trai.gov.in.
Stronger Precious-Metal Price Cycle
Gold in PCBs averages 250-300 g/t, 60-fold natural-ore grades, so rising bullion and palladium prices have lifted recovery margins; precious metals now supply over 80% of revenue from under 2% of e-waste mass. Hydrometallurgical plants in Pune and Bangalore report 93% copper and near-total gold recovery at lower emissions than smelting. Bio-leaching using thiosulphate further cuts hazardous residues, aligning with buyer ESG audits. Elevated returns justify small-scale, decentralised reactors that slash feedstock transport costs and serve hinterland generators.
GST Input-Credit Advantages for Formal Recyclers
The 18% GST rate originally squeezed informal scrap margins, but reverse-charge and input-credit provisions now let compliant recyclers reclaim tax on incoming waste and consumables, trimming net material costs 12-15%. Transparent invoicing has drawn larger quantities into traceable channels, bolstering certificate authenticity under EPR audits. Formal plants leverage the liquidity gain to upgrade to automated shredding, optical sorting, and zero-discharge effluent systems, widening their competitive moat over informal handlers.
Restraints Impact Analysis*
| Restraint | (~) % Impact on CAGR Forecast | Geographic Relevance | Impact Timeline |
|---|---|---|---|
| Dominant informal sector diverting >60% of feedstock | -2.3% | Delhi, Mumbai, Bangalore clusters | Long term (≥ 4 years) |
| High capex & GST burden on secondary metals | -1.6% | West & South India industrial zones | Medium term (2–4 years) |
| Inefficient reverse-logistics from rural & North-East regions | -1.0% | North-East states; low-density rural belts | Long term (≥ 4 years) |
| Consumer data-privacy concerns limiting voluntary returns | -0.7% | Urban metros with high enterprise IT stock | Short term (≤ 2 years) |
| Source: Mordor Intelligence | |||
Dominant Informal Sector Diverting More Than 60% of Feedstock
Informal handlers still process 60-65% of national e-waste, leveraging cash purchases, minimal overheads, and entrenched street-level networks that formal recyclers struggle to match on collection price. Clusters like Delhi’s Mandoli employ specialised labour with hand-dismantling skills capable of 70-80% material recovery, albeit through hazardous methods. Consumer habits reinforce the challenge: 35% of households sell to kabadiwalas, while 21% discard electronics with regular trash, undermining organised throughput. Policy initiatives that integrate rather than displace informal actors, such as licensed aggregation hubs or skill-upgrade grants, show early promise in bridging the supply gap.
High Capex & GST on Secondary Metals Curtailing Advanced Recovery
Commercial-scale hydrometallurgical plants require USD 50-100 million in upfront investment, a hurdle that lengthens payback when feedstock inflow is uncertain. An 18% GST on recovered metals erodes margins for compliant operators, while informal smelters evade both taxation and environmental permitting, undercutting formal purchase prices. Lengthy clearance cycles add 12-18 months to project timelines, exposing investors to policy shifts. Joint ventures with foreign technology licensors are emerging, yet risk-sharing arrangements remain complex in India’s rapidly evolving regulatory climate.
*Our forecasts treat driver/restraint impacts as directional, not additive. The impact forecasts reflect baseline growth, mix effects, and variable interactions.
Segment Analysis
By Material Type: Metals Anchor Value Recovery
Metals captured 45.35% of the India E-waste Management Market share in 2025, underpinned by the high intrinsic worth of gold, palladium, and copper in printed circuit boards. Hydrometallurgical refiners now achieve 93% copper and 100% precious-metal yields, while automated shredding and optical sorting raise throughput and lower manual-handling risks. The pursuit of near-total recovery dovetails with zero-discharge acid-recycling circuits that cut chemical consumption and wastewater load. Plastics, though lighter, are forecast to post the fastest 7.85% CAGR to 2031 as flame-retardant polymer recycling technologies mature. Pyrolysis combined with ultrasonication segregates brominated ABS, PC, and HIPS into reusable grades, opening circular feedstock for domestic electronics moulders.
Parallel innovation is unfolding in bio-leaching, where thiosulphate microbes extract gold without cyanide, improving worker safety and meeting export-market compliance audits. Glass now contributes marginal value as CRT volumes wane, yet niche lead-glass recovery endures through refurbishing labs that serve Africa and Latin America. Emerging “other” materials, rare-earth magnets, ceramics, and composite laminates—are attracting R&D grants under the USD 180 million critical-minerals recycling incentive, positioning India for strategic autonomy in EV and renewable supply chains.


By Source: Industrial Equipment Gains Momentum
Consumer electronics dominated 2025 by accounting for 37.25% of the India e-waste management market size, driven by smartphones, laptops, and TVs that supply high-value PCBs and cobalt-rich batteries. However, industrial equipment is forecast to grow at 8.45% CAGR on the back of Industry 4.0 retrofits and data-centric production lines across automotive, pharmaceuticals, and textiles. Factory controllers, sensors, and drives reaching end-of-service deliver bulkier boards with elevated gold-plated connectors and thick copper busbars, enhancing recycling margins. IoT adoption in farm machinery and cold-chain logistics further broadens the industrial stream.
Medical-device scrap and telecom infrastructure components demand certified handling for data-security and safety reasons, raising averaging-fee realisations for licensed plants. EV batteries are entering recovery pipelines as adoption widens, prompting recyclers to pilot lithium-nickel-cobalt-manganese (NCM) cathode extraction cells in Karnataka and Gujarat. Solar modules manufactured in the early 2000s commence end-of-life from 2025 onward, spawning nascent silicon and silver recovery niches that existing e-waste players plan to tap via glass-laminate delamination lines.
By Service Type: Hydrometallurgy Sets the Pace
Recycling and recovery services collectively secured 49.88% revenue share in 2025, underscoring the economic concentration at the material-extraction stage of the India e-waste management market. Hydrometallurgy, projected to clock a 8.74% CAGR to 2031, is the standout sub-segment thanks to selective leaching that minimises dioxin emissions and energy needs versus smelting. Zero-discharge circuits recycle acids, filter residues, and evaporate process water, shrinking environmental-compliance costs. Mechanical pre-processing remains relevant for size reduction and ferrous separation, but is increasingly automated through AI-powered vision systems that improve PCB capture rates and purity.
Collection and logistics margins are under strain given reverse-haul inefficiencies, yet e-commerce alliances deliver a viable route to household inventories. Refurbishment and reuse services are also rising as circular-procurement mandates push governments and corporations to favour remanufactured devices; Flipkart’s exchange initiative already feeds repair lines in Delhi and Bangalore. Complementary battery-deactivation and data-wiping offerings create higher-value, compliance-centric bundles that formal recyclers leverage to differentiate from informal counterparts.
Geography Analysis
West India led the India e-waste management market with a 28.55% share in 2025, supported by Maharashtra’s electronics-manufacturing density, Gujarat’s metallurgical clusters, and seamless port access for cross-border material flows. Mumbai’s BFSI sector refreshes servers every three years, while Pune’s auto-tech ecosystem supplies a diverse stream of control systems and infotainment units. Yet formal processing captured less than 1% of Maharashtra’s generated volumes, leaving ample headroom for authorised plants now being set up near Navi Mumbai chemical hubs. GST credits and a dedicated “electronics park” policy are expected to nudge collection toward organised channels.
North India is projected to log the fastest 8.3% CAGR through 2031 on stronger policy enforcement by the Central Pollution Control Board and aggressive agricultural-equipment electrification in Punjab. Delhi’s National Capital Region mandates EPR audit submission for government tenders, stimulating recycler-producer partnerships that guarantee offtake. Haryana’s emerging electronics-manufacturing corridor around Manesar supplies additional feedstock and encourages the co-location of dismantling units. Regional logistics advantages, such as dedicated freight corridors linking Delhi to Mumbai and Kolkata further reduce back-haul costs and support hub-and-spoke collection.
South India maintains steady advances underpinned by Bangalore’s IT concentration, Chennai’s electronics exports, and Andhra Pradesh’s industrial corridors that reserve land for e-waste facilities. Karnataka extended power-tariff rebates to recyclers meeting zero-liquid-discharge benchmarks, trimming opex for hydrometallurgical lines. Conversely, East India struggles with infrastructure gaps: long-haul transport to authorised plants in Odisha or Kolkata can add 18-25% to collection costs, perpetuating informal recycling dominance. State incentives for rail-based scrap shipments are under discussion to close this structural divide.
Mordor Intelligence tracks the e-waste management market across other major regions such as North America, Europe, and Asia, with additional country-level coverage spanning United Arab Emirates, each reflecting localized structural drivers, restraints and more.
Competitive Landscape
The India E-waste Management Market is highly fragmented: 595 authorised recyclers operate across 22 states with a combined 1.8 million-tonne nameplate capacity against 3.8 million tonnes of annual generation. Informal operators still outbid formal plants for small-volume lots, although EPR penalties are forcing large OEMs to sign exclusive take-back contracts that guarantee feedstock supply to licensed facilities. Scale advantages therefore accrue to vertically integrated firms that run collection, dismantling, hydrometallurgy, and material trading under one roof.
Technology partnerships are accelerating differentiation. Mitsui & Co.’s 2024 equity infusion into MTC Business Private Ltd. brings Japanese smelting know-how that lifts precious-metal recovery yields and enables future entry into end-of-life vehicle workstreams. Attero Recycling expanded its Roorkee plant to 150,000 tonnes capacity and installed AI-driven optical separators to raise copper purity above 99.95%, a threshold that secures direct sales to domestic wire-and-cable mills. Re Sustainability is piloting decentralised micro-plants in Tier-2 cities to reduce reverse-logistics costs and serve emerging industrial clusters.
Strategic moves centre on ESG-linked finance: Namo eWaste Management’s oversubscribed NSE SME listing in September 2024 demonstrates investor appetite for circular-economy plays. Firms are bundling certified disposal with carbon-credit consulting to tap multinational decarbonisation budgets. Automation and robotics investments are rising as labour-cost inflation climbs to 10-12% annually in urban centres, making high-throughput optical sorters and robotic arms more attractive for PCB depopulation. Start-ups specialising in blockchain-based traceability are courting OEMs, aiming to de-risk EPR audit exposure.
India E-waste Management Industry Leaders
Attero Recycling Pvt Ltd
Re Sustainability (Ramky Enviro Engineers Ltd)
TES-AMM India Pvt Ltd
Namo E-Waste Management Ltd
E-Parisaraa Pvt Ltd
- *Disclaimer: Major Players sorted in no particular order

Recent Industry Developments
- June 2025: The Indian government cleared a USD 180 million incentive for critical minerals recycling focused on lithium and rare-earth element recovery.
- March 2025: India ranked as the world’s third-largest e-waste generator at 3.8 million tonnes in FY24.
- February 2025: CPCB intensified audits and penalties for E-Waste (Management) Rules 2024 violations, tying fines to restoration funds.
- September 2024: Namo eWaste Management Limited listed on NSE SME at a 90% premium over IPO price.


Research Methodology Framework and Report Scope
Market Definitions and Key Coverage
Mordor Intelligence defines India's e-waste management market as the value generated when end-of-life electrical and electronic equipment is formally collected, transported, dismantled, refurbished, recycled, or safely disposed of within India's regulated ecosystem. The definition captures service revenue from accredited collection networks, logistics partners, pre-treatment facilities, metal and plastic recovery plants, and certified final disposers.
Scope exclusion: Informal backyard processing, unregistered scrap aggregation, and the resale of fully functional second-hand devices are kept outside the study to avoid double counting and gray-market leakage.
Segmentation Overview
- By Material Type
- Metals
- Plastics
- Glass
- Others
- By Source
- IT & Telecommunication Equipment
- Consumer Electronics
- Household Appliances
- Medical Equipment
- Industrial Equipment
- EV Batteries
- Solar PV Panels
- Others (Agricultural Equipment, Curb-side waste, construction, etc.)
- By Service Type
- Collection, Trasportation & Sorting
- Disposal/ Treatment
- Refurbishment & Reuse
- Landfill/ Incineration
- Recycling & Recovery
- Mechanical Separation
- Hydrometallurgical Process
- Pyrometallurgical Process
- Biometallurgical Process
- By Geography
- North India
- South India
- West India
- East India
Detailed Research Methodology and Data Validation
Primary Research
Structured interviews with licensed recyclers, state pollution-control officials, bulk IT asset-disposition providers, and producer-responsibility organizations across West, North, and South India validated recovery efficiencies, average service fees, and likely compliance scenarios that secondary material alone could not reveal.
Desk Research
We began with public datasets that anchor the material flow: annual e-waste generation and collection statistics from the Central Pollution Control Board, import-export codes from the Directorate General of Commercial Intelligence & Statistics, and regional compliance filings published under the E-Waste (Management) Rules 2022. Industry outlook notes from NITI Aayog, Ministry of Electronics & IT production maps, and the Global E-Waste Monitor were then layered in to trace product-in-market volumes and recovery targets.
To enrich pricing and company metrics, analysts tapped D&B Hoovers, Dow Jones Factiva, and patent summaries on Questel, followed by peer-reviewed journals that quantify metal yields from hydrometallurgy and pyrometallurgy routes. The sources listed are illustrative; many additional open-source and paid references informed data checks and narrative clarity.
Market-Sizing & Forecasting
A top-down reconstruction converts national e-waste generation volumes into a serviceable demand pool after applying formal-sector penetration rates and recovery efficiencies. Supplier roll-ups of installed recycling capacity, sampled average service price per kilogram, and channel checks on EPR credit trading act as bottom-up guardrails that fine-tune the totals. Key variables like device replacement cycles, metal price indices, mandatory recycling targets, authorized capacity additions, and GST-linked cost advantages feed a multivariate regression that drives the 2025-2030 forecast. Gaps in bottom-up plant data are bridged with conservative utilization assumptions discussed with field experts.
Data Validation & Update Cycle
Outputs pass a two-step anomaly review where senior analysts compare modeled revenue with independent scrap-metal realizations and certified tonnage. Models refresh every twelve months, and interim updates are triggered when policy amendments or commodity shocks alter economics materially.
Why Mordor's India E-Waste Management Baseline Earns Decision-Maker Confidence
Published estimates often differ because firms mix informal flows, apply divergent service scopes, or lock forecasts to bullish metal-price curves.
Key gap drivers include: some publishers bundle municipal solid-waste services with e-waste, others project aggressive recycler ramp-ups without plant-level verification, while a few freeze currency exchange at announcement-date levels. Mordor's study filters revenues to only accredited operators, calibrates capacity additions against verified environmental-clearance data, and refreshes assumptions annually, which tempers volatility.
Benchmark comparison
| Market Size | Anonymized source | Primary gap driver |
|---|---|---|
| USD 1.88 B (2025) | Mordor Intelligence | - |
| USD 2.96 B (2024) | Regional Consultancy A | Includes allied solid-waste services and assumes full EPR compliance from year one |
| USD 4.14 B (2024) | Global Consultancy B | Applies scrap-value multiplied by total e-waste generated, regardless of formal processing share |
These comparisons show that when scope alignment, verified capacity, and realistic compliance ramps are applied, Mordor Intelligence delivers a balanced, transparent baseline that policymakers and investors can replicate and stress-test with confidence.


Key Questions Answered in the Report
What is the current size of the India e-waste management market?
The India e-waste management market is valued at USD 2.02 billion in 2026.
Which region leads the market today?
West India holds the largest 28.55% share, thanks to its manufacturing density and port infrastructure.
Which segment is growing the fastest?
Industrial equipment e-waste is projected to grow at an 8.45% CAGR between 2026 and 2031.
Why is hydrometallurgy attracting investment?
Hydrometallurgical processes deliver up to 100% precious-metal recovery with lower emissions, supporting a 8.74% CAGR for this service category.
How are EPR rules changing the competitive landscape?
Mandatory 60% recycling targets compel producers to purchase EPR certificates, encouraging long-term contracts with formal recyclers and driving industry consolidation.
What policy incentives exist for critical-mineral recovery?
A new USD 180 million government scheme subsidises lithium and rare-earth recycling, aiming to scale the sector from a dozen firms to roughly 100.
Page last updated on:


