Market Overview
| Study Period | 2019 - 2030 |
|---|---|
| Forecast Data Period | 2025 - 2030 |
| Historical Data Period | 2019 - 2023 |
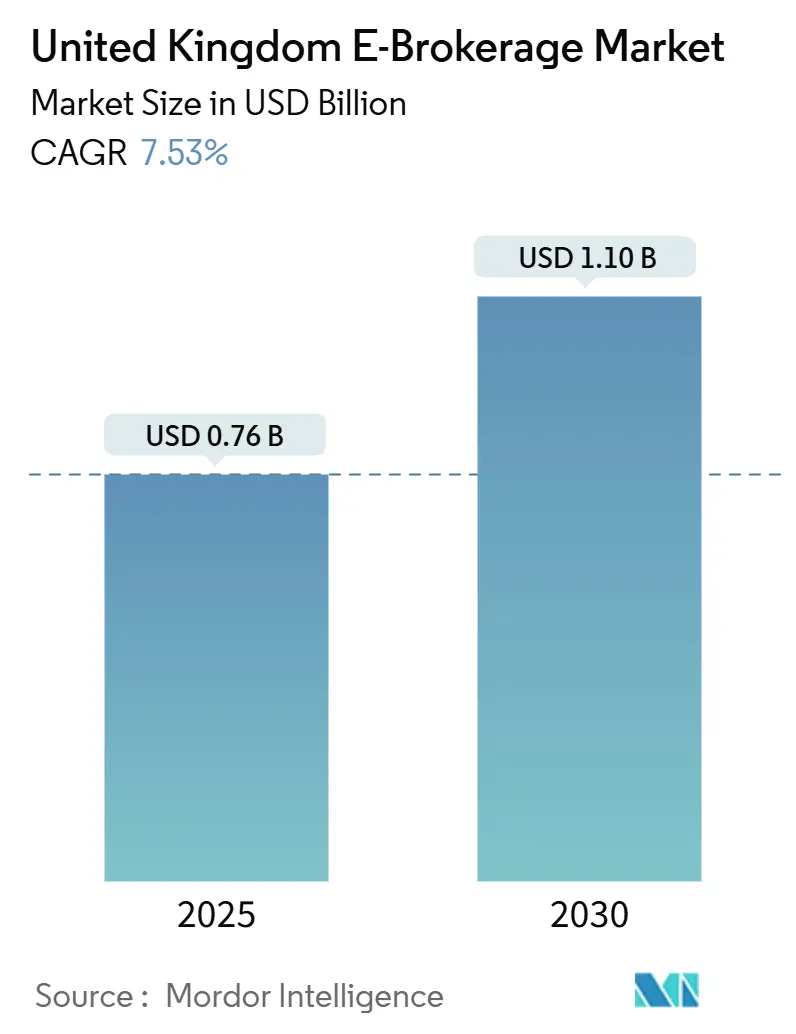
| Market Size (2025) | USD 0.76 Billion |
| Market Size (2030) | USD 1.10 Billion |
| Growth Rate (2025 - 2030) | 7.53% CAGR |
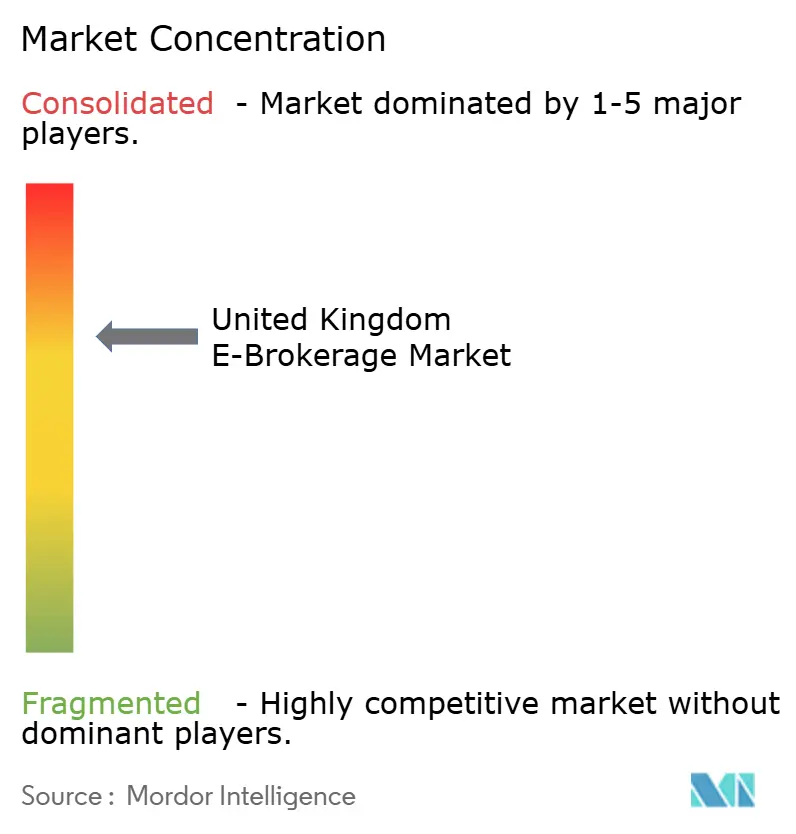
| Market Concentration | Medium |
Major Players *Disclaimer: Major Players sorted in no particular order Image © Mordor Intelligence. Reuse requires attribution under CC BY 4.0. | |
United Kingdom E-Brokerage Market Analysis by Mordor Intelligence
The United Kingdom e-brokerage market size stood at USD 760 million in 2025 and is forecast to climb to USD 1.10 billion by 2030, translating into a 7.53% CAGR over the period. Sustained retail appetite for do-it-yourself investing, the accelerated roll-out of mobile trading apps, and favorable net-interest margins continue to drive the United Kingdom e-brokerage market even as fee competition intensifies. Discount brokers now capture most new account openings, indicating that technology-led convenience outweighs legacy brand recognition for most first-time investors. Platform differentiation is shifting from headline commission rates to depth of product line, strength of digital tools, and clarity of user experience, particularly in account aggregation and tax-wrapper flexibility. Higher Bank of England rates bolster platform profitability by widening the spread earned on idle customer cash, but the benefit is increasingly shared with investors as competition for balances rises. Compliance spending linked to the FCA’s Consumer Duty framework is creating a dual effect: it raises the cost of doing business yet rewards firms able to evidence positive outcomes through transparent pricing dashboards. England remains the primary revenue base due to London’s financial infrastructure, while Scotland gains momentum on the back of a vibrant fintech cluster and targeted regional policy support.
Key Report Takeaways
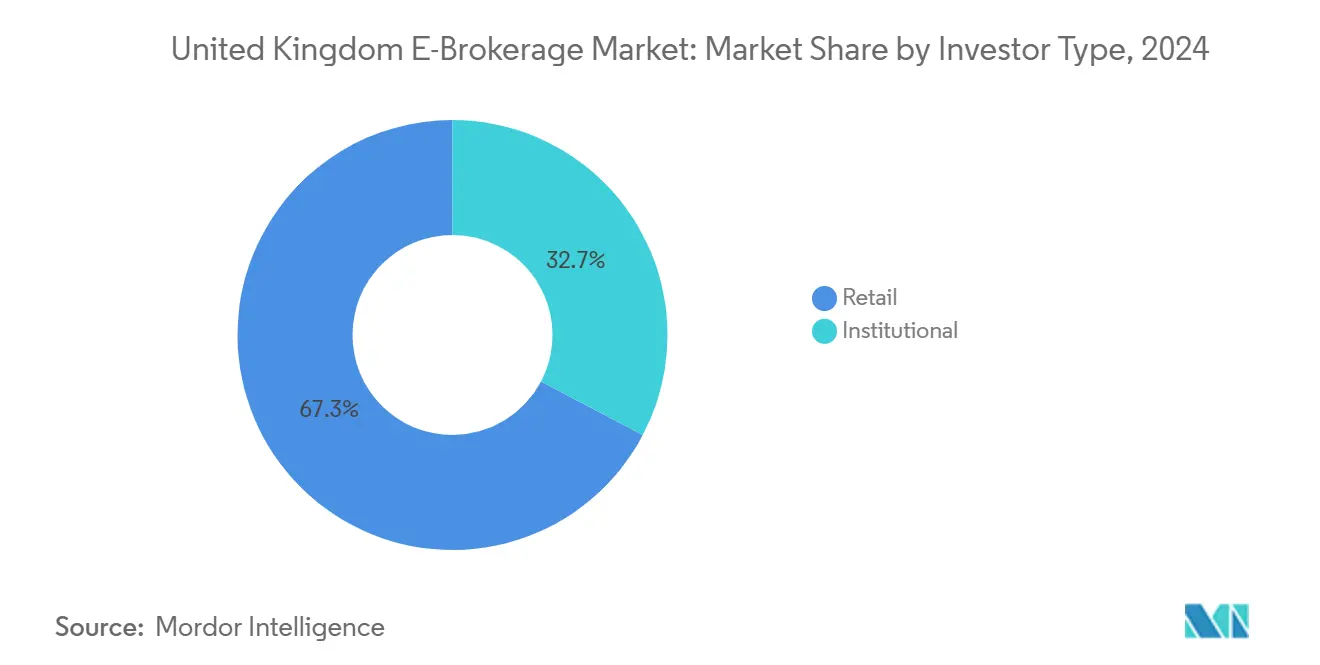
- By investor type, retail investors accounted for 67.27% of the United Kingdom e-brokerage market share in 2024, with the United Kingdom e-brokerage market size for retail investors projected to grow fastest at a CAGR of 9.24% between 2025 and 2030.
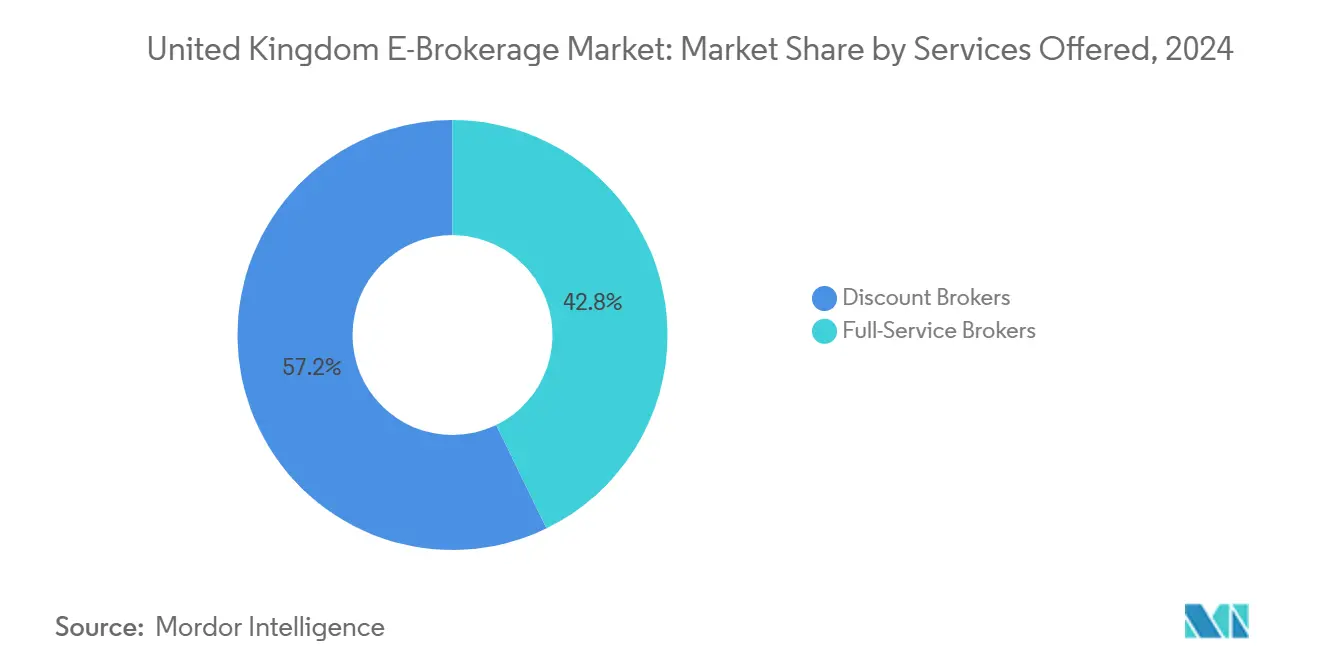
- By services offered, discount brokers captured 57.24% of the United Kingdom e-brokerage market share in 2024, while the United Kingdom e-brokerage market size for discount brokers is forecast to expand at the highest CAGR of 12.33% through 2030.
- By operation, domestic operations represented 84.24% of the United Kingdom e-brokerage market share in 2024, whereas the United Kingdom e-brokerage market size for foreign operations is expected to post a CAGR of 9.23% over 2025–2030.
- By region, England led with 78.29% of the United Kingdom e-brokerage market share in 2024, while the United Kingdom e-brokerage market size in Scotland is anticipated to exhibit the highest CAGR of 6.76% from 2025 to 2030.
United Kingdom E-Brokerage Market Trends and Insights
Drivers Impact Analysis*
| Driver | (~) % Impact on CAGR Forecast | Geographic Relevance | Impact Timeline |
|---|---|---|---|
| Post-pandemic surge in self-directed investing | 2.1% | Global, with UK leading retail adoption | Medium term (2-4 years) |
| Fee compression & zero-commission race | 1.8% | United Kingdom core, spillover to Europe | Short term (≤ 2 years) |
| Higher interest-rate spread on client cash | 1.5% | United Kingdom domestic, BoE policy dependent | Short term (≤ 2 years) |
| FCA push to standardise cost disclosures | 0.9% | United Kingdom regulatory jurisdiction | Medium term (2-4 years) |
| PE-backed digital overhauls of incumbents | 1.2% | United Kingdom concentrated, selective global | Long term (≥ 4 years) |
| Integration of crypto & staking rails | 0.8% | Global regulatory frameworks emerging | Long term (≥ 4 years) |
| Source: Mordor Intelligence | |||


Post-pandemic Surge in Self-directed Investing
Retail participation that spiked during 2020 lockdowns has proved durable rather than transient, with the FCA reporting continued growth in funded accounts well into 2025[1]Financial Conduct Authority, “Consumer Composite Investments Final Rules,” fca.org.uk.. Trading 212 surpassed 2.5 million United Kingdom users, while Freetrade recorded 40% year-on-year user growth, showing that mobile-first experiences resonate strongly with younger cohorts. The demographic influx skews toward investors under 35, a group that values fractional share capability and instant settlement over traditional telephone-based dealing. Increased engagement is evident in higher average logins per week, as well as greater diversification into ETFs and thematic baskets. Platform operators note that persistent usage supports ancillary revenue lines such as securities lending. Advisory bodies also observe that fresh entrants exhibit strong stickiness, suggesting long-run lifetime value that justifies the high upfront marketing cost. The behaviour shift, therefore, represents a structural tailwind for the United Kingdom e-brokerage market.
Fee Compression and the Zero-commission Race
Since 2023, headline dealing charges have trended toward zero as Trading 212 and Freetrade popularized commission-free equity execution, forcing incumbents to overhaul tariff structures[2]Trading 212, “Commission-Free Trading Platform,” trading212.com.. Interactive Investor moved to tiered flat-fee plans, and AJ Bell trimmed ISA and SIPP charges by 15% to stem account leakage. While customers benefit immediately, platforms must replace lost dealing income with margin lending, securities lending, and, where permissible, payment-for-order-flow. The United Kingdom regulatory stance on order routing is stricter than in the United States, limiting the revenue upside and widening the sustainability gap for smaller brokers. Competitive intensity is unlikely to abate because new entrants such as Robinhood plan United Kingdom with expansive marketing budgets. Collectively, these dynamics embed downward fee pressure even as operating-cost requirements rise.
Higher Interest-rate Spread on Client Cash
Successive Bank of England hikes lifted base rates from 0.11% in early 2021 to 5.25% by late 2024, expanding net-interest income on uninvested balances. Hargreaves Lansdown reported USD 58.65 million (GBP 47.3 million) in fiscal-2024 net interest revenue, while AJ Bell saw a 180% year-over-year jump to USD 35.59 million (GBP 28.7 million)[3]Hargreaves Lansdown, “Annual Report 2024,” hl.co.uk. . Platforms typically credit customers with a modest variable rate yet earn wholesale yields on pooled cash parked in money-market funds. The margin cushions falling commission income during periods of subdued trading and provides a predictable earnings stream that investors value. However, heightened public awareness of the spread is prompting brokers to share a larger slice with clients, especially as personal finance websites amplify comparison data. As yields plateau, the incremental benefit may taper, but current levels still represent a meaningful driver of overall profitability. Platforms that couple competitive cash returns with seamless sweep mechanisms are likely to retain deposits in a tightening market for savings products.
FCA Mandate to Standardize Cost Disclosures
The Consumer Composite Investments rules that took effect in December 2024 compel brokers to present like-for-like cost data across platforms, investment products, and wrappers. Firms must integrate granular analytics into customer dashboards so that total ownership cost, inclusive of fund expenses and trading fees, is immediately visible. Implementation costs—estimated at USD 6.20 million (GBP 2-5 million) per large platform—cover data architecture upgrades, governance enhancements, and real-time reporting engines. Although the near-term burden is material, early adopters gain a marketing advantage via clear value propositions and reduced risk of mis-selling claims. The rules also heighten board-level accountability, requiring attestations that pricing delivers fair outcomes for each customer segment. Over time, standardized data facilitate third-party comparison tools, spurring further fee competition yet reinforcing trust in platforms that rank favorable. As a result, the initiative is an incremental but important growth catalyst for the United Kingdom e-brokerage market.
Restraints Impact Analysis*
| Restraint | (~) % Impact on CAGR Forecast | Geographic Relevance | Impact Timeline |
|---|---|---|---|
| Consumer Duty & compliance spend spike | -1.4% | United Kingdom regulatory jurisdiction | Medium term (2-4 years) |
| Woodford litigation dampening investor trust | -0.8% | United Kingdom platform liability exposure | Long term (≥ 4 years) |
| Concentrated wholesale data vendor pricing | -0.6% | Global vendor consolidation | Medium term (2-4 years) |
| Escalating online investment fraud & scams | -0.9% | Global cybersecurity landscape | Short term (≤ 2 years) |
| Source: Mordor Intelligence | |||
Consumer Duty–driven Compliance Spend Spike
The Consumer Duty regime, live since July 2023, requires platforms to evidence positive outcomes across product design, pricing, communications, and support. For many brokers, this translates into multi-year programmes covering data lineage mapping, customer-journey analytics, and redress policy automation. Annual compliance outlays for major players range between USD 18.60 million (GBP 5-15 million), diverting capital from product development and marketing. Smaller firms face proportionally higher burdens, prompting some to seek acquisition partners rather than fund expansive control frameworks. Enhanced oversight also lengthens time-to-market for new services, dampening innovation cycles in areas such as crypto trading. Yet platforms that master the discipline can convert compliance into brand equity by highlighting superior governance. In aggregate, the rule elevates market entry barriers and subtracts modestly from long-term sector growth.
Escalating Online Investment Fraud and Scams
Reported investment fraud cases in the United Kingdom increased 18% in 2024, with the FCA issuing more than 1,200 warnings against unauthorized firms and clone websites. Platforms must double down on know-your-customer protocols, transaction-monitoring tools, and multi-factor authentication, all of which add to onboarding friction and cost. The threat is particularly acute on social media channels where fraud promotions target novice investors, eroding trust in legitimate broker brands. Victim compensation debates are intensifying, and regulatory guidance hints at potential liability for platforms failing to implement “industry-standard” protections. Marketing campaigns now include prominent fraud-awareness content, reducing conversion efficiency but satisfying Consumer Duty communications obligations. Insurers have tightened cyber-risk cover terms, leading to higher premiums that compound fixed-cost structures for smaller market participants. Collectively, the prevalence of fraud acts as a drag on user acquisition and therefore growth in the United Kingdom e-brokerage market.
*Our forecasts treat driver/restraint impacts as directional, not additive. The impact forecasts reflect baseline growth, mix effects, and variable interactions.
Segment Analysis
By Investor Type: Retail Dominance and Its Strategic Fallout
Retail customers controlled 67.27% of accounts and assets in 2024, cementing their role as the foundational revenue engine of the United Kingdom e-brokerage market size. They are also the fastest-growing constituency, with activity projected to rise at a 9.24% CAGR through 2030 as younger savers bypass traditional advisory channels in favor of personalized app experiences. Higher digital literacy, widespread smartphone adoption, and enhanced payment rails such as Open Banking have lowered entry barriers, enabling micro-investments and recurring buy-plans that fit variable income streams. Platforms, therefore, prioritize intuitive interface design, gamified education modules, and socially shareable performance snapshots to deepen engagement. Compliance remains exacting because Consumer Duty demands suitability checks even for self-directed activity, meaning brokers must curate nudges and risk warnings that pre-empt poor decision-making. Institutional investors, though fewer in number, generate large ticket sizes and require premium execution services, including algorithmic routing and dark-pool access; they thus anchor revenue diversification strategies that hedge against retail volume swings. Over the forecast period, the retail-institutional mix is expected to tilt further toward retail, yet full-service capabilities will still matter for client segments such as family offices seeking integrated custody and lending.
The competitive implications of retail heft are multifaceted. First, advertising budgets shift heavily toward social and influencer-led channels where younger investors congregate, raising customer-acquisition costs but also expanding reach beyond London. Second, brokers must maintain cloud architectures that elastically scale to manage order bursts triggered by viral stock trends, an operational challenge that favors well-capitalized firms. Third, the long-run monetization opportunity extends beyond equities into pensions consolidation, junior ISAs, and lifetime ISAs, allowing platforms to embed themselves across the household financial lifecycle. Finally, the possibility of negative retail sentiment—amplified through online forums—means service outages or mis-priced fees can provoke reputational damage within hours. All told, retail momentum underpins most strategy blueprints, compelling continuous innovation but also exposing platforms to elevated conduct scrutiny.

By Services Offered: Discount Models Disrupting Economics
Discount brokers accounted for 57.24% of 2024 revenue, solidifying their position as the dominant format within the United Kingdom e-brokerage market. Their forecast 12.33% CAGR is anchored in zero-commission trading, fractional shares, and low-cost ETFs that resonate with price-sensitive investors. In contrast, full-service providers, though still relevant for high-touch advisory needs, experience slower top-line expansion and narrower operating margins. Technology provides the key advantage for discount operators, enabling straight-through-processing that cuts human intervention and settlement errors. However, monetization pivots to subscription tiers, securities lending, and interest income, making revenue less transactional and more annuity-like. Regulatory rules on inducements restrict payment-for-order-flow, pressing firms to clarify how “free” trades stay profitable, an area of growing FCA interest. Consequently, transparency dashboards explaining spread capture and lending yields become competitive necessities.
Consolidation continues as scale proves critical in negotiating data-vendor agreements—particularly with providers such as LSEG and Bloomberg whose price hikes strain smaller players. The abrdn-Interactive Investor deal illustrates the trend: full-service heritage paired with digital scale creates cost synergies while broadening product lines. Meanwhile, technology investment focuses on AI-driven portfolio builders, automated tax harvesting and behavioural nudges that encourage disciplined investing. Discount models increasingly cross-sell premium research and priority customer support, blurring historical distinctions with mid-tier advisory brokers. Nevertheless, service innovation alone will not sustain differentiation if underlying execution reliability falters, reinforcing the mantra that platform stability is table stakes in a crowded landscape.
By Operation: Domestic Focus Versus Global Aspirations
Domestic-only propositions retained an 84.24% share of assets in 2024, underscoring the importance of FCA authorization and Financial Services Compensation Scheme protection to United Kingdom investors. Yet foreign-enabled accounts show the strongest momentum, registering a 9.23% CAGR outlook as clients demand lower-cost routes into U.S., EU, and APAC equities. Saxo Bank and Interactive Brokers capitalize on multi-jurisdictional licenses, offering depth of market data and margin facilities that appeal to sophisticated users. Post-Brexit regulatory divergence has heightened interest in seamless EU access, positioning globally oriented platforms as natural beneficiaries. Domestic brokers respond by partnering with overseas custodians or white-labelling international order routing, but such integrations add latency and compliance complexity.
Currency-conversion fees represent an attractive ancillary revenue pool, yet excessive spreads invite regulatory attention under the FCA’s fair-value doctrine. As a result, transparent FX pricing is emerging as a marketing point of difference. Client demand for foreign ETFs and ADRs also raises the bar for educational content, as investors must grasp different settlement cycles and tax treatments. Operationally, cross-border servicing forces investment in multilingual customer support and extended trading-hour coverage, lifting fixed costs. Notwithstanding those challenges, the global access narrative remains compelling, suggesting that domestic-first strategies will gradually cede ground to hybrid models blending local custody with international venue connectivity.
Geography Analysis
England captured 78.29% of 2024 revenues owing to London’s deep capital pools, abundant fintech talent, and regulatory proximity, cementing its role as the anchor of the United Kingdom e-brokerage market size[4]Scottish Government, “Fintech Strategy,” gov.scot. . The region also enjoys a concentration of venture funding, fostering continuous platform innovation from seed to unicorn stages. That said, growth rates favor Scotland, where supportive government policy and a burgeoning AI discipline in Edinburgh fuel a 6.76% CAGR outlook through 2030. The Scottish ecosystem benefits from collaboration between universities, accelerators, and established asset managers migrating parts of their digital divisions northward. Wales and Northern Ireland remain smaller markets yet highlight stable adoption curves, helped by localized outreach and bilingual support that meet cultural nuances.
Regional diversification offers platforms that hedge against localized economic slowdowns and provide test beds for new features before national rollouts. The FCA encourages such outreach under its goal of improving financial inclusion, aligning regulatory goodwill with commercial opportunity. Moreover, devolved governments sponsor fintech sandboxes that can expedite pilot programmes in areas like open-source risk scoring. Operationally, consistent United Kingdom regulation simplifies compliance across borders, allowing central infrastructure investments to scale while marketing messages adapt regionally. In the long term, geography-based competitive gaps are expected to narrow as cloud-hosted platforms deliver uniform performance irrespective of physical location, though local customer-service hubs will remain advantageous.
Competitive Landscape
The market remains highly concentrated, with the top five providers controlling most total assets. The dominant position of Hargreaves Lansdown plays a significant role in shaping competitive dynamics across the sector. However, the firm’s potential private equity buyout brings a layer of strategic uncertainty. This development may prompt competitors to exploit the situation through targeted poaching campaigns. As a result, rival providers are expected to pursue aggressive strategies to attract both talent and clients. Fee compression, while erosive to short-term margins, has intensified technology races, pushing even mid-tier brokers to deploy AI-enabled robo-guidance and customizable dashboard analytics. Interactive Investor’s integration into abrdn underscores the trend toward vertical combination, blending execution capability with advised wealth propositions that capture end-to-end customer journeys. New entrant Robinhood plans to leverage its mobile brand equity to disrupt incumbents further once the United Kingdom operations commence in 2025.
Platforms differentiate along three primary vectors: breadth of asset coverage, depth of analytical tooling and clarity of cost presentation. The FCA’s Consumer Duty metric testing favors firms that can surface value drivers within five clicks, an emerging benchmark evident in public communications. Data-vendor oligopoly exerts pressure on smaller outfits who pay retail list prices for essential market feeds, shrinking their gross margin versus scaled peers able to negotiate double-digit discounts. Cybersecurity resilience also factors into competitive positioning, with recent publicized outages triggering custodial risk reviews among institutional clients. Looking ahead, niche opportunities in cryptocurrency ISAs, ESG tax-wrappers and pension dashboard integrations could allow agile specialists to carve profitable segments without challenging the incumbents head-on.
The industry’s strategic narrative is therefore one of selective consolidation, heavy investment in back-end resilience and a gradual pivot toward subscription and interest-linked revenues over per-trade commissions. While a few household names will retain dominance, the lower end of the market remains contestable thanks to open-source technology stacks and cloud-native deployment models that reduce capex requirements. That said, the combination of rising compliance standards and higher insurance premiums effectively raises the minimum efficient scale, reinforcing the moat around today’s leaders. Competitive intensity will thus manifest more in feature velocity than in price wars, creating a virtuous cycle for users who benefit from continual platform enhancements at declining explicit cost.
United Kingdom E-Brokerage Industry Leaders
Hargreaves Lansdown PLC
AJ Bell PLC
Interactive Investor Services Ltd
IG Group Holdings PLC
Freetrade Ltd
- *Disclaimer: Major Players sorted in no particular order

Recent Industry Developments
- February 2025: eToro received a Markets in Crypto-Assets (MiCA) license, enabling expanded cryptocurrency services across Europe, while preparing United Kingdom crypto integration within ISA wrappers pending FCA regulatory clarity
- January 2025: Robinhood announced plans to launch United Kingdom operations with commission-free trading and ISA products, targeting younger demographics with a mobile-first investment platform designed to compete directly with established discount brokers.
- December 2024: FCA implemented the Consumer Composite Investments (CCI) framework, requiring standardized cost reporting across investment platforms, mandating outcome-based value demonstrations that reshape competitive dynamics and compliance requirements.


United Kingdom E-Brokerage Market Report Scope
E-brokerage exists as an electronic platform allowing users to trade securities through digital platforms. The United Kingdom E-Brokerage market is segmented by investor type and by operation. By investor type, the market is segmented into retail and institutional, and by operation, the market is segmented into domestic and foreign. The report offers market sizes and forecasts for the United Kingdom E-Brokerage Market in value (USD) for all the above segments.
By Investor Type
| Retail |
| Institutional |
By Services Offered
| Full-Service Brokers |
| Discount Brokers |
By Operation
| Domestic |
| Foreign |
By Geography
| England |
| Scotland |
| Wales |
| Northern Ireland |
| By Investor Type | Retail |
| Institutional | |
| By Services Offered | Full-Service Brokers |
| Discount Brokers | |
| By Operation | Domestic |
| Foreign | |
| By Geography | England |
| Scotland | |
| Wales | |
| Northern Ireland |


Key Questions Answered in the Report
What was the value of the UK e-brokerage market in 2025?
The market was valued at USD 760 million in 2025.
How fast is the sector expected to grow through 2030?
It is projected to post a 7.53% CAGR, reaching USD 1.10 billion by 2030.
Which segment holds the largest share of accounts?
Retail investors held 67.27% of accounts and assets in 2024.
Why are interest rates a profit driver for platforms?
Platforms earn a spread between what they pay on client cash and the higher yields they receive on pooled deposits.
Which region is growing fastest within the UK?
Scotland shows the fastest growth, with a 6.76% CAGR forecast to 2030.
What regulation is reshaping cost transparency?
The FCA’s Consumer Composite Investments rules require standardized cost disclosures across platforms.
Page last updated on:


