Ammonia Market Size and Share
Market Overview
| Study Period | 2021 - 2031 |
|---|---|
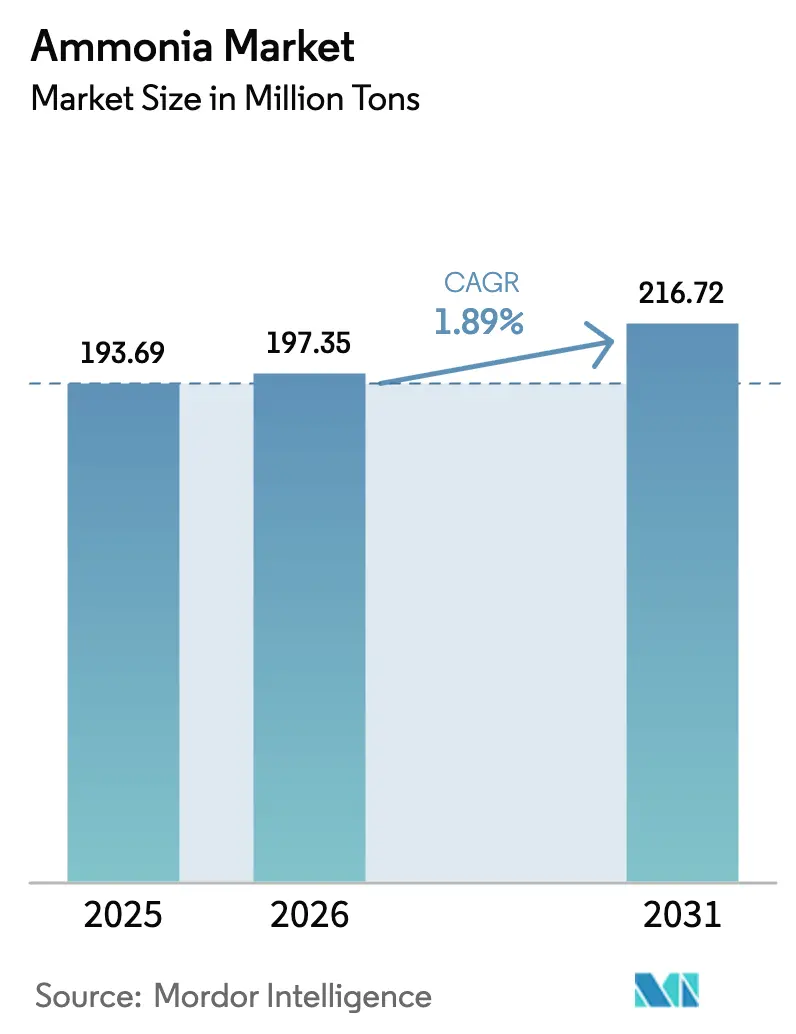
| Market Volume (2026) | 197.35 Million tons |
| Market Volume (2031) | 216.72 Million tons |
| Growth Rate (2026 - 2031) | 1.89% CAGR |
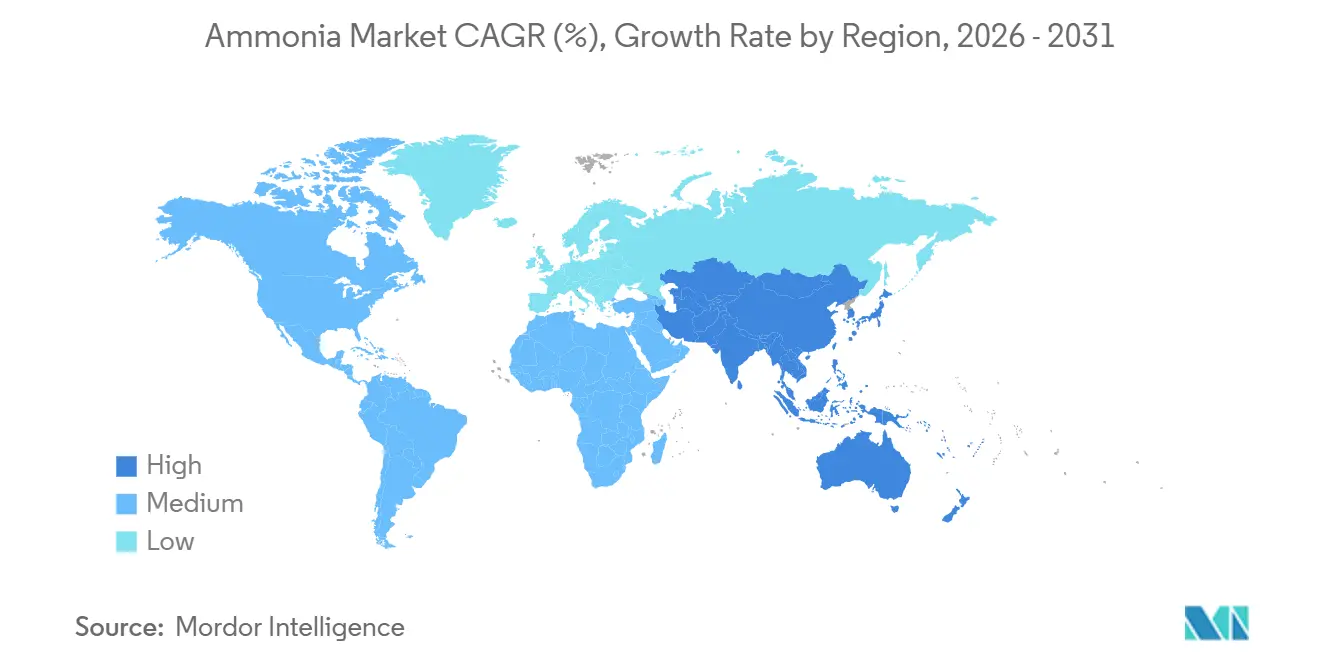
| Fastest Growing Market | Asia Pacific |
| Largest Market | Asia Pacific |
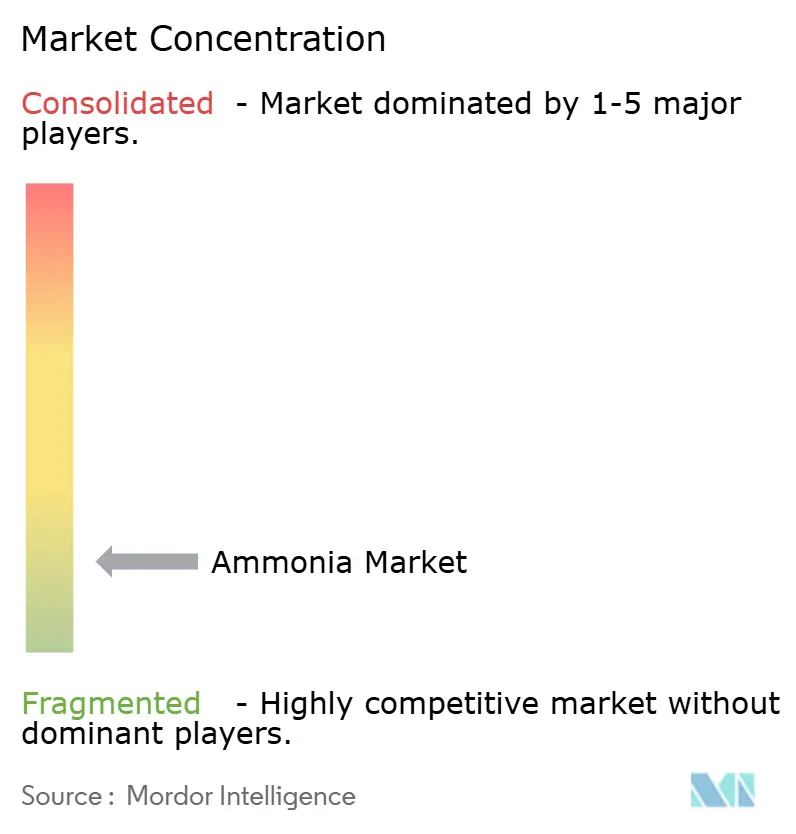
| Market Concentration | Low |
Major Players *Disclaimer: Major Players sorted in no particular order Image © Mordor Intelligence. Reuse requires attribution under CC BY 4.0. | |
Ammonia Market Analysis by Mordor Intelligence
The Ammonia Market size was valued at 193.69 Million tons in 2025 and is estimated to grow from 197.35 Million tons in 2026 to reach 216.72 Million tons by 2031, at a CAGR of 1.89% during the forecast period (2026-2031). Structural change rather than topline growth defines this trajectory, with producers steadily replacing natural-gas feedstock with low-carbon hydrogen, utilities trialing ammonia co-firing to decarbonize power, and shippers selecting the molecule as an energy-dense hydrogen carrier. Liquid grades dominate trade flows thanks to a global fleet of pressurized tankers and established import terminals, yet gaseous supply is expanding inside industrial sites that can bypass liquefaction. Fertilizer still anchors consumption, but co-firing in Japan and South Korea, explosives for hard-rock mining, and controlled-release urea in Asia propel new demand pockets. These shifts have prompted incumbents to retrofit Haber-Bosch assets with carbon capture while new entrants secure 20-year renewable power contracts that promise delivered green ammonia costs below grey benchmarks by 2028.
Key Report Takeaways
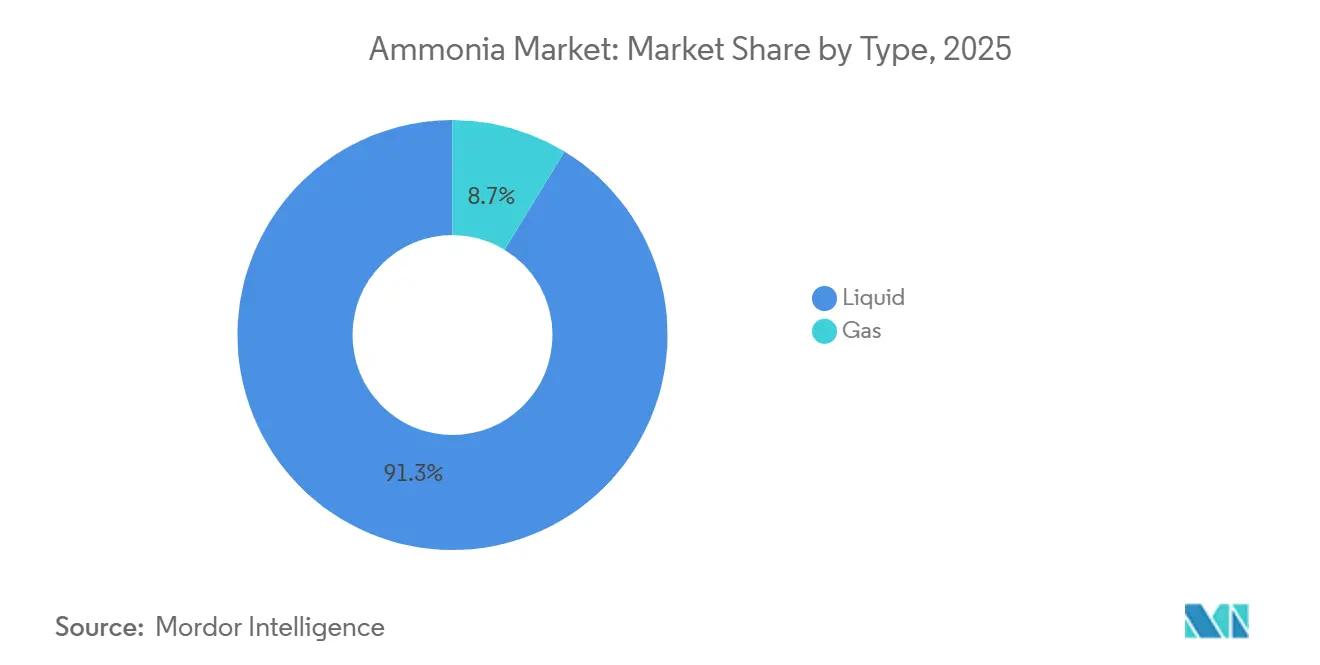
- By type, liquid led with 91.28% of volume in 2025, while gas is projected to grow at a 4.18% CAGR through 2031.
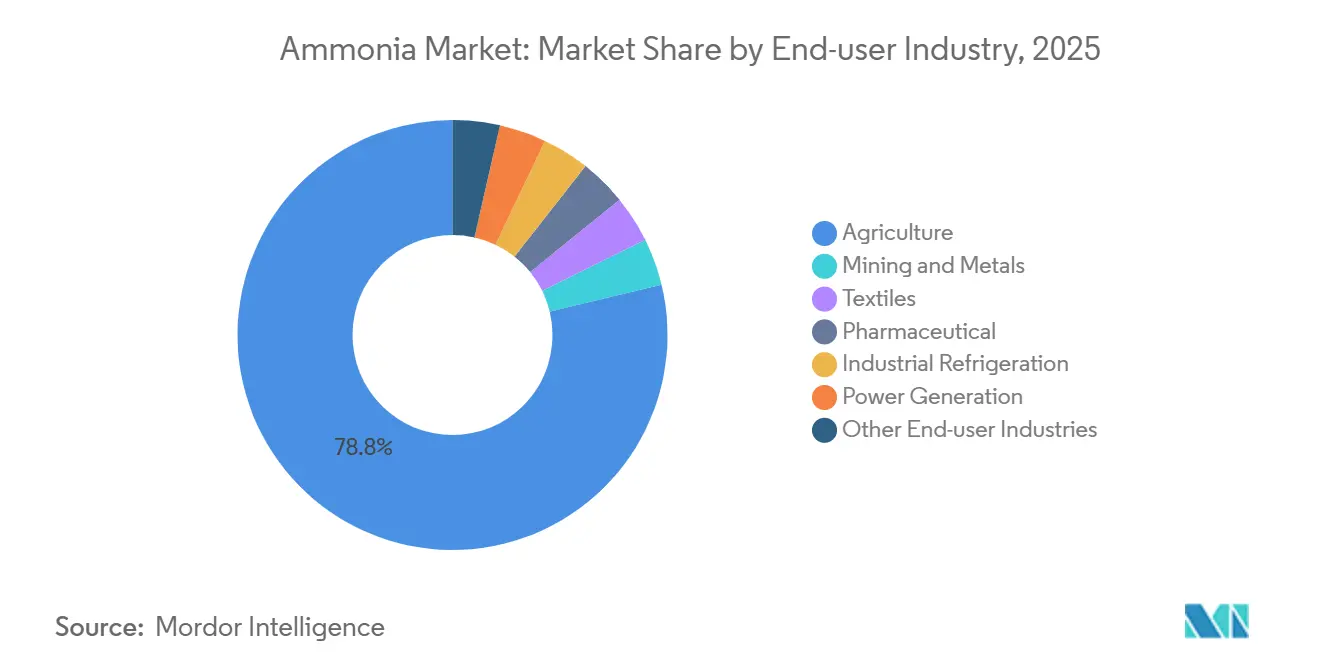
- By end-user industry, agriculture accounted for 78.76% of the ammonia market share in 2025, whereas power generation exhibits the highest forecast CAGR at 5.87% to 2031.
- By geography, Asia-Pacific captured 39.16% of global volume in 2025 and is poised to advance at a 3.76% CAGR through 2031.
Note: Market size and forecast figures in this report are generated using Mordor Intelligence’s proprietary estimation framework, updated with the latest available data and insights as of January 2026.
Global Ammonia Market Trends and Insights
Drivers Impact Analysis*
| Driver | (~) % Impact on CAGR Forecast | Geographic Relevance | Impact Timeline |
|---|---|---|---|
| Surge in Low-Carbon Fertilizer Demand Across Asia | +0.6% | Asia-Pacific core, spill-over to Middle East exports | Medium term (2–4 years) |
| Adoption as Hydrogen Carrier for Maritime Bunkering | +0.4% | Global, with early adoption in Japan, South Korea, Singapore | Long term (≥ 4 years) |
| Rising Investments in Green-Ammonia Export Hubs | +0.5% | Middle East, North Africa, Australia, Chile | Medium term (2–4 years) |
| Rising Usage in Explosive Production | +0.2% | North America, Australia, South America (mining corridors) | Short term (≤ 2 years) |
| India's Fertilizer-Subsidy Pivot Towards Green Blends | +0.3% | National (India), with policy demonstration effects in South Asia | Medium term (2–4 years) |
| Source: Mordor Intelligence | |||


Surge in Low-Carbon Fertilizer Demand Across Asia
Asia-Pacific governments are linking subsidy disbursements to carbon intensity, prompting fertilizer majors to integrate electrolyzers at legacy ammonia sites. India’s Direct Benefit Transfer scheme added a 5% green-ammonia blending requirement that opens 980,000 tons of incremental demand by 2027, while Indonesia’s state-owned Pupuk Indonesia secured USD 1.2 billion to retrofit Petrokimia Gresik with renewable hydrogen. China’s 14th Five-Year Plan caps new coal-based capacity and mandates capture readiness above 500,000 tons per year, crowding production into efficient state-owned complexes. These measures funnel fresh volume into the ammonia market, deepen import dependence in fertilizer-short economies, and underpin new merchant green-ammonia projects across the Middle East.
Adoption as Hydrogen Carrier for Maritime Bunkering
Ammonia stores 4.3 MWh per cubic meter at ambient conditions, matching marine-diesel energy density without cryogenic systems. Japanese shipper NYK ordered 12 ammonia-fueled bulk carriers in 2024 and the European Maritime Safety Agency published handling guidelines that standardize double-walled piping and vapor recovery, trimming perceived operational risk[1]European Maritime Safety Agency, “Guidelines on Ammonia Bunkering,” emsa.europa.eu . Singapore granted three bunkering licenses targeting 500,000 tons per year by 2030, an early demand anchor for Pacific container routes. Together these actions seed a dedicated bunkering network that could absorb 3 million tons annually before 2031, widening the ammonia market.
Rising Investments in Green-Ammonia Export Hubs
Developers are flocking to regions where levelized renewable electricity already sits below USD 20 per MWh. NEOM’s USD 8.4 billion complex in Saudi Arabia began commissioning in 2025 and will ship 1.2 million tons per year into power and shipping markets under 20-year contracts. Egypt’s Ain Sokhna project secured 15-year EU-indexed offtake deals, while Australia’s Pilbara hosts multi-hundred-thousand-ton ventures from Fortescue and Yara that pair stranded wind and solar with coastal export jetties. Sub-USD 400 per-ton production costs projected for 2028 position these hubs to undercut European grey ammonia, reshaping trade lanes toward the Pacific and Mediterranean basins.
Rising Usage in Explosive Production
Mining companies are replacing diesel-oil blasting agents with ammonium-nitrate emulsions that cut nitrogen-oxide emissions by 40% and boost rock fragmentation. Orica added 200,000 tons per year at Kooragang, supported by long-term deals with BHP and Rio Tinto, while Dyno Nobel’s purchase of Maxam’s North American explosives unit consolidates 35% of regional capacity. Lithium producers in Chile’s Atacama are adopting nitrate-based leach circuits that raise ammonia demand by 80,000 tons per year by 2027, swelling the ammonia market in Latin America.
Restraints Impact Analysis*
| Restraint | (~) % Impact on CAGR Forecast | Geographic Relevance | Impact Timeline |
|---|---|---|---|
| Volatile Natural-Gas Prices Inflating Global Cash Costs | -0.5% | Europe, North Asia (Japan, South Korea imports) | Short term (≤ 2 years) |
| Safety and Toxicity Concerns Limiting Industrial Substitution | -0.3% | Global, with acute regulatory friction in North America, EU | Medium term (2–4 years) |
| Electrolyser Supply-Chain Bottlenecks | -0.4% | Global, concentrated in rare-earth and platinum-group metal sourcing | Long term (≥ 4 years) |
| Source: Mordor Intelligence | |||
Volatile Natural-Gas Prices Inflating Global Cash Costs
Natural gas forms up to 80% of grey-ammonia production cost, so feedstock swings shutter marginal plants. European producers faced average TTF prices of EUR 42 per MWh in 2025, pushing cash costs beyond EUR 600 per ton and forcing Grupa Azoty to idle 180,000 tons of capacity for four months. U.S. operators enjoy Henry Hub below USD 3 per MMBtu, yet LNG exports are tightening supply and lifting summer peaks, squeezing the margin cushion[2]U.S. Energy Information Administration, “Natural Gas Prices,” eia.gov . Asian importers pay USD 12-14 per MMBtu for spot cargoes, making local ammonia uncompetitive and reinforcing reliance on Middle Eastern volumes.
Safety and Toxicity Concerns Limiting Industrial Substitution
Ammonia’s permissible exposure limit of 50 ppm over eight hours imposes costly safeguards. The U.S. Chemical Safety Board tallied 14 releases above 1,000 pounds in 2024, including one Louisiana cold-storage leak that hospitalized eight workers and triggered a one-mile evacuation. The EU’s Seveso III rules classify storage over 50 tons as upper-tier, obligating public consultation and delaying projects by up to 18 months. Insurers respond with premium surcharges, deterring small enterprises from converting refrigeration and chemical processes, holding back wider ammonia market adoption in developed economies.
*Our forecasts treat driver/restraint impacts as directional, not additive. The impact forecasts reflect baseline growth, mix effects, and variable interactions.
Segment Analysis
By Type: Liquid Dominance Anchors Logistics
Liquid retained 91.28% of global volume in 2025, underscoring entrenched logistics that pipe anhydrous ammonia into fertilizer plants and load pressurized tankers for ocean trade. Bulk storage and refrigeration account for about 30% of delivered cost, yet the sunk capital discourages rapid switching, keeping the liquid segment pivotal to the ammonia market. North African and Middle Eastern exporters leverage tanker fleets to penetrate Europe and Asia as high natural-gas prices curtail local output, while Gulf Coast exporters exploit contiguous petrochemical infrastructure to reach Latin America.
Gas-phase is projected to expand at a 4.18% CAGR through 2031. Industrial refrigeration retrofits in food retail and pharmaceuticals substitute synthetic refrigerants with on-site gaseous ammonia, shrinking power consumption by 18% according to the International Institute of Ammonia Refrigeration. China’s nylon and acrylic producers pipe gaseous ammonia from adjacent coal-gasification units to boost reaction kinetics and trim purification steps. These end-use efficiencies widen the appeal of gaseous formats despite the segment’s smaller base.


By End-user Industry: Power Generation Disrupts Fertilizer Hegemony
Agriculture absorbed 78.76% of volume in 2025 as urea, ammonium nitrate, and compound fertilizers dominated nitrogen delivery. Precision-farming platforms are moderating absolute growth, yet policy-driven green blends and controlled-release technologies channel fresh volume back into the ammonia market by rewarding low-carbon content. Mining and metals demand remain stable through blasting emulsions and emerging lithium leaching circuits, while water treatment, textiles, pharmaceuticals, and petroleum refining round out diversified demand.
Power generation is the stand-out growth engine, advancing at a 5.87% CAGR. Japan targets 20% ammonia in coal boilers by 2030 and South Korea is building 3.6 GW of co-firing capacity, together adding 8 million tons of new offtake. Utilities sign long-term supply deals indexed to coal rather than urea, effectively creating a parallel ammonia market size segment that bypasses fertilizer price cycles. As import terminals, safety codes, and burner retrofits mature, electricity demand could eclipse 10% of global ammonia trade before 2031, challenging the fertilizer monopoly on production planning and shipping routes.
Geography Analysis
Asia-Pacific captured 39.16% of global tonnage in 2025 and is forecast to compound at 3.76% through 2031. China is closing sub-scale coal units that fail to meet 31 GJ per ton energy benchmarks, channeling production to efficient state-owned complexes and opening space for imported green volumes. India’s blending mandate and subsidy reforms lift incremental demand even as domestic natural-gas constraints persist. Japan and South Korea are retreating from high-cost local production and re-engineering port infrastructure for 6 million tons of imports by 2030, reinforcing Asia’s dual role as producer and consumer of the ammonia market.
North America benefits from plentiful shale gas and Inflation Reduction Act incentives worth up to USD 85 per ton of CO₂ sequestered, catalyzing blue-ammonia clusters around the Gulf Coast. CF Industries, Nutrien, and Koch Fertilizer are adding capture units and pipeline tie-ins, locking in sub-USD 320 per ton delivered costs. Canada’s hydro-rich provinces pitch zero-carbon hydropower for green-ammonia projects that could export through Atlantic ports, extending regional influence beyond fertilizer.
In Europe, capacity is restricted in 2024-2025 as gas prices breached EUR 50 per MWh, reinforcing reliance on imports from North Africa and the Middle East. The European Commission now labels ammonia “strategic” under its Critical Raw Materials Act, intending to streamline permitting for domestic low-carbon projects. Meanwhile, Qatar, Saudi Arabia, and the UAE exploit USD 2 per MMBtu gas to ship low-carbon cargoes into Europe and Asia, while Egypt and Oman fast-track wind-and-solar-based plants that target sub-USD 400 per ton export parity. South America is building wind-powered facilities in Chile’s Magallanes and solar-driven projects in Brazil’s Pecém and injecting fresh competition into Atlantic trade flows.
Mordor Intelligence provides coverage of the ammonia market across other key regional markets, including Asia, each with their regulatory frameworks and demand patterns.

Competitive Landscape
The ammonia market remains unconcentrated; the top five producers control under 30% of capacity, and divergent technology pathways keep barriers fluid. Yara, CF Industries, and Nutrien defend fertilizer volumes through long-term gas contracts and carbon-capture retrofits even as they partner with renewable developers to secure green-hydrogen feedstock; Yara’s 500 MW offshore-wind collaboration with Engie in the North Sea typifies this hedging. SABIC and ADNOC leverage blue-ammonia cost leadership under USD 300 per ton by pairing steam-methane reforming with carbon capture, positioning the Middle East as a low-cost export hub that undercuts European output.
Technology specialization drives emerging differentiation. Topsoe and thyssenkrupp Uhde have filed patents for solid-oxide electrolyzers achieving 85% electrical efficiency, promising green-ammonia production below USD 350 per ton where renewable power is under USD 20 per MWh. Project developers such as Fortescue Future Industries, NEOM Green Hydrogen, and Hy Stor Energy pursue vertical integration from renewables through synthesis, locking in feedstock prices and circumventing OEM bottlenecks. This model channels value away from traditional traders toward power-purchase agreements and shipping consortia.
Geopolitics further fragments competition. U.S. and EU subsidies tilt economics toward domestic production, counterbalancing Middle Eastern cost advantages. China’s export controls on rare-earth elements used in electrolyzers force Western projects to build localized supply chains, inflating capital costs by up to 25% and delaying schedules. Meanwhile, Japanese and Korean utilities bypass fertilizer distributors to sign direct supply contracts indexed to coal, potentially siphoning 15 million tons annually into a dedicated power segment by 2035. These cross-currents suggest sustained low concentration in the ammonia market as participants jostle across grey, blue, and green value chains.
Ammonia Industry Leaders
Nutrien
OCI
SABIC
Yara
CF Industries Holdings, Inc.
- *Disclaimer: Major Players sorted in no particular order

Recent Industry Developments
- January 2026: Samsung Engineering's subsidiary, Samsung E&A, began construction of a low-carbon ammonia plant in the United States as part of the Wabash project. Located in the West Terre Haute area of Indiana, the facility is designed to produce 500,000 tons of ammonia annually.
- January 2026: OCI commenced ammonia production at its new Texas facility prior to implementing carbon capture and storage (CCS) technology and transferring the site to Woodside. The Beaumont New Ammonia plant has a production capacity of up to 1.1 million tonnes of blue ammonia annually in its initial phase, catering to European and Asian markets in agriculture, power generation, and marine fuel industries.


Research Methodology Framework and Report Scope
Market Definitions and Key Coverage
Our study defines the global ammonia market as the total annual production and first sale of anhydrous and aqueous ammonia, whether liquefied for bulk transport or gaseous for on-site injection, used across fertilizers, explosives, refrigeration, textiles, pharmaceuticals, mining, and emerging energy carrier applications. According to Mordor Intelligence, this universe amounted to 193.69 million tons in 2025.
Scope Exclusion: Downstream derivatives (urea, ammonium nitrate, ammonium sulfate), niche "green" or "blue" ammonia value additions, and captive consumption of synthesis gas that never leaves integrated petrochemical complexes are not counted.
Segmentation Overview
- By Type
- Liquid
- Gas
- By End-user Industry
- Agriculture
- Mining and Metals
- Textiles
- Pharmaceutical
- Industrial Refrigeration
- Power Generation
- Other End-user Industries (Water-treatment, Rubber, Petroleum, Pulp and Paper)
- By Geography
- Asia-Pacific
- China
- India
- Japan
- South Korea
- ASEAN Countries
- Rest of Asia-Pacific
- North America
- United States
- Canada
- Mexico
- Europe
- Germany
- United Kingdom
- France
- Italy
- NORDIC Countries
- Rest of Europe
- South America
- Brazil
- Argentina
- Rest of South America
- Middle East and Africa
- Saudi Arabia
- South Africa
- Rest of Middle East and Africa
- Asia-Pacific
Detailed Research Methodology and Data Validation
Primary Research
Structured interviews and short surveys with plant operators, fertilizer distributors, maritime fuel developers, and process licensor experts across Asia-Pacific, North America, Europe, and the Middle East test desk research assumptions, surface unreported shutdowns, and calibrate average selling prices and utilization factors.
Desk Research
Mordor analysts first map global supply using publicly available producer capacity lists from the International Fertilizer Association, plant-level production data from the US Geological Survey and China's National Bureau of Statistics, and cross-border trade records extracted from UN Comtrade and Eurostat Comext. Policy notes from the International Energy Agency, patent families mined via Questel, and price trends from S&P Global Commodity Insights enrich the demand story with cost and technology signals.
Company 10-Ks, investor decks, customs filings, and credible press releases then refine regional feedstock costs, operating rates, and announced low-carbon projects. The sources cited above are illustrative; numerous additional open datasets are reviewed before figures are approved.
Market-Sizing & Forecasting
A top-down production plus trade reconstruction yields the 2025 baseline; selective bottom-up checks, capacity roll-ups, and sampled free-on-board price multiplied by merchant tonnage validate totals. Key model levers include natural gas cost spreads, regional capacity additions, fertilizer application rates per hectare, merchant ammonia trade flows, and anticipated bunker fuel trials. Forecasts to 2030 apply multivariate regression blended with ARIMA smoothing, with scenario ranges vetted by interviewed experts. Any data voids, such as undisclosed maintenance outages, are bridged with three-year moving averages that are re-scored during peer review.
Data Validation & Update Cycle
Outputs face variance tests versus historic price volume elasticities, peer review by a senior analyst panel, and a second pass before client release. The model is refreshed annually, while material events, such as gas price shocks and large plant start-ups, trigger interim updates.
Why Mordor's Ammonia Baseline Earns Decision-Maker Trust
Published figures often diverge because firms choose different units, include or exclude merchant trade, or freeze currency assumptions at varied dates.
Key gap drivers we observe are: some studies mix value and volume without clarifying conversions; others embed derivatives or green ammonia projects still under construction; a few apply single region price averages, ignoring feedstock disparities that Mordor's model adjusts quarterly.
Benchmark comparison
| Market Size | Anonymized source | Primary gap driver |
|---|---|---|
| 193.69 million tons (2025) | Mordor Intelligence | - |
| USD 235.14 billion (2025) | Global Consultancy A | Uses list price averages, counts urea and nitrate values inside headline figure |
| USD 79.47 billion (2024) | Regional Consultancy B | Excludes merchant export volumes and applies conservative ASP tied to Henry Hub only |
| USD 84.52 billion (2025) | Industry Association C | Treats captive integrated output as outside scope, leading to lower base |
The comparison shows how unit of measure, inclusion rules, and price anchors can shift totals by more than a factor of two.
By basing estimates on verifiable production data, transparent assumptions, and continuous refresh cycles, Mordor Intelligence delivers a balanced, repeatable baseline that planners can rely on with confidence.


Key Questions Answered in the Report
How big is the ammonia market in 2026?
The ammonia market size is 197.35 million tons in 2026 and is projected to reach 216.72 million tons by 2031.
What is the expected CAGR for world ammonia demand to 2031?
Global volume is projected to rise at a 1.89% CAGR between 2026 and 2031.
Which segment is expanding fastest within ammonia applications?
Power generation leads growth with a 5.87% CAGR as utilities co-fire ammonia with coal.
Which region dominates ammonia production and consumption today?
Asia-Pacific holds 39.16% of global volume in 2025 and remains both the largest producer and consumer.
Page last updated on:


