
Market Overview
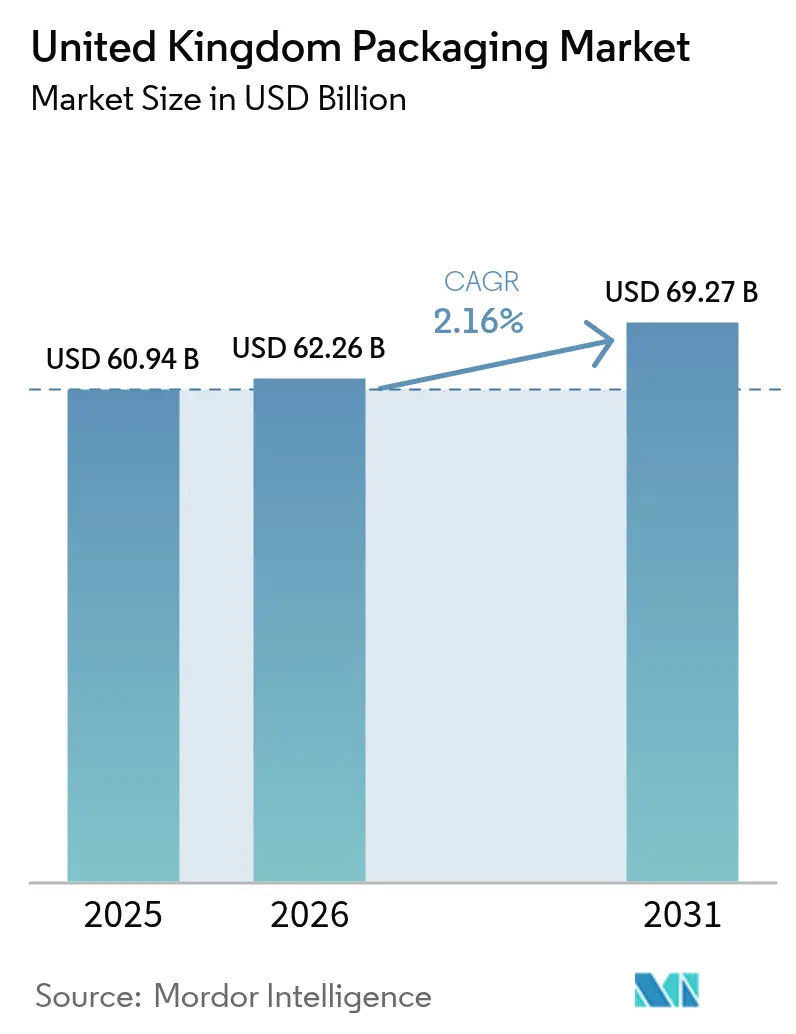
| Study Period | 2020 - 2031 |
|---|---|
| Forecast Data Period | 2026 - 2031 |
| Base Year Market Size (2025) | USD 60.94 Billion |
| Market Size (2026) | USD 62.26 Billion |
| Market Size (2031) | USD 69.27 Billion |
| Growth Rate (2026 - 2031) | 2.16 % |
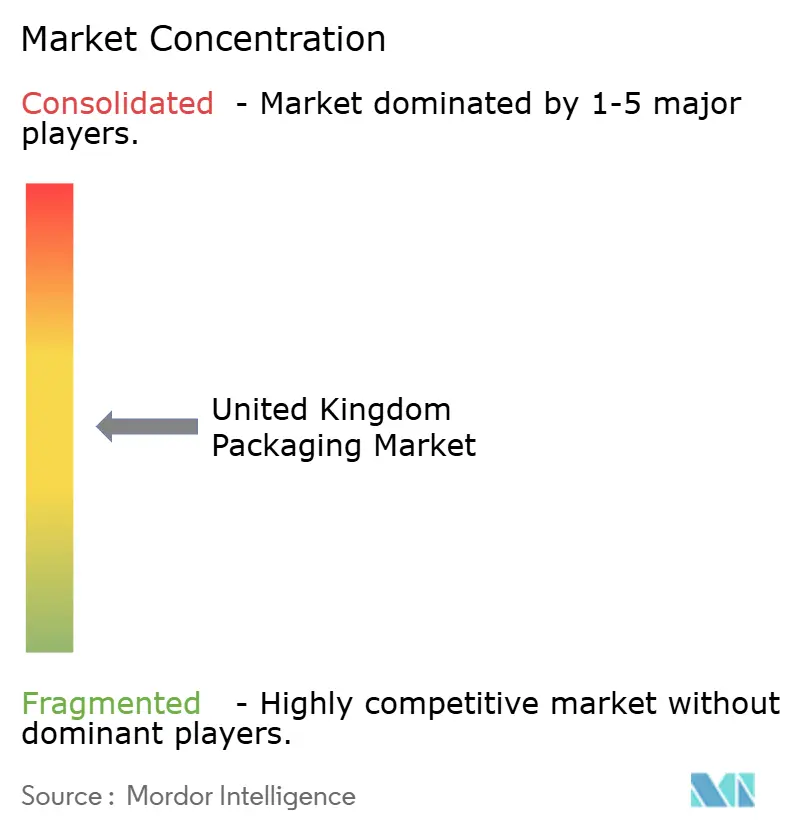
| Market Concentration | Medium |
Major Players *Disclaimer: Major Players sorted in no particular order Image © Mordor Intelligence. Reuse requires attribution under CC BY 4.0. | |
United Kingdom Packaging Market Analysis by Mordor Intelligence
United Kingdom packaging market size in 2026 is estimated at USD 62.26 billion, growing from 2025 value of USD 60.94 billion with 2031 projections showing USD 69.27 billion, growing at 2.16% CAGR over 2026-2031. Current momentum reflects a mature yet steadily evolving landscape shaped by post-Brexit border rules, tighter environmental mandates, e-commerce acceleration and pronounced cost inflation. Structural adjustments under the Border Target Operating Model raised compliance workloads and stretched lead times, prompting producers to localize inputs and automate customs documentation. Parallel expansion of the United Kingdom Plastic Packaging Tax and full roll-out of Extended Producer Responsibility sharpened the focus on recyclability, driving rapid substitution toward paper, mono-material plastics and bio-based films. Flexible formats gained share as online retail reached 31.3% of national sales, and value-added printing capabilities helped brands target niche audiences cost-effectively. Consolidation continued, highlighted by International Paper’s USD 7.54 billion acquisition of DS Smith, which created the region’s largest corrugated supplier but intensified antitrust scrutiny.
Key Report Takeaways
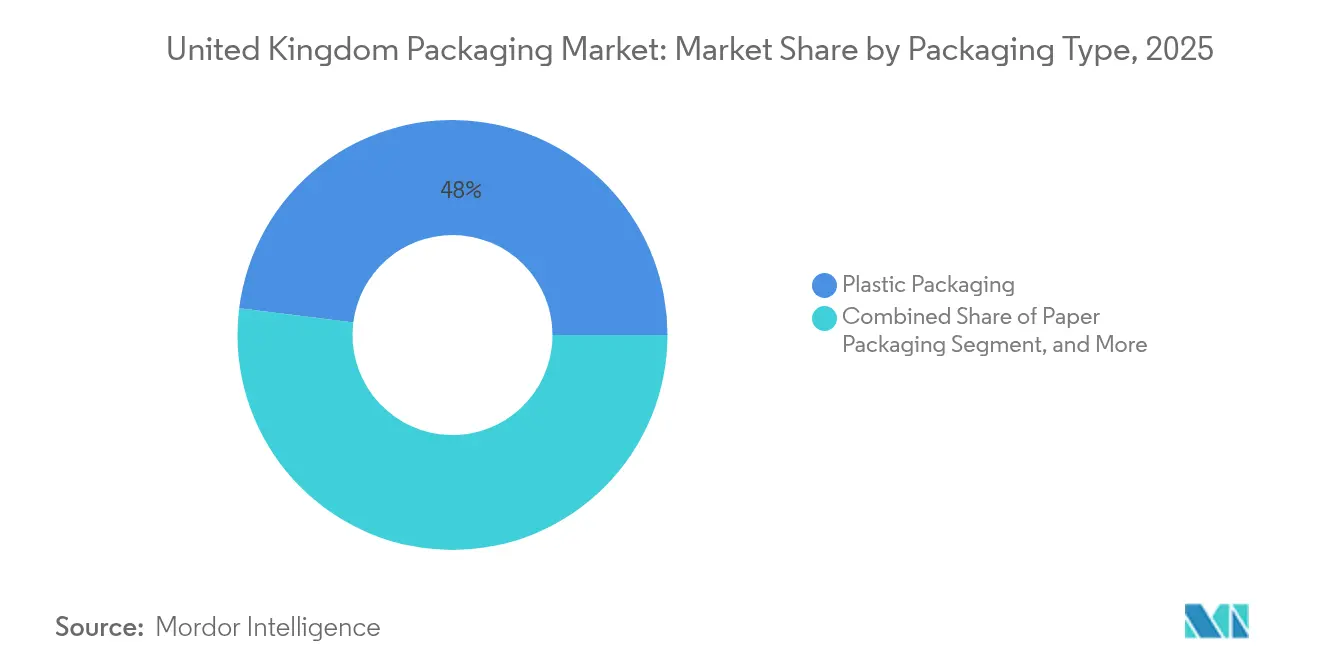
- By packaging type, plastic held 48.02% of United Kingdom packaging market share in 2025 while paper is projected to expand at a 4.62% CAGR through 2031.
- By packaging format, flexible solutions accounted for 54.40% of the United Kingdom packaging market size in 2025; rigid alternatives are forecast to grow at 3.58% CAGR to 2031.
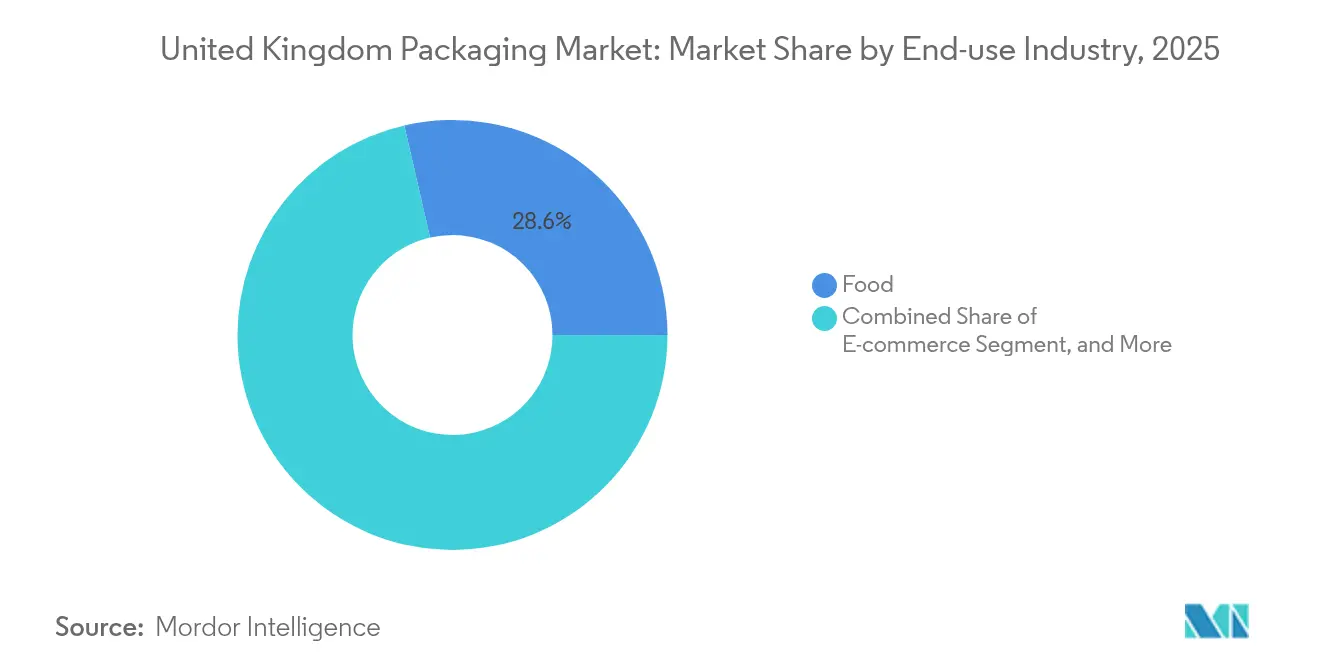
- By end-use sector, food applications led with 28.60% revenue share in 2025, whereas e-commerce packaging is advancing at a 5.28% CAGR through 2031.
Note: Market size and forecast figures in this report are generated using Mordor Intelligence’s proprietary estimation framework, updated with the latest available data and insights as of 2026.
United Kingdom Packaging Market Trends and Insights
Drivers Impact Analysis*
| Driver | (~) % Impact on CAGR Forecast | Geographic Relevance | Impact Timeline |
|---|---|---|---|
| Rising e-commerce driven demand for corrugated and flexible mailers | +0.8% | National – London, Manchester, Birmingham hubs | Medium term (2-4 years) |
| Shift toward recyclable and biobased materials due to UK Plastic Tax | +0.6% | National – higher adoption in England and Wales | Long term (≥ 4 years) |
| Premiumization and luxury packaging demand from millennials and tourism | +0.4% | National – London, Edinburgh, Bath luxury centers | Short term (≤ 2 years) |
| Growing FMCG private label expansion in discount channels | +0.3% | National – urban and suburban retail networks | Medium term (2-4 years) |
| Growth of dark kitchens and quick commerce creating single-portion needs | +0.5% | Urban centers – London, Manchester, Birmingham, Glasgow | Short term (≤ 2 years) |
| Adoption of digital printing for short runs enabling SME customization | +0.2% | National – London, Bristol, Leeds clusters | Medium term (2-4 years) |
| Source: Mordor Intelligence | |||
Rising E-commerce Driven Demand for Corrugated and Flexible Mailers
Online retail sales surged to 31.3% of national turnover in 2024, lifting shipment volumes for corrugated boxes and flexible mailers by 23%. Quick-commerce operators such as Getir stimulated single-portion packaging that combines tamper evidence with thermal integrity. Amazon’s automated packing lines cut packaging material intensity 15% and accelerated outbound throughput, setting new efficiency benchmarks. Subscription models from HelloFresh amplified demand for returnable insulation, while marketplace sellers gravitated toward right-sized mailers that curb dimensional-weight charges. These developments support continued expansion of corrugated and flexible formats within the United Kingdom packaging market.
Shift Toward Recyclable and Biobased Materials Due to United Kingdom Plastic Tax
The Plastic Packaging Tax extension in 2024 imposed a GBP 200 (USD 263) per-tonne levy on polymers lacking 30% recycled content, encouraging a 35% jump in reclaimed feedstock adoption.[1]Office for National Statistics, “Retail Sales Bulletin,” ons.gov.uk Unilever achieved 50% recycled plastic in United Kingdom personal-care lines, while Nestlé pledged fully recyclable solutions by 2025. Rising virgin resin differentials 18% above recycled inputs favor vertically integrated recyclers. Average compliance outlays reached GBP 2.3 million (USD 3.02 million) for large converters, prompting capital flows into wash-flake capacity and chemical recycling pilots. Sustainability requirements therefore accelerate material portfolio realignment across the United Kingdom packaging market.
Premiumization and Luxury Packaging Demand from Millennials and Tourism
Luxury packaging volumes climbed 28% in 2024 as tourist arrivals rebounded to 85% of pre-pandemic levels. Brands such as Burberry shifted toward eco-certified specialty papers and decorative finishes that convey exclusivity without compromising recyclability. Digital print workflows enabled profitable micro-runs, with average batch sizes falling 35% while unit margins rose. Heathrow’s duty-free outlets recorded 22% growth in high-value merchandise, raising demand for impact-resistant gift packs. These dynamics reinforce premiumization as a short-term the United Kingdom packaging market.
Growing FMCG Private Label Expansion in Discount Channels Requiring Cost-Efficient Packaging
Private label penetration reached 52% of grocery sales in 2024, propelled by discounters Aldi and Lidl. Tesco sought 15-20% unit-cost reductions through substrate light-weighting and supplier consolidation, catalyzing design-to-value initiatives. Inflation-driven bulk purchases lifted average pack sizes 12%, increasing corrugated transit packaging needs. Simultaneously, stricter allergen labeling heightened print complexity, favoring converters with inline variable-data capability. These factors strengthen cost-efficient design as a medium-term driver of the United Kingdom packaging market.
Restraints Impact Analysis*
| Restraint | (~) % Impact on CAGR Forecast | Geographic Relevance | Impact Timeline |
|---|---|---|---|
| High raw-material price volatility for resins and paper | -0.7% | National – Midlands and North England manufacturing bases | Short term (≤ 2 years) |
| Strict UK regulations on single-use plastics and EPR costs | -0.5% | National – compliance costs highest in England and Wales | Long term (≥ 4 years) |
| Supply-chain disruptions post-Brexit impacting import flows | -0.4% | National – Dover, Felixstowe, Southampton ports | Medium term (2-4 years) |
| Labor shortages in manufacturing and logistics | -0.3% | National – Midlands, Yorkshire, North West | Medium term (2-4 years) |
| Source: Mordor Intelligence | |||
High Raw-Material Price Volatility for Resins and Paper
Polyethylene resin prices jumped 22% in 2024, while recycled paper climbed 18% on energy cost spikes and supply constraints. Mondi’s United Kingdom operations reported 340-basis-point margin erosion, triggering downstream price hikes that tempered demand elasticity.[2]Mondi Group, “Investor Relations,” mondigroup.com Converters raised safety-stock thresholds 25-30% to secure continuity, yet carrying costs strained working capital. Energy-intensive extrusion lines curtailed output during peak tariff windows, underscoring volatility as a short-term drag on the United Kingdom packaging market.
Strict United Kingdom Regulations on Single-Use Plastics and Extended Producer Responsibility Costs
Extended Producer Responsibility fees averaged GBP 180 (USD 240.36) per tonne of packaging placed on the market in 2024, consuming 3-5% of revenue for smaller firms. Single-use bans removed GBP 890 (USD 1,188.4) million of annual demand, forcing rapid redesign of catering, retail and food-service packs. Administrative burdens required dedicated compliance teams, raising fixed overhead. International suppliers without local recycling links faced higher market-entry barriers, concentrating volumes among incumbents with established circular-value chains. Consequently, regulatory costs act as a long-term restraint on the United Kingdom packaging market.
*Our forecasts treat driver/restraint impacts as directional, not additive. The impact forecasts reflect baseline growth, mix effects, and variable interactions.
Segment Analysis
By Packaging Type: Plastic Dominance Faces Sustainability Pressure
Plastic accounted for 48.02% of the United Kingdom packaging market share in 2025, underpinned by its versatility across food, beverage and personal-care categories. Rigid PET bottle light-weighting shaved 25% material mass over the decade while integration of post-consumer resin boosted recycled content credibility. Yet tightening tax thresholds and retailer zero-plastic pledges pivot growth toward paper, which delivers the fastest 4.62% CAGR through 2031 on expanding e-commerce corrugated volumes. The United Kingdom packaging market size for paper substrates will continue to widen as mono-material designs simplify curbside recycling.
Glass and metal regained relevance in premium drinks due to infinite recyclability and high perceived quality, contributing 3.2% and 4.1% respective annual growth. Beverage can volumes surged as craft breweries exploited aluminum’s light weight and rapid chilling properties, offsetting higher input costs via volume efficiencies. Meanwhile, bio-polymer films entered specialty applications where compostability commands price premiums. These shifts indicate that plastic’s leadership persists but erodes marginally as sustainability criteria increasingly influence material selection within the United Kingdom packaging market.



By Packaging Format: Flexible Solutions Capture Convenience Demand
Flexible formats captured 54.40% of United Kingdom packaging market size in 2025, benefiting from 60-70% material savings compared with rigid equivalents. Stand-up pouches penetrated pet food, baby food and household cleaner segments, combining resealability with shelf impact. Digital print modularity shortened time-to-shelf, empowering SME brands to execute seasonal promotions without large inventories. Consequently, flexible packaging posts a 3.58% CAGR through 2031 as e-commerce parcel density and consumer convenience expectations advance.
Rigid options remain essential in pressurized beverage, pharmaceutical and industrial chemical applications demanding superior barrier and crush resistance. Innovation centers on resin engineering and optimised preform geometries to reduce weight while preserving strength. Hybrid structures pairing rigid bases with flexible lids blur categorical boundaries, illustrating how format choice adapts to performance, channel and legislative drivers inside the United Kingdom packaging market.
By End-use Industry: Food Security Drives Packaging Innovation
Food applications generated 28.60% of 2025 demand, anchored by extended shelf life and contamination protection priorities. Vacuum skin packs curbed protein spoilage, while modified-atmosphere lidding prolonged produce freshness. Beverage producers substituted clear PET with rPET content exceeding 50%, aligning with retailer recycling targets and lowering carbon footprints. E-commerce exhibits the strongest 5.28% CAGR as direct-to-consumer shipments and rapid-grocer models escalate.
Pharmaceutical and nutraceutical segments expanded through population aging and self-care trends, necessitating child-resistant, tamper-evident and senior-friendly closures. Personal care brands invested in refill pods and concentrated formats that slash packaging intensity. Industrial sectors adopted UN-approved drums with IoT sensors for traceability and reverse-logistics management, signaling broader digitization across the United Kingdom packaging market.
Geography Analysis
England contributes roughly 83.60% of United Kingdom packaging demand, reflecting population concentration and extensive manufacturing footprints. London and the South East favor premium substrates for luxury retail, beauty and giftware, whereas the Midlands hosts automotive and FMCG plants reliant on bulk industrial packaging. Port-centric regions such as Dover, Felixstowe and Southampton absorbed elevated customs checks post-Brexit, extending inbound lead times and inflating buffer-stock requirements.
Scotland leverages its whisky heritage to promote high-quality flint and amber glass, with Diageo investing in lightweight bottle lines and onsite furnace electrification. Renewable power availability positions the Central Belt as an attractive base for energy-intensive recycling operations. Wales capitalizes on historic steel capacity to support metal can production, while Northern Ireland serves cross-border food processors with integrated corrugated and chilled-chain solutions despite regulatory complexity.
Regional labor dynamics influence cost structures: London and South East wages exceed Northern England and Wales by 15-20%, incentivizing capacity shifts toward lower-cost zones. Government leveling-up grants encouraged greenfield investments in the North East for corrugated and flexographic printing lines, balancing regional growth and reducing carbon miles. Collectively, these patterns underscore geographic fluidity as converters optimize networks to serve the evolving United Kingdom packaging market efficiently.
Regulatory Landscape
The United Kingdom packaging market operates under a compliance framework that is increasingly both cost- and data-intensive, with Extended Producer Responsibility (EPR) and the Plastic Packaging Tax (PPT) at the center. EPR is governed by the Producer Responsibility Obligations (Packaging and Packaging Waste) Regulations 2024, as amended in 2025. This shifts household packaging waste management costs onto producers and tightens reporting and fee-setting processes via the scheme administrator (PackUK), with oversight across the four nations.
Tax and standards settings continue to evolve. Under the Finance Act 2026, the PPT rate rose to GBP 228.82 per tonne from 1 April 2026 for plastic packaging that does not meet the recycled-content threshold, increasing the pressure to redesign packs and secure verifiable recycled inputs. HM Revenue and Customs opened a May 2026 consultation on mandatory certification for mechanically recycled plastic for PPT purposes. The policy changes already signposted include introducing a mass balance approach for chemically recycled plastic and removing pre-consumer plastic as qualifying recycled content from 1 April 2027, both of which increase traceability requirements for converters and importers.
Value Chain Analysis
The United Kingdom packaging value chain runs from upstream feedstocks (polymers, paper and board, metals, glass, inks and adhesives) through conversion (extrusion, moulding, canmaking, glass forming, corrugating, flexographic and digital printing), brand and retail packing operations, and downstream logistics into food, beverage, pharmaceutical, personal care, industrial and e-commerce channels. Post-Brexit border processes and the Border Target Operating Model have increased documentation and lead-time management needs, which is reinforcing local sourcing, customs automation, and inventory buffering around major gateways such as Dover, Felixstowe and Southampton.
Downstream circularity is increasingly embedded in day-to-day operations, as producers fund collection and recycling through PRNs/PERNs and EPR waste-disposal fees. This tightens the link between design choices and end-of-life costs. Capacity and investment moves in 2026 also point to a shift toward fiber-based formats and recycling capability. Pulpex began construction of an 87,000 sq ft facility near Glasgow Airport targeting up to 50 million fiber bottles per year, Paranova completed a GBP 5 million upgrade at St Neots to expand fiber-based food-to-go packaging capacity, and Cullen Sustainable Packaging announced a GBP 5 million expansion in Glasgow for moulded fiber and corrugate. On the plastics side, upgrades such as Amcor's Heanor recycling facility improvements reinforce the dependence of both flexible and rigid packaging supply on consistent, specification-grade recyclate streams.
Competitive Landscape
The top five suppliers control about 35% of United Kingdom packaging value, indicating moderate concentration and leaving scope for agile mid-tier specialists. International Paper’s acquisition of DS Smith consolidated corrugated leadership and delivered procurement synergies, but drew attention from the Competition and Markets Authority.[3]Competition and Markets Authority, “Merger Investigations,” GOV.UK Smurfit WestRock’s USD 180 million plant upgrade expanded e-commerce-centric converting capacity, reinforcing speed-to-market capabilities.
Mondi’s proprietary barrier coatings unlock recyclable mono-material food wraps, while Sealed Air’s bubble-free cushioning reduces void fill by 90% for parcel shippers. Digital press platforms from Canon and HP enable SKU proliferation without prohibitive tool costs, supporting startup brands and private-label lines. Sustainability credentials increasingly influence tender awards, driving suppliers to certify carbon footprints, validate recycled content, and disclose circular roadmaps.
Labor automation mitigates skilled-worker shortages and maintains consistent quality. Vision-inspection, cobot palletizing and warehouse robotics proliferate, trimming unit labor costs and enhancing traceability. In parallel, data analytics optimize production scheduling, raw-material ordering and energy usage. Collectively, these strategic moves highlight how capital investment, environmental stewardship and customer intimacy shape competition within the United Kingdom packaging market.
United Kingdom Packaging Industry Leaders
International Paper Company
Smurfit WestRock
Amcor plc
Mondi plc
Ball Corporation
- *Disclaimer: Major Players sorted in no particular order

Market Opportunities and Future Outlook
Opportunities are clustering around pack redesign, materials substitution, and recycling infrastructure that reduce EPR and Plastic Packaging Tax exposure while keeping retailer and brand specifications in scope. With the Plastic Packaging Tax rate set at GBP 228.82 per tonne from 1 April 2026 and EPR moving toward modulation, demand is shifting toward mono-material designs, higher recycled-content formats, and fiber-based alternatives, especially in high-volume applications such as e-commerce mailers and food-to-go. The 2026 investment wave in fiber packaging production, including Pulpex's Glasgow-area fiber bottle facility build and Paranova's St Neots capacity upgrade, reflects active scaling of plastic-free and recyclable options within the United Kingdom.
A second opportunity is the build-out of domestic recycling capacity for difficult-to-recycle plastics, which helps converters manage supply security while improving compliance credentials for brands. Planning approval in July 2026 for Endolys' Darlington pyrolysis project (GBP 125 million, 120,000 tonnes per year) and public support for solvent-based recycling development (ReVentas, Livingston) indicate momentum behind advanced recycling routes that can broaden feedstock availability beyond traditional rigid streams. In parallel, tighter EPR data governance, including PackUK deadlines affecting 2025 packaging data resubmissions, is raising the value of digital traceability, certified recycled inputs, and closed-loop programs that simplify reporting across multi-material portfolios.
Recent Industry Developments
- July 2026: Smurfit WestRock confirmed the closure of its SSK paper mill in Birmingham, with production scheduled to cease on July 27, 2026 and around 200,000 tonnes of annual fluting and liner capacity removed from the UK system. The move tightens local paper-based packaging supply and pushes corrugated and paper packaging buyers to rebalance sourcing across remaining UK and European networks.
- August 2025: Amcor completed upgrades to its Heanor, United Kingdom recycling facility to improve the consistency of recycled output and add around 2,800 tonnes of additional recyclate for flexible packaging. The investment supports tighter recycled-content specifications demanded by brand owners and helps stabilize feedstock availability as tax and EPR costs increase the value of compliant recycled inputs.
- December 2024: Ball Corporation inaugurated a USD 200 million beverage-can plant in Wakefield, adding 2 billion units of annual output. The new capacity strengthens domestic supply for beverage brands and supports lightweighting and can-format adoption by reducing reliance on imports and improving service levels for high-throughput filling operations.


Research Methodology Framework and Report Scope
Market Definition and Coverage
For this study, the United Kingdom packaging market is defined as the value of packaging products sold for use across major end-use industries in the UK, covering common materials and formats used to contain, protect, and distribute goods.
Scope exclusions: It excludes packaging machinery and services such as contract packing, logistics, and waste collection and recycling services (even when these activities influence packaging demand).
Segmentation Overview
- By Packaging Type
- Plastic Packaging
- By Type
- Rigid Plastic Packaging
- By Material Type
- Polyethylene (PE)
- Polypropylene (PP)
- Polyethylene Terephthalate (PET)
- Polyvinyl Chloride (PVC)
- Polystyrene (PS) and Expanded Polystyrene (EPS)
- Other Material Types
- By Product Type
- Bottles and Jars
- Caps and Closures
- Trays and Containers
- Other Product Types
- By End-use Industry
- Food
- Beverage
- Pharmaceutical
- Cosmetics and Personal Care
- Industrial
- Other End-use Industry
- By Material Type
- Flexible Plastic Packaging
- By Material Type
- Polyethylene (PE)
- Biaxially Oriented Polypropylene (BOPP)
- Cast Polypropylene (CPP)
- Other Material Types
- By Product Type
- Pouches and Bags
- Films and Wraps
- Other Product Types
- By End-use Industry
- Food
- Beverage
- Pharmaceutical
- Cosmetics and Personal Care
- Industrial
- Other End-use Industry
- By Material Type
- Rigid Plastic Packaging
- By Product Type
- Bottles and Jars
- Pouches and Bags
- Bulk-Grade Products
- Other Product Types
- By End-use Industry
- Food
- Beverages
- Cosmetics and Personal Care
- Pharmaceuticals
- Industrial
- Other End-use Industry
- By Type
- Paper Packaging
- By Product Type
- Folding Carton
- Corrugated Boxes
- Liquid Paperboard
- Other Product Type
- By End-use Industry
- Food
- Beverages
- E-commerce
- Other End-use Industry
- By Product Type
- Container Glass
- By Color
- Green
- Amber
- Flint
- Other Colors
- By End-use Industry
- Food
- Beverage
- Alcoholic
- Non-Alcoholic
- Personal Care and Cosmetics
- Pharmaceuticals (excluding Vials and Ampoules)
- Perfumery
- By Color
- Metal Cans and Containers
- By Material Type
- Steel
- Aluminum
- By Product Type
- Cans
- Drums and Barrels
- Caps and Closures
- Other Product Type
- By End-use Industry
- Food
- Beverage
- Chemicals and Petroleum
- Industrial
- Paints and coatings
- Other End-use Industry
- By Material Type
- Plastic Packaging
- By Packaging Format
- Flexible
- Rigid
- By End-use Industry
- Food
- Beverage
- Pharmaceuticals and Healthcare
- Personal Care and Cosmetics
- Industrial
- E-commerce
- Other End-use Industry
Data Sources, Market Sizing, and Validation
Desk Research
Desk research was used to map the UK packaging demand environment and to anchor the model to consistent public reference points. We relied on sources such as the UK Office for National Statistics, UK Parliament and government policy releases (including packaging waste and tax updates), HM Revenue and Customs trade statistics, and regulator or environmental agency publications that track packaging obligations and materials flows.
Alongside this, we reviewed company annual reports and investor presentations for volume and pricing commentary, plus trade association updates and reputable industry press to capture changes in sustainability requirements and end-market consumption. Where helpful, paid subscriptions for company financials and news were used to cross-check revenues, corporate structure changes, and expansion announcements. The desk sources listed above are illustrative and not exhaustive, and many other public references were used for data collection, validation, and clarification.
Primary Interviews and Surveys
Primary work was done through expert interviews and structured surveys with packaging producers, converters, distributors, and large end users such as food, beverage, healthcare, and personal care brands. We also spoke with industry specialists who track regulation and materials shifts, which helped confirm how pricing is negotiated in practice, where substitution between materials shows up first, and how quickly demand effects move across the United Kingdom.
Distribution of primary research fieldwork respondents
| Company type | Respondent position |
|---|---|
| Top tier: 31% | CXOs: 14% |
| Mid tier: 50% | Functional/Unit leaders: 42% |
| Smaller Players: 19% | Managers: 44% |
Market-Sizing & Forecasting
The core sizing logic uses a top-down build where packaging demand is reconstructed from end-use output and consumption indicators in the UK, which are then converted into packaging value through material mix and price assumptions. To keep the totals realistic, results are corroborated with selective bottom-up approximations such as supplier revenue roll-ups, channel checks, and sampled average selling price multiplied by estimated volumes for key packaging formats.
Inputs that matter in this market include food and beverage production and retail demand trends, e-commerce shipment intensity (which lifts secondary and transit packaging), announced sustainability targets and compliance timelines, the mix shift between rigid and flexible formats, and resin, paper, and energy cost movements that influence packaging pricing. Where direct data was missing for smaller niches, gaps were handled by applying conservative penetration rates and then re-checking them with interview feedback before being finalized.
For the forecast, we used scenario analysis supported by short trend models (including smoothing on key input series) so that near-term volatility from regulation and input costs could be separated from steady demand drivers. Assumptions on volume growth and pricing were stress-tested with primary respondents, and the final outlook was kept traceable to a short list of variables that can be refreshed each year.
Data Validation & Update Cycle
Validation is done through triangulation across the model outputs, public indicators, and what we heard in primary conversations, and then through structured variance checks on growth rates, material splits, and implied pricing. When results fall outside expected ranges, we re-open the drivers and adjust assumptions only after the change is supported by at least two independent signals.
A multi-step internal review is followed before sign-off, which includes consistency checks across historical years and cross-verification against adjacent packaging categories. Reports are refreshed annually, and interim updates are triggered when major policy changes, sharp input-cost swings, or notable capacity shifts occur. Before delivery, an analyst completes a fresh pass to ensure the latest events are reflected in the final numbers.
Mordor Intelligence's United Kingdom Packaging Market Size Compared With Other Published Estimates
Published market sizes for UK packaging often do not match because the boundaries are not identical, even when the titles look similar. Differences usually come from what is counted as packaging value, how pricing is treated, and whether the estimate is aligned to production, consumption, or trade flows.
By tracking end-use output signals and checking price and material mix assumptions across the study period, Mordor Intelligence keeps the UK packaging total tied to the pack types and end-user demand that are actually in scope, instead of blending in services or using one broad price factor across materials.
Benchmark comparison
| Source | Market Size | Gaps in Research Methodology |
|---|---|---|
| Mordor Intelligence | USD 60.94 B (2025) | |
| Industry Publisher A | USD 26.28 B (2025) | Often reflects a narrower value boundary that can overweight consumer packaging formats while undercounting industrial and transit packaging, and it may use a tighter definition of packaging revenue that excludes parts of secondary and tertiary packaging value chains. |
| Regional Consultancy B | USD 32.80 B (2026) | Uses a different base year and can apply a broader sustainable-packaging lens that shifts category mapping and pricing assumptions. The estimate may also rely more on stated forecast CAGR targets, with fewer disclosed cross-checks against end-use production and trade indicators. |
The spread in the table is mainly explained by scope boundaries and how value is translated from volumes to dollars, especially when packaging types and end uses are grouped differently. Our approach stays repeatable by linking the total to a small set of observable UK demand signals, and then confirming the implied pricing and mix with market participants before finalizing the number.


Key Questions Answered in the Report
What is the current value of the United Kingdom packaging market?
The United Kingdom packaging market size stands at USD 62.26 billion in 2026.
How fast is the United Kingdom packaging sector expected to grow?
The market is projected to register a 2.16% CAGR, reaching USD 69.27 billion by 2031.
Which material type is expanding the quickest?
Paper packaging leads growth with a 4.62% CAGR thanks to e-commerce and sustainability mandates.
What segment represents the largest share of demand?
Food applications command 28.60% of total demand, reflecting stringent shelf-life and safety needs.
How will e-commerce influence future packaging demand?
E-commerce packaging is forecast to post the fastest 5.28% CAGR, driven by direct-to-consumer shipments and quick-commerce services.
Which United Kingdom policy most affects packaging material choices?
The Plastic Packaging Tax, which charges GBP 200 per tonne on packs containing less than 30% recycled content, strongly encourages recyclable and bio-based alternatives.
Page last updated on:





