
Web Scraping Market Size and Share
Web Scraping Market Analysis by Mordor Intelligence
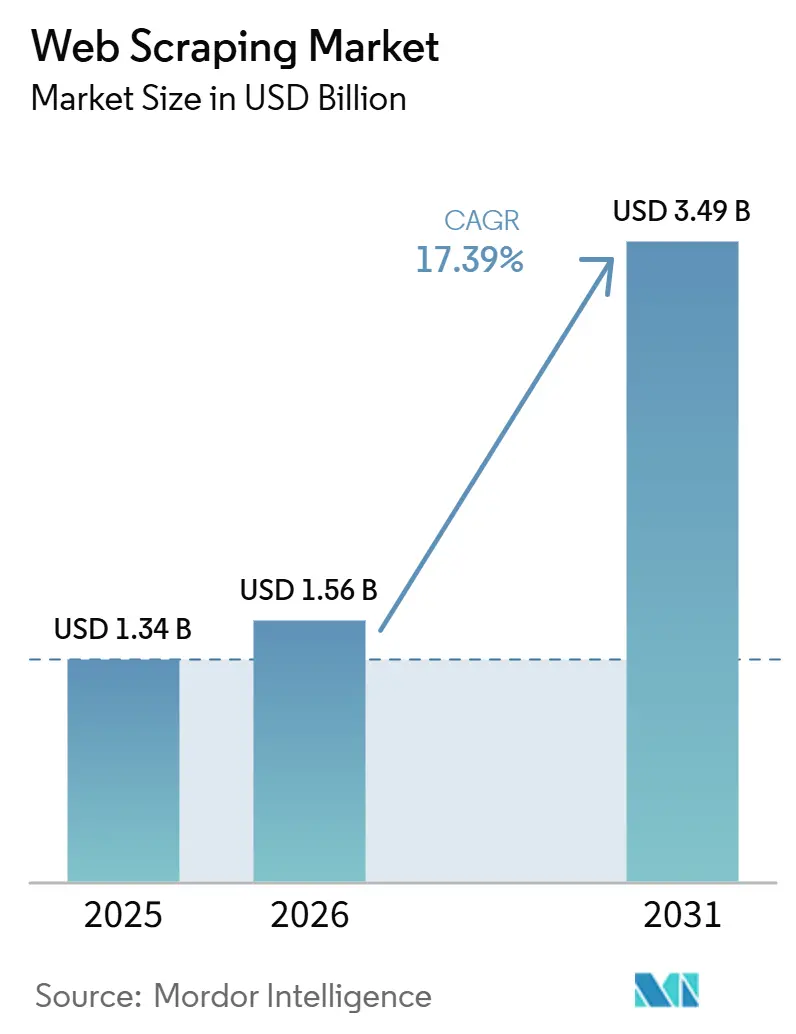
The web scraping market size was valued at USD 1.56 billion in 2026 and estimated to grow from USD 1.83 billion in 2027 to reach USD 4.03 billion by 2032, at a CAGR of 17.08% during the forecast period (2027-2032).
Online retail growth in the United States and the use of web-derived data by investment firms sustain recurring demand for collection. AI-assisted extraction produces schema-constrained records, giving teams defined output fields to check before analysis. Restricted platform access also raises the value of validating what each collection route retrieves. Suppliers choose between selling reusable software and delivering finished datasets, taking responsibility for different parts of collection. Protected-site costs and legal restrictions constrain how broadly those services can collect and sustain delivery.
Key Report Takeaways
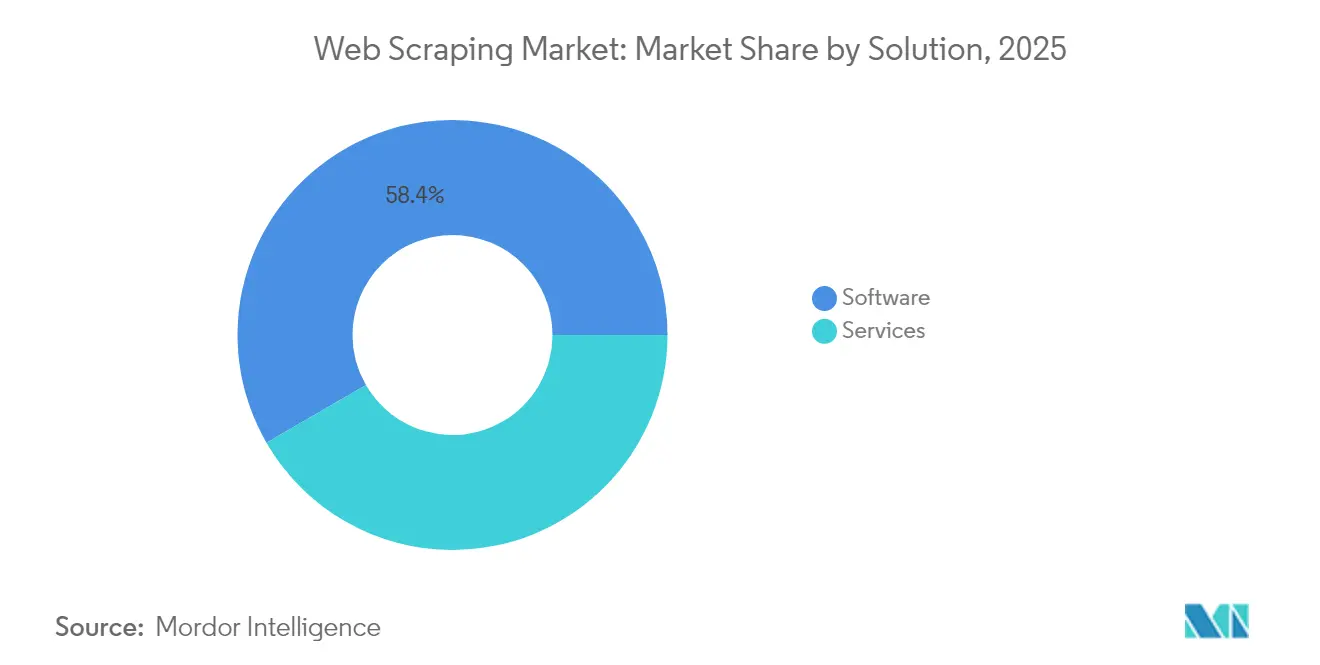
- Within solutions, software held a 57.93% web scraping market share in 2026, while services are forecast to grow fastest at a CAGR of 18.35% during 2027-2032.
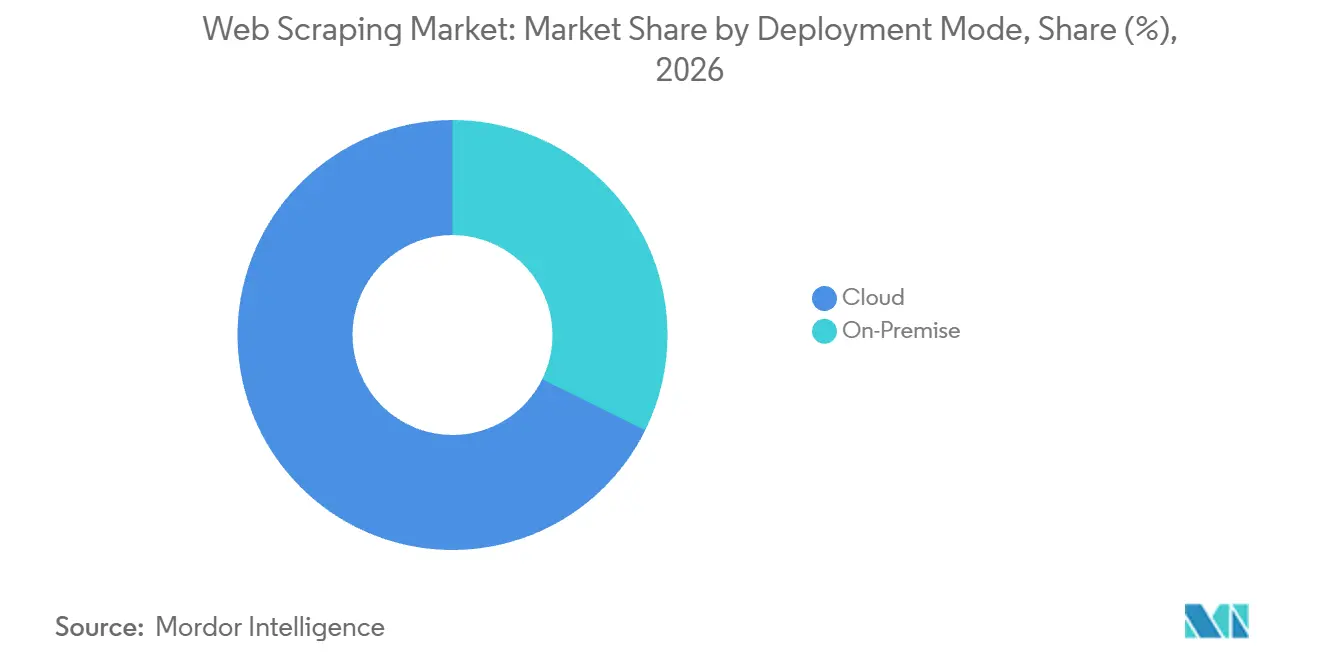
- Cloud deployment accounted for a 67.7% share of the web scraping market size in 2026 and is forecast to grow fastest at a CAGR of 17.52% during 2027-2032.
- Among end-user industries, BFSI led with 29.39% of revenue in 2026, whereas the advertising and media segment is forecast to grow fastest at a CAGR of 18.5% during 2027-2032.
- By use case, data scraping / ETL led with 35.89% of revenue in 2026, with price and competitive monitoring projected to grow fastest at a CAGR of 18.05% during 2027-2032.
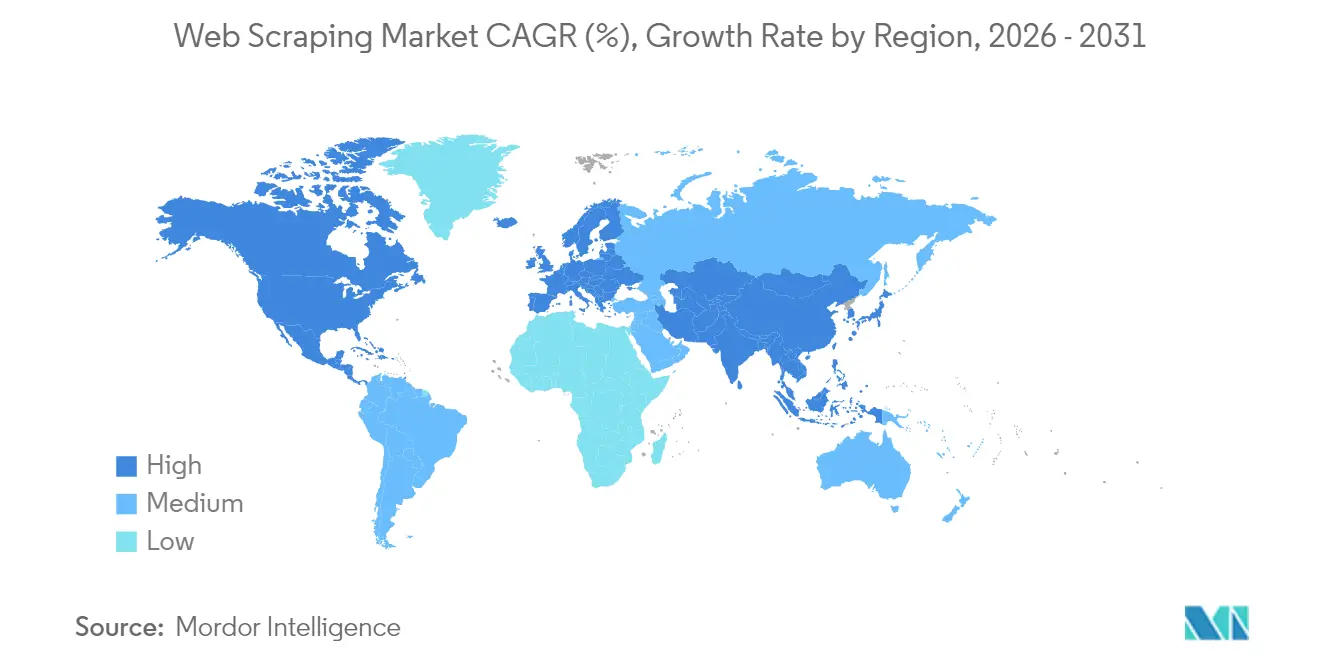
- Geographically, North America held 33.94% of revenue in 2026, while Asia-Pacific is forecast to grow fastest at a CAGR of 18.35% during 2027-2032.
Note: Market numbers in this report are based on Mordor Intelligence's proprietary estimation framework, which combines nine months of actuals with Q4 projections for base year 2026.
Market Trends and Insights
Drivers Impact Analysis of Web Scraping Market*
| Driver | (~) % Impact on CAGR Forecast | Geographic Relevance | Impact Timeline |
|---|---|---|---|
| Growth of e-Commerce and Online Marketplaces | +5.1% | North America and Asia-Pacific | Short term (≤ 2 years) |
| Advancements in AI/ML for Data Extraction | +4.6% | North America, Europe and Asia-Pacific | Short term (≤ 2 years) |
| Rising Demand for Alternative Data in Finance | +4.1% | North America and Europe | Medium term (2-4 years) |
| API Deprecation on Major Platforms Fueling Scraping | +3.6% | United States and Europe | Short term (≤ 2 years) |
| Gen-AI Training Data Requirements | +3.2% | North America and Asia-Pacific | Long term (≥ 4 years) |
| Open-Data Mandates Revealing Data Gaps | +1.8% | Germany, France and Spain | Medium term (2-4 years) |
| Source: Mordor Intelligence | |||
Growth of e-Commerce and Online Marketplaces
A larger flow of online sales increases the commercial value of observing prices and availability across digital storefronts. Seasonally adjusted U.S. retail e-commerce sales reached USD 340.2 billion in Q2 2026, up 12.2% (±0.9%) from Q2 2025 without adjustment for price changes. Total U.S. retail sales rose 6.7% (±0.5%) over the same period, so online price observations concern a channel gaining sales weight. For retailers following a recurring product set, the collection task is to separate price changes from assortment changes. Comparing matched products across collection runs can ground the next offer adjustment in a rival's repricing instead of an apparent price shift caused by a different product mix.
Advancements in AI/ML for Data Extraction
AI-assisted spider development can widen the range of target sites a collection team can afford to maintain. During Q2-Q3 2025, ScrapeGraphAI collected about 9 million opt-in telemetry events from production use of its open-source web-extraction library. The researchers deduplicated and balanced those raw events by schema into a released dataset of 93,695 extraction events. In March 2026, Zyte made Web Scraping Copilot 1.0 generally available, a Visual Studio Code extension that uses AI to generate, test, and deploy Scrapy spiders. Bringing those tasks into the developer's editor can reduce engineering effort per target site and widen the economically feasible scope of a team's Scrapy-based program.
Rising Demand for Alternative Data in Finance
In a September-October 2025 survey of 56 buy-side firms in the United States, United Kingdom, and Europe, Crisil Coalition Greenwich found that 63% of investors planned to increase alternative-data spending. In a March 2026 disclosure, AQR said its adviser uses alternative data to manage certain funds, including consumer behavior, social media sentiment, and internet search and traffic data. That disclosure warned that providers' often less robust information technology infrastructure can leave datasets suspended, delayed, or unavailable. Spending intentions broaden the potential opportunity for alternative-data suppliers, while AQR's warning of possible interruptions highlights the importance of supply continuity. For investment teams, a provider interruption can remove a model input at the next update. Supply continuity can then distinguish otherwise suitable data providers.
API Deprecation on Major Platforms Fueling Scraping
In interviews conducted from October 2024 to February 2025, social-media researchers described web scraping as an alternative to platform APIs and raised legal, ethical, and reliability concerns. Reddit announced on August 5, 2026, that it would gradually restrict new public API requests.[1] Reddit also plans to begin removing Data API access for unregistered or unengaged apps and users on January 12, 2027, and to end remaining public API access in March 2027. A 2026 TikTok study found that API and front-end scraping tools retrieved content with different time periods and popularity levels. For buyers facing restricted access, these differences make an alternative collection route commercially useful only when its output fits the intended analysis. Reddit's plan to end remaining public API access in March 2027 gives teams that now depend on API pulls a fixed date by which any replacement route needs its coverage checked.
Restraints Impact Analysis of Web Scraping Market*
| Restraint | (~) % Impact on CAGR Forecast | Geographic Relevance | Impact Timeline |
|---|---|---|---|
| Legal and Ethical Uncertainty | -2.2% | United States and China | Medium term (2-4 years) |
| High Costs and Technical Complexity | -1.6% | United States and United Kingdom | Short term (≤ 2 years) |
| Advanced Bot-Mitigation Tools Increase Failure Rates | -1% | United States and United Kingdom | Short term (≤ 2 years) |
| Official APIs Cannibalizing Some Scraping Use Cases | -0.5% | North America and Europe | Medium term (2-4 years) |
| Source: Mordor Intelligence | |||
Legal and Ethical Uncertainty
A dataset can lose its commercial usefulness when its acquisition method creates a deletion obligation. In July 2025, LinkedIn said its resolution required Proxycurl to permanently delete LinkedIn data obtained through unauthorized means and stop accessing LinkedIn unlawfully. LinkedIn described the case as involving unauthorized scraping using fake accounts and other fraudulent activity. For a buyer, a comparable restriction would disrupt workflows dependent on the affected records. The same resolution barred Proxycurl from further unlawful access to LinkedIn, so the route that produced the deleted records could not be used to rebuild them.
High Costs and Technical Complexity
Protected websites create a cost threshold that can limit the economic reach of a scraping program. In a December 2025 survey, 88.7% of respondents reported increased costs when targeting websites protected by anti-bot measures.[2] For scraping practitioners, higher collection expense increases the resources needed to add protected targets to a program. That burden raises the expense of adding each protected target to a program, which can limit how many such targets a team takes on. Greater coverage or more frequent collection must absorb the reported cost pressure.
*Our forecasts treat driver/restraint impacts as directional, not additive. The impact forecasts reflect baseline growth, mix effects, and variable interactions.
Web Scraping Market Segment Analysis
By Solution:
Reusable Software Leads While Data Services ExpandSoftware accounted for a 57.93% share of the web scraping market size in 2026. Apify reports a worldwide customer base of 91,000 for its web-scraping and browser-automation platform. With a software platform, a buyer can retain the extraction logic it configures and apply it to successive collection runs. Repeated collection derives economic value from reusable code and workflow configuration because it draws on an existing implementation. The platform can scale through shared execution infrastructure while preserving customer-specific routines.
Services are the fastest-growing segment, with a projected CAGR of 18.35% during 2027-2032. On December 1, 2025, Statistics Canada awarded Mobius365 Knowledge Services, Inc. a contract for web-scraped data from Canadian websites.[3] The award covered statistical and research purposes from April 1, 2026, through March 31, 2027, with 4 one-year extension options. The agency specified that it was acquiring data, keeping the contract focused on delivered information rather than software or a SaaS license. Potential renewal value depends on performance on the requested dataset under a continuing data-supply obligation.

By Deployment Mode:
Cloud Scale Meets Operator ControlCloud represented a 67.7% web scraping market share in 2026 and is the fastest-growing segment, with a CAGR of 17.52% during 2027-2032. Apify runs its web-scraping, data-extraction, and automation platform in the cloud through serverless programs called Actors. The company reports processing more than 1 petabyte of data monthly across that platform. Supplier-run execution can fit a buyer whose collection demand varies across runs, because capacity can be considered separately from the definition of the requested records. Cloud concentrates the capacity obligation with the platform supplier, so a buyer can run high-volume collection without provisioning each environment separately.
On-premise deployment places the collection environment under the operator's direct control, bringing configuration and maintenance into the same organizational boundary. For an organization that needs collected records and extraction logs to stay on its own network, local execution aligns the crawler with that internal requirement. The organization must then staff crawler operation, proxy configuration, and parsing repairs as part of the collection program. A changing page layout can consume that team's time even when the desired data fields remain the same. The case for retaining local execution rests on that internal data-handling requirement, with parser upkeep treated as a continuing cost of meeting it.
By End-user Industry:
Investment Workflows and Advertising Intelligence Shape DemandBFSI was the largest segment, representing 29.39% of market revenue in 2026. Lowenstein Sandler's 2025 survey covered respondents from private equity firms, hedge fund managers, and venture capital firms. It identified web scraping among data sources used in custom AI systems for investment research, portfolio optimization, or trading. For such buyers, extraction supplies potential model inputs, while investment research, portfolio optimization, and trading involve different decisions about how those inputs should be used. Tailoring delivered variables to one investment task gives an extraction supplier a clear basis for integration work within the model that uses those records.
The advertising and media segment is the fastest-growing segment, with a projected CAGR of 18.5% during 2027-2032. Adbeat crawls 1.3 million pages and detects, analyzes, and processes 3.8 million ads daily. Daily processing at that scale shows how advertising intelligence creates recurring page-fetching and ad-processing workloads. For advertisers comparing rival campaigns, collecting the same publisher set on successive days can distinguish new placements from earlier observations. The commercial opportunity lies in maintaining that campaign history, so collection frequency matters alongside the number of pages covered.
By Use Case:
Repeatable Pipelines Support Competitive VisibilityData scraping / ETL was the largest segment, accounting for 35.89% of market revenue in 2026. This use case turns web pages into structured records that can move through extraction, transformation, and loading steps. Its economic role is horizontal, because the same collection infrastructure can feed several downstream analyses without prescribing a single decision. For a buyer combining multiple web sources, the critical design choice is where to standardize records before passing them into other systems. At that handoff, an extraction provider can sell reliable inputs independently of the downstream analytics software.
Price and competitive monitoring is the fastest-growing segment, with a projected CAGR of 18.05% during 2027-2032. On October 7, 2026, RateGain Travel Technologies announced that Vietnam Airlines had selected its AirGain fare-intelligence platform. The announced coverage included 300+ airlines, 170+ online travel agencies, and 50+ metasearch platforms. That breadth shows why competitive monitoring needs an observation frame covering both direct suppliers and intermediaries, since the channels chosen define what the dataset represents. The relevant coverage decision is which airline and intermediary channels to monitor together, because a carrier-only feed would address a narrower pricing question.
Geography Analysis
North America Web Scraping Market
North America accounted for a 33.94% share of the web scraping market size in 2026. Statistics Canada's October 2025 CPI program details identify automated web scraping, retailer transaction files, and manual online collection as non-traditional price sources. A mixed-source program embeds web extraction within an existing measurement system, where price comparisons depend in part on the collection channel. For the statistical operator, an automated price series must fit the same monthly production cycle as transaction files and manually collected observations.
Asia-Pacific Web Scraping Market
Asia-Pacific is the fastest-growing region, with a projected CAGR of 18.35% during 2027-2032. Indonesia's national statistics agency, through its distribution and services statistics unit, used web scraping in 2025 to collect prices for several commodities from marketplace sites. As of June 2026, the Australian Bureau of Statistics uses web scraping to extract pricing, product, and other information from specific websites for statistical purposes. For Australia's CPI, the ABS says web-scraped data represents a 500-fold increase in prices collected compared with manual collection. Moving price collection from manual visits to automated routines expands the observations a program can refresh, increasing extraction workloads within these statistical uses.
In South America, ChileCompra's January 2026 tender sought mass price capture and recurring monitoring, including web scraping, for products in government framework agreements. In Europe, Statistics Iceland scraped around 490 gasoline and diesel prices from company websites on Friday during each monthly collection week for its 2025 Harmonised Index of Consumer Prices. Within Middle East and Africa, an August 2026 IMF report described Kenya National Bureau of Statistics' significant progress stabilizing web-scraping collection for a first-time residential-property price index, despite data-quality and model-robustness challenges, especially outside Nairobi. In the Middle East, Article 15 of the UAE Open Finance Regulation restricts scraping for activities subject to that regulation, except as permitted under applicable laws. Local product scope and data-quality conditions define these price programs, while covered UAE financial activities face an additional legal boundary.
Regulatory Framework and Outlook
The comparison covers selected jurisdictions from the perspective of commercial suppliers collecting web data, including personal data where their services involve it. Policy attractiveness reflects the clarity and operational burden of the compared access and personal-data rules for that supplier. Obligations depend on the supplier's actual activity because the frameworks set different conditions for access methods, automated collection, and personal information handling.
Regulatory Table of Web Scraping Market
| Decision factor | United States | Brazil | Germany | China |
|---|---|---|---|---|
| Primary authority | United States Secret Service, among authorized investigative agencies | National Data Protection Authority (ANPD) | Competent state (Land) data-protection authorities | Cyberspace Administration of China for coordination, with other competent authorities |
| Key instruments or direction | Computer Fraud and Abuse Act, 18 U.S.C. § 1030 | LGPD, Articles 3 and 7; aggregator guidance in internal drafting | GDPR Article 14; Federal Data Protection Act § 40; Digital Omnibus proposal | Network Data Security Management Regulations, Article 18, effective January 1, 2025 |
| Commercial effect | Intentional access without or beyond authorization that obtains covered information can trigger criminal exposure | Territorially covered personal-data processing needs an Article 7 legal basis | Controllers obtaining personal data indirectly must provide specified information to data subjects, subject to Article 14 exceptions | Covered network-data processors using automated access must assess service effects; unlawful intrusion and interference are prohibited |
| Current policy attractiveness | Medium | Medium | Medium | Low |
| Future direction of policy attractiveness | No change | Hardening | Easing | No change |
| Source: Mordor Intelligence | ||||
Under the United States' conduct-based access test, the authorization conditions of a collection route are a continuing commercial consideration. In Brazil, territorially covered personal-data processing needs an Article 7 legal basis, while ANPD's aggregator guidance remained in internal drafting without public consultation on October 20, 2026. German controllers obtaining personal data indirectly owe Article 14 information duties with exceptions, while the November 2025 Digital Omnibus simplification proposal remained in the co-legislative process in October 2026. China's automated-access assessment duty makes the effect on network services an operational responsibility for covered processors, supporting continuity under the rule effective January 1, 2025.
Value Chain Stages
The value chain compares crawler setup, structured extraction, and the quality control needed to deliver usable datasets. The central commercial distinction is between supplying extraction tools and accepting responsibility for the resulting records. A supplier spanning several stages can connect implementation revenue with continuing delivery work, but also assumes responsibility for failures that cross those stages. Tool providers earn software revenue, while suppliers delivering checked datasets earn service revenue and carry responsibility for the quality-control stage.
Value Chain Analysis Table of Web Scraping Market
| Primary activity | Key participants | Value capture | Bottleneck | Resilience response |
|---|---|---|---|---|
| Crawler setup | Managed crawler operators such as PromptCloud Technologies Pvt Ltd | Managed extraction service revenue | Defining target fields and collection scope | Agree on sample records and collection boundaries before scaling |
| Page extraction and structuring | Extraction software providers such as Bright Data Ltd., Zyte Group Ltd., Apify Technologies s.r.o. | Software and extraction API revenue | Maintaining consistent fields across page variations | Test extraction against representative page types and validate required fields |
| Quality control and dataset delivery | Quality-control and delivery providers such as PromptCloud Technologies Pvt Ltd; managed delivery providers such as Zyte Group Ltd. | Managed data-delivery service revenue | Detecting incorrect records before delivery | Combine record validation with targeted exception review |
| Source: Mordor Intelligence | ||||
PromptCloud's combination of machine-learning and human quality checks illustrates a delivery responsibility that extends beyond collecting page content. That responsibility gives managed providers a basis for capturing value from the reliability of the delivered dataset. Further automation would shift the commercial test toward identifying exceptions economically, because a larger collection has limited value when unusable records pass through undetected.
Competitive Landscape
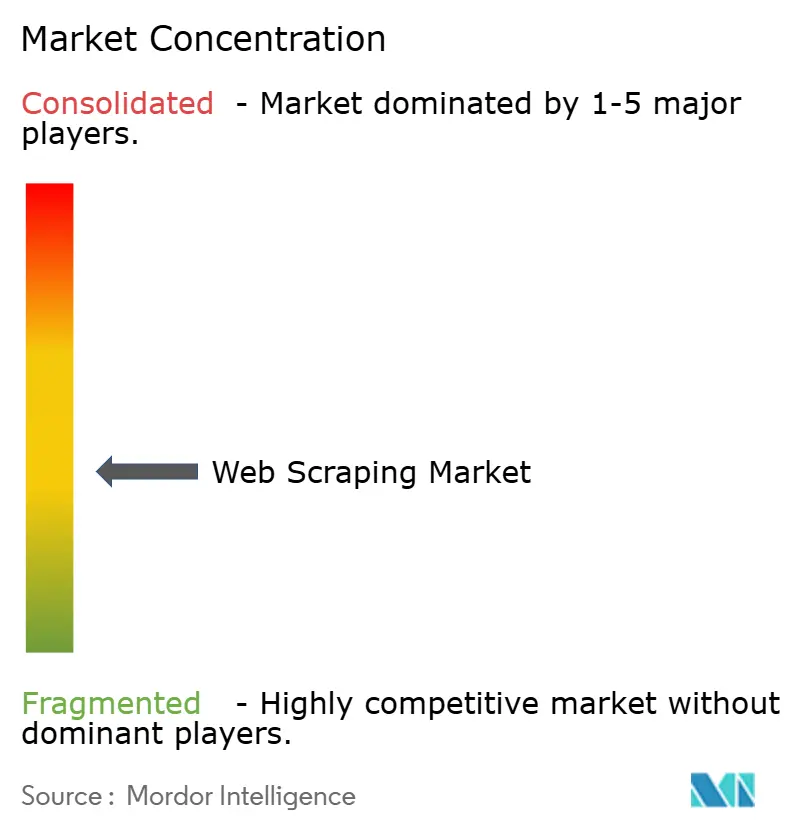
Competition is fragmented across integrated platforms and focused providers, with Bright Data Ltd. offering scraping tools, datasets, and managed services. Zyte Group Ltd. supplies APIs and developer tools, while Apify Technologies s.r.o. offers a cloud platform and professional services. Octopus Data, Inc. supplies Octoparse, and Import.io Ltd., within Neuralogics, combines self-service extraction with managed web-data delivery. Bright Data reported serving 14 of the top 20 large language model (LLM) labs in 2025. Access to LLM-lab buyers creates a distinct commercial foothold within this varied supplier base, alongside competition across overlapping software and service formats.
Import.io joined the Neuralogics group in October 2025, retaining its own name, platform, customers, and teams. The company is investing in AI-native products on top of its extraction engine, placing product development alongside its established extraction offering. Zyte described its Web Scraping Copilot in 2025 as a code-first AI assistant embedded directly in developers' workflows, an approach that keeps engineers in control of their own pipelines. Import.io instead adds AI-native products to the extraction engine its existing customers already use, so both suppliers extend current routines rather than replace them.
Competitive direction is moving toward extraction that AI agents can request inside their own workflows. On September 30, 2026, Zyte introduced a hosted Model Context Protocol (MCP) server that makes Zyte API and Scrapy Cloud available to compatible AI and coding agents. Octoparse's AgentTools API guides agents through template discovery, parameter validation, cloud extraction, and data export, with execution requiring a supported cloud-executable template. Where Brazil's LGPD territorial tests apply, personal-data processing needs an Article 7 legal basis, while German controllers obtaining personal data indirectly must provide GDPR Article 14's specified information, subject to its exceptions. Specialists can compete by making a narrow extraction task executable through the agent interfaces their buyers use.
Web Scraping Industry Leaders
-
Bright Data Ltd.
-
Zyte Group Ltd.
-
Apify Technologies s.r.o.
-
Octopus Data, Inc.
-
Import.io Ltd.
- *Disclaimer: Major Players sorted in no particular order
Web Scraping Market Companies Covered in this Report
- Bright Data Ltd.
- Zyte Group Ltd.
- Apify Technologies s.r.o.
- Octopus Data, Inc.
- Import.io Ltd.
- The Phantom Company SAS (PhantomBuster)
- Diffbot Technologies Corp.
- Mozenda, Inc.
- Sequentum Inc.
- ScrapeHero LLC
- ParseHub Inc.
- UAB Oxylabs
- DataWeave Pvt Ltd
- PromptCloud Technologies Pvt Ltd
- DATAANT Sp. z o.o. (ScrapingAnt)
- DataHen Inc.
- Actowiz Solutions LLC
- SysNucleus Software Pvt Ltd (product: WebHarvy)
- PilotFish Technology LLC
- Datopian Ltd.
- Newprosoft LLC
- UAB Data troops (Decodo)
- Datafiniti LLC
- Crawlbase LLC
- Bright Data Labs Ltd.
Key Opportunities for Market Participants
The opportunity comparison focuses on training-data collection that improves coverage and control under restricted access. Inria characterized new online public training data as increasingly scarce in December 2025, while OECD.AI reported more than 50 copyright and data-protection lawsuits worldwide by 2025. OECD.AI also reported that websites were increasingly using technical and contractual barriers to prevent scraping. Together, scarcity and access restrictions favor collection services that define usable coverage and record source conditions before expanding a corpus.
Market Opportunities Table of Web Scraping Market
| Opportunity | Why now | Buyer / lead segment | Recommended play | Main barrier | Likely beneficiaries |
|---|---|---|---|---|---|
| Vertical-specific training corpora | Scarcity of new public training data | AI and LLM training teams | Define a narrow vertical and curate its source coverage | Establishing dataset fit for the chosen vertical | Specialized data suppliers such as Bright Data Ltd. |
| Incremental corpus collection | Need for new public training material | Model teams expanding existing corpora | Deliver incremental batches with documented source dates | Obtaining genuinely new, usable material | Custom data pipeline providers such as Bright Data Ltd. |
| Training feeds with source records | Legal disputes and collection restrictions | Model developers assessing corpus origins | Attach source, collection time, and usage conditions to each batch | Technical and contractual access barriers | Web-data suppliers such as Bright Data Ltd. |
| Source: Mordor Intelligence | |||||
Bright Data's vertical-specific sourcing and custom-pipeline role provides a commercial starting point for training-data work. Extending that role into incremental feeds or feeds with source records would require explicit delivery requirements and a confirmed basis for collecting each source. The strongest opening is turning a narrowly defined collection into a repeatable supply arrangement whose scope and origin remain clear as the corpus changes.
Recent Industry Developments in Web Scraping Market
- Oct 2026: UAB Oxylabs introduced Web API, combining web search and scraping with AI-powered parsing for structured web data.
- Oct 2026: RateGain Travel Technologies Limited announced that Vietnam Airlines selected AirGain, its airline pricing-intelligence platform, to strengthen rate shopping and competitive pricing.
- Sep 2026: Zyte Group Ltd. introduced Zyte MCP, bringing live web access, structured extraction, and Scrapy Cloud operations into coding agents.
Web Scraping Market Report Scope and Research Methodology
Market Definition and Coverage
The global web scraping market measures annual revenue from commercial software and managed services that programmatically extract public web-page content for paying organizations across industries and use cases. It covers software license and subscription sales and service fees from cloud and on-premise offerings worldwide.
Scope exclusions: Internal do-it-yourself scripts run solely inside an enterprise, standalone proxy or IP-rotation services, and general web analytics or SEO tools that do not programmatically extract public web-page content are excluded.
Segments Covered in This Report
- By Solution
- Software
- Services
- By Deployment Mode
- Cloud
- On-Premise
- By End-user Industry
- BFSI
- Retail and e-Commerce
- Real Estate
- Manufacturing
- Government
- Healthcare
- Advertising and Media
- Others
- By Use Case
- Data Scraping / ETL
- Price and Competitive Monitoring
- Lead Generation and Sales Intel
- Alternative Financial Data
- Sentiment and Social Analytics
- By Geography
- North America
- United States
- Canada
- Mexico
- South America
- Brazil
- Argentina
- Rest of South America
- Europe
- Germany
- United Kingdom
- France
- Italy
- Spain
- Russia
- Rest of Europe
- Asia-Pacific
- China
- Japan
- India
- South Korea
- Australia and New Zealand
- Rest of Asia-Pacific
- Middle East and Africa
- Middle East
- Saudi Arabia
- UAE
- Turkey
- Rest of Middle East
- Africa
- South Africa
- Nigeria
- Kenya
- Rest of Africa
- Middle East
- North America
Data Sources, Market Sizing, and Validation
Desk Research
Desk research draws on sources such as the U.S. Census Bureau's Quarterly Retail E-Commerce Sales for online retail context, Reddit's developer-platform notice for changing public access conditions, the arXiv study of schema-constrained web extraction for technical performance questions, and Apify's State of Web Scraping report for practitioner-reported operating conditions. These sources help frame demand use cases, access conditions, data quality needs, and extraction costs without treating adjacent indicators as market revenue.
Company filings and investor materials help identify vendor revenue models and product boundaries, while public contract awards and reputable technology and business press can clarify whether a transaction covers software, delivered data, or both. Market totals are cross-checked against their stated revenue basis, geography, period, and inclusions. These named sources are illustrative and not exhaustive, and further sources inform collection, validation and clarification.
Primary Interviews and Surveys
The research design uses structured interviews or surveys with web-scraping software vendors, managed extraction providers, and organizational buyers in finance, retail, media, manufacturing, and public-sector use cases across APAC, EMEA, and the Americas. Respondents with product, commercial, delivery, procurement, and data operations responsibilities can clarify revenue boundaries, cloud versus on-premise purchasing, customer use, and changes in extraction workload. Analyst questions test secondary-source interpretations and investigate gaps in vendor revenue, service bundling, geographic allocation, and adoption, and accounts are triangulated across supplier, buyer, and public evidence before assumptions are retained.
Distribution of primary research fieldwork respondents
| Company type | Respondent position | Region |
|---|---|---|
| Top tier: 35% | CXOs: 20% | APAC: 38% |
| Mid tier: 45% | Functional/Unit leaders: 35% | EMEA: 32% |
| Smaller Players: 20% | Managers: 45% | Americas: 30% |
Market-Sizing & Forecasting
The model estimates global annual vendor revenue for commercial web-scraping software and managed extraction services, then allocates that total across solution, deployment, end-user industry, use case, and customer geography. A top-down estimate starts with revenue disclosures and market-level estimates, adjusted to the defined sale of licenses, subscriptions, and extraction services. Selective bottom-up checks compare supplier revenue roll-ups and sampled contract or service pricing times estimated customer volumes, with gaps recorded and reconciled rather than treated as a complete census. Key indicators include vendor revenue and product mix, customer and contract disclosures, cloud versus on-premise adoption, online retail and marketplace activity, and finance or media demand for alternative data. Each informs the overall revenue envelope, segment shares, or forecast drivers. A multivariate regression can relate the annual revenue series to these indicators where consistent history exists, while scenario analysis handles discontinuities such as access restrictions, legal changes, or new automated extraction capabilities. Missing observations use documented interpolation or bounded assumptions. Segment shares are built from reported splits, customer-use evidence, product descriptions, and buyer allocation across industries and applications, with the residual assigned only after supported categories are assessed. Primary experts can check the reasonableness of variable-level growth paths and shifts in solution mix, and unresolved differences between supplier checks and the top-down total are revisited through source and boundary checks.
Data Validation & Update Cycle
Analysts triangulate supplier disclosures, buyer-side evidence, public contracts, and independent market signals, then check totals, shares, growth rates, and historical revisions for anomalies or material variance. A multi-step review confirms source dates and definitions, tests whether outliers reflect real changes or inconsistent boundaries, and resolves issues before sign-off. Re-contact is triggered when a material answer conflicts with published evidence or leaves revenue ownership, bundling, or geography unclear. The dataset is refreshed annually, updated between cycles for material market events, and given a fresh pre-delivery review of sources, calculations, and narrative consistency.
Mordor Intelligence's Web Scraping Market Size Versus Other Published Estimates
Published estimates can differ in the transactions and products they count and the inputs used to model demand. The global web scraping market measures annual revenue from commercial software and managed services that programmatically extract public web-page content for paying organizations across industries and use cases.
Key Gap Drivers include the study's defined coverage and market-specific modeling choices. Key indicators include vendor revenue and product mix, customer and contract disclosures, cloud versus on-premise adoption, online retail and marketplace activity, and finance or media demand for alternative data.
Benchmark comparison
| Source | Market Size | Gaps in Research Methodology |
|---|---|---|
| Mordor Intelligence | USD 1.83 B (2027) | |
| Global Consultancy A | USD 0.99 B (2025) | At its 2025 base, this estimate is 45.9% below this report's 2027 value of USD 1.83 B, 2 years later. Earlier base year places the estimate before subsequent market growth. |
| Global Consultancy B | USD 909.9 M (2024) | At its 2024 base, this estimate is 50.3% below this report's 2027 value of USD 1.83 B, 3 years later. Software-only coverage excludes managed extraction services, and its base year precedes subsequent market growth. |
Mordor Intelligence's analysts triangulate supplier disclosures, buyer-side evidence, public contracts, and independent market signals, then check totals, shares, growth rates, and historical revisions for anomalies or material variance.
Key Questions Answered in the Report
What is the web scraping market size and forecast growth?
The size is estimated at USD 1.83 billion in 2027 and projected to reach USD 4.03 billion by 2032, at a CAGR of 17.08% during 2027-2032.
What drives demand for web-scraping software and services?
U.S. online retail expansion and AI-assisted spider development support demand. In a 2025 survey of 56 buy-side firms in the United States, United Kingdom, and Europe, 63% planned higher alternative-data spending.
Which solution leads revenue from commercial web scraping?
Software accounted for 57.93% of revenue in 2026, while services are projected to grow at a CAGR of 18.35% during 2027-2032.
Which companies are major providers of web-scraping software and services?
Major providers include Bright Data Ltd., Zyte Group Ltd., Apify Technologies s.r.o., Octopus Data, Inc., and Import.io Ltd., which operates within Neuralogics.
What challenges shape the outlook for commercial web scraping?
In a December 2025 survey, 88.7% of respondents reported higher costs when targeting anti-bot-protected websites. For scraping practitioners, that cost pressure can constrain protected-site coverage and refresh frequency.
Which region leads the commercial web-scraping industry, and where is growth fastest?
North America held 33.94% of revenue in 2026, while Asia-Pacific is forecast to grow fastest at a CAGR of 18.35% during 2027-2032.