Digital Remittance Market Size and Share
Market Overview
| Study Period | 2020 - 2031 |
|---|---|
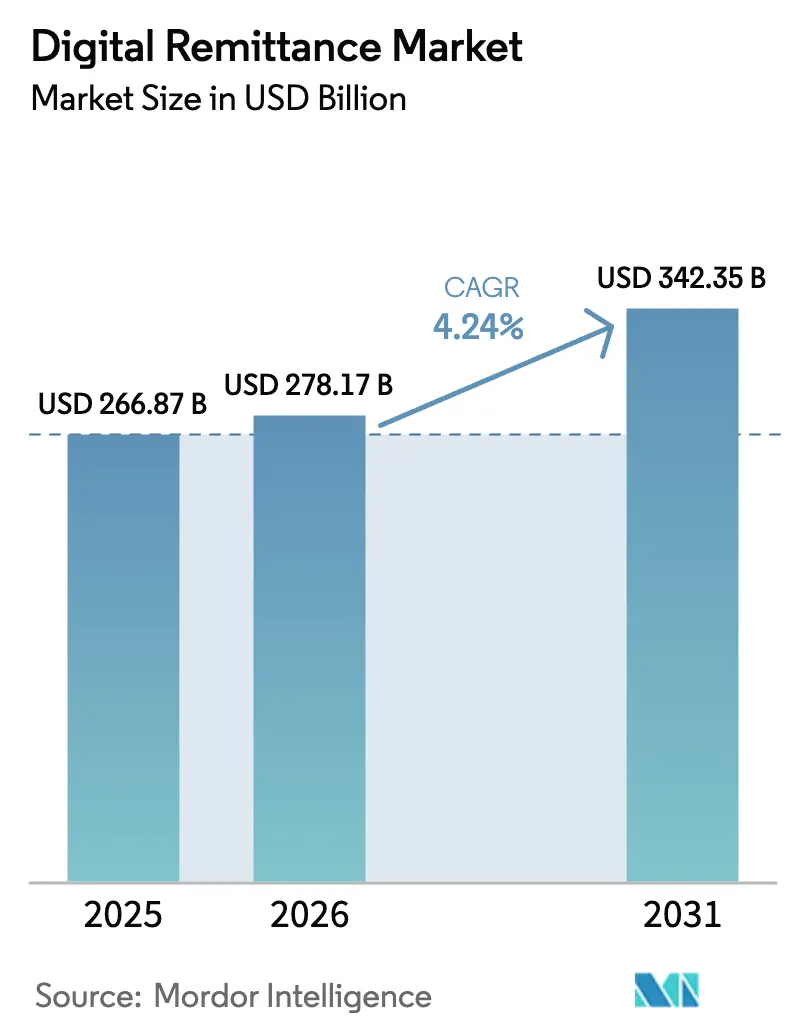
| Market Size (2026) | USD 278.17 Billion |
| Market Size (2031) | USD 342.35 Billion |
| Growth Rate (2026 - 2031) | 4.24% CAGR |
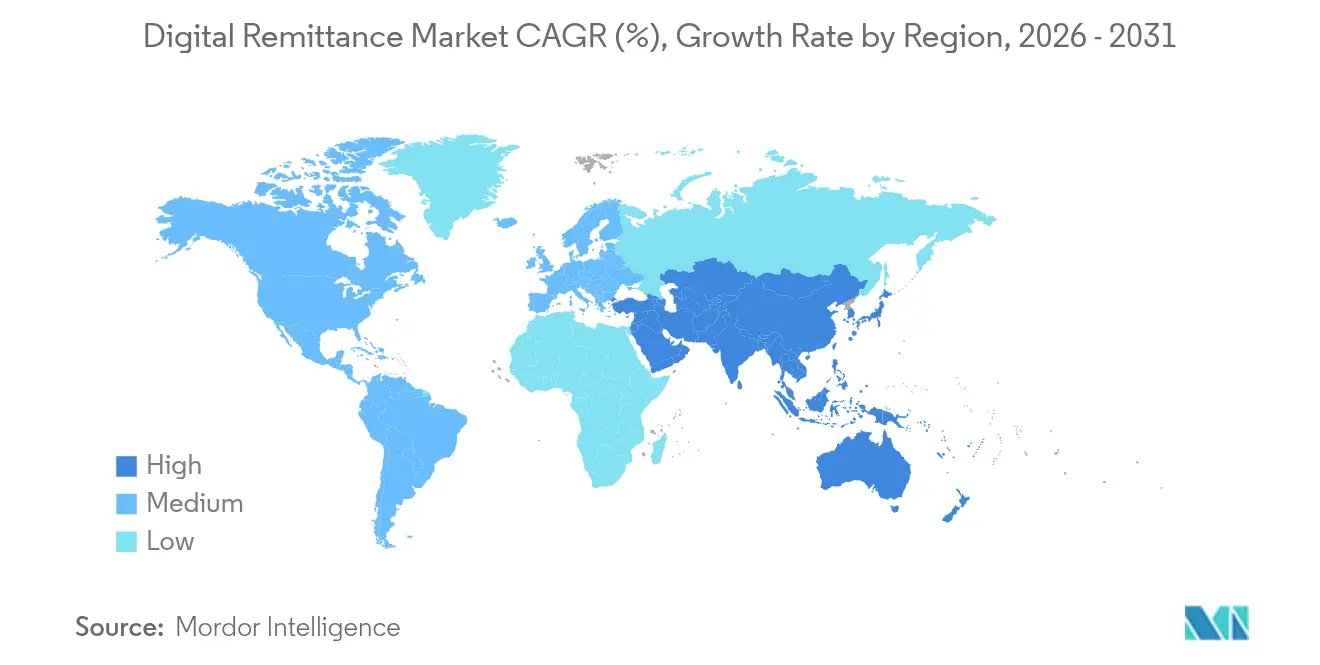
| Fastest Growing Market | Middle East and Africa |
| Largest Market | Asia Pacific |
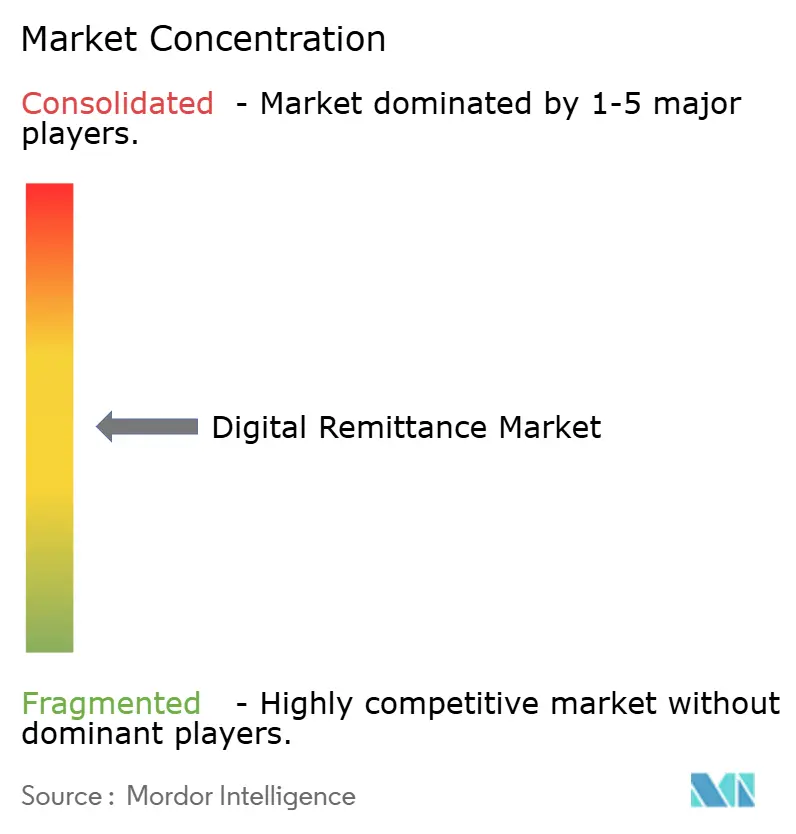
| Market Concentration | Medium |
Major Players *Disclaimer: Major Players sorted in no particular order Image © Mordor Intelligence. Reuse requires attribution under CC BY 4.0. | |
Digital Remittance Market Analysis by Mordor Intelligence
The Digital Remittance Market size is projected to expand from USD 266.87 billion in 2025 and USD 278.17 billion in 2026 to USD 342.35 billion by 2031, registering a CAGR of 4.24% between 2026 to 2031.
This steady expansion sits on deep structural shifts: 1.35 billion mobile money accounts now move more than USD 2 million per minute, catalyzing a transition from correspondent banking to blockchain-enabled corridors and embedded finance platforms[1]GSMA, “State of the Industry Report on Mobile Money 2024,” gsma.com. Rapid smartphone uptake, government cash-lite agendas, and cost pressure on money transfer operators (MTOs) are compressing the time-to-settle from days to seconds while pulling fees downward. Asia–Pacific leads with a 35.10% digital remittance market share in 2024, yet the Middle East and Africa post the fastest regional CAGR at 12.40% through 2030, buoyed by Gulf Cooperation Council (GCC) outflows that supply 27% of African remittances. Mobile channels retain a 55.40% share, though crypto gateways are rising at 25.30% CAGR as stablecoins and CBDCs undercut FX spreads. While migrant workers still drive 65.30% of volume, business remittances are climbing 14.76% CAGR on the back of SME digitization and cross-border e-commerce. The 4.49% CAGR captures a tug-of-war between regulatory complexity and technology acceleration; firms that master blockchain compliance and embed rails in super-apps are positioned for outsized gains as rules stabilize.
Key Report Takeaways
- By geography, Asia–Pacific held a 34.85% digital remittance market share in 2025, while the Middle East and Africa region is forecast to expand at a 12.05% CAGR to 2031.
- By channel, mobile apps led with a 54.85% share in 2025; crypto and blockchain gateways are the fastest-growing at 24.18% CAGR through 2031.
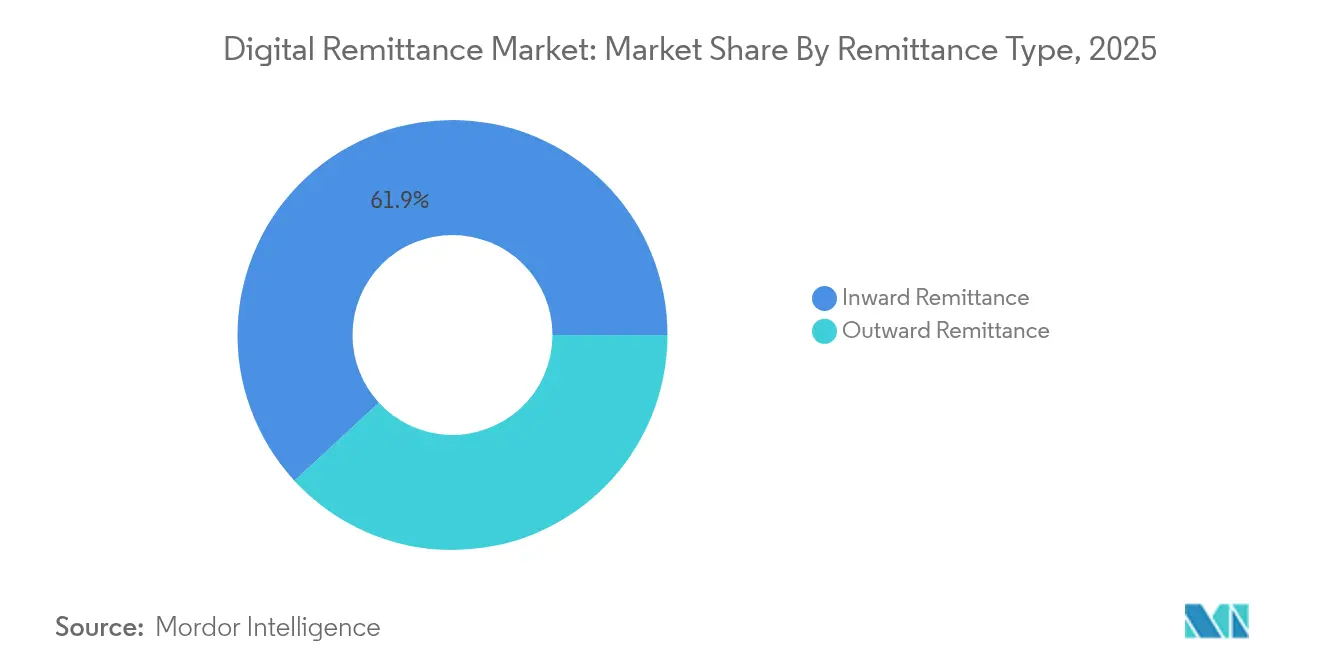
- By remittance type, inward flows accounted for 61.85% of the digital remittance market size in 2025, whereas outward flows are projected to rise at 16.53% CAGR between 2026-2031.
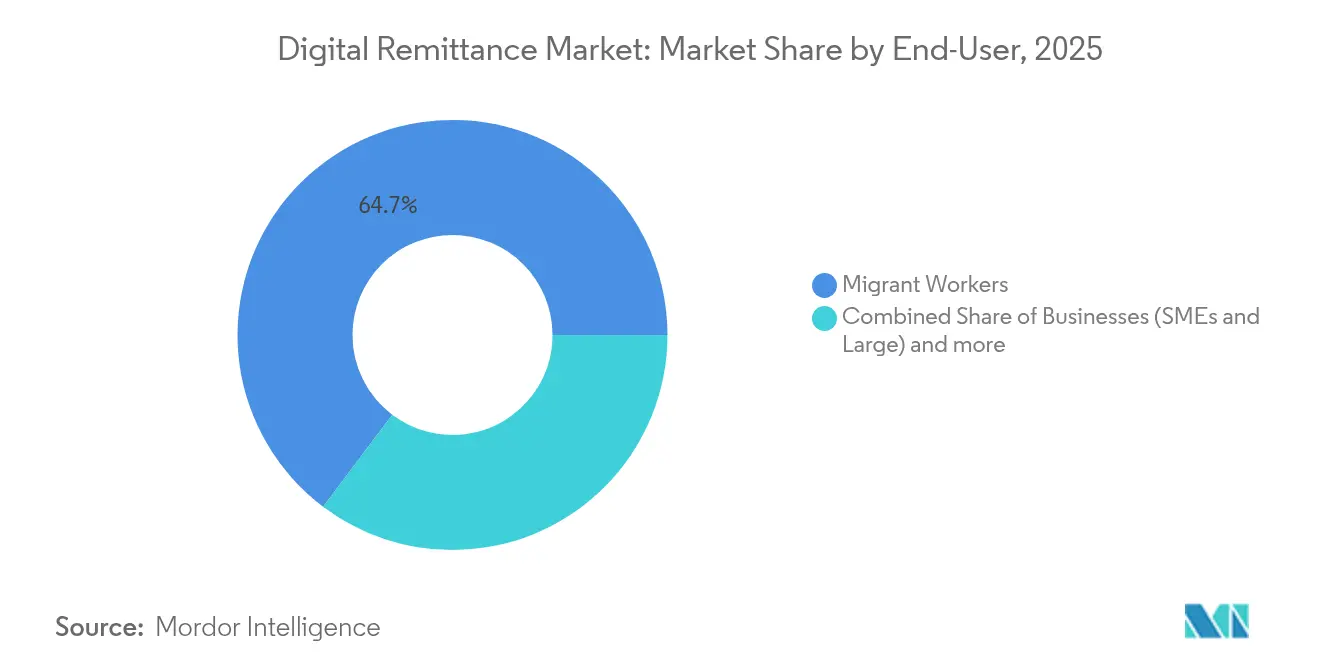
- By end-user, migrant workers generated 64.72% of volume in 2025; business users record the highest projected CAGR at 14.25% to 2031.
- By provider type, money transfer operators held 46.35% share in 2025, yet crypto gateways exhibit the strongest growth at 24.18% CAGR.
Note: Market size and forecast figures in this report are generated using Mordor Intelligence’s proprietary estimation framework, updated with the latest available data and insights as of 2026.
Global Digital Remittance Market Trends and Insights
Rising Smartphone Penetration and Mobile-First Payment Behaviour
Global mobile money adoption now exceeds 1.35 billion registered accounts, with half a billion monthly active users sending more than USD 2 million every minute. These users leapfrog branch-based banking, enabling account-to-account transfers that settle in seconds. Sub-Saharan Africa hosts over 1.1 billion of those accounts, proving that a handset and network coverage can substitute for costly bricks-and-mortar channels. As smartphone prices fall and data access widens, providers that deliver intuitive in-app journeys gain a decisive edge over agent-centric incumbents. The upshot is a durable lift to the digital remittance market as mobile behaviour becomes the default for both senders and receivers.
Growing Global Migrant Workforce and Cross-Border Transaction Volumes
Remittance inflows to low- and middle-income economies reached USD 656 billion in 2024, surpassing foreign direct investment and official development assistance combined worldbank. Remittances account for up to 40% of GDP in nations such as Tajikistan, providing critical household income buffers[3]UNDP, “Remittances a Key Social and Economic Driver,” undp.org. Younger, digitally native migrants adopt app-based transfers at a higher clip, pressuring cash-out fees and stimulating corridor innovation. Emerging economies including the UAE and China have evolved from pure recipient status to major originators, diversifying flows and creating new South-South lanes that digital players can serve at lower cost. Economies of scale from surging volumes make flat-fee models sustainable, further broadening adoption.
Cost Pressure on Traditional MTOs Accelerating Digital Shift
Average digital transfer fees hover near 5%, versus 7% for non-digital methods. Incumbents such as Western Union acknowledged the squeeze by purchasing the Dash mobile wallet to double digital revenue by 2025. MoneyGram installed new leadership to hasten platform upgrades. Meanwhile, blockchain networks demonstrate that once infrastructure is amortized, marginal costs collapse to near zero. Ripple-enabled corridors already settle cross-border transfers in seconds, bypassing multiple correspondent banks. The stark cost gap forces MTOs to digitize, partner, or concede share to fintech entrants.
Government-Led Financial-Inclusion and Cash-Lite Initiatives
India’s USD 180 million incentive plan for BHIM-UPI transactions helped push monthly UPI volumes above 12 billion, and the rail is now live in France, Mauritius, and Sri Lanka. Ghana’s Cash-Lite Roadmap aims to raise financial inclusion to 85% by 2025. Ethiopia’s Digital Ethiopia 2025 program drove digital transaction value to USD 82 billion in four years. Such policies expand networks, boost user literacy, and reduce cash dependence—each a tailwind for the digital remittance market. Malaysia’s Financial Inclusion Framework explicitly promotes e-remittance for SMEs and migrants, showing how targeted rules can unlock niche growth.
Multi-Jurisdictional Compliance and KYC/AML Complexity
Regulators are tightening anti-money-laundering (AML) expectations and extending oversight to virtual assets. The Financial Action Task Force’s 2025 standards mandate clearer beneficial-ownership tracking, forcing providers to invest heavily in screening systems and multi-currency monitoring. Smaller fintechs can see compliance bills reach 20% of revenue, tilting the field toward scale players. Fragmented rulebooks also delay product launches, especially for blockchain-enabled corridors where guidance still evolves. While programmable compliance offers a long-term fix, near-term friction slows corridor rollout and tempers digital remittance market expansion.
Escalating Cyber-Fraud and Scam Sophistication
Fraudsters exploit social engineering, malware, and AI-driven spoofing to intercept credentials and reroute funds. Distributed-denial-of-service (DDoS) attacks on payment APIs doubled in frequency during 2024, prompting providers to spend heavily on layered defenses. Comprehensive real-time fraud analytics can cost more than USD 10 million to deploy and maintain ibm. The cross-border nature of remittances complicates redress, as perpetrators hop across jurisdictions with uneven legal cooperation. Users hit by losses may revert to cash, underscoring why robust security is now a core competitive differentiator rather than a back-office function.
Segment Analysis
By Remittance Type: Outward Flows Challenge Traditional Patterns
Inward transfers still commanded 61.85% of the digital remittance market size in 2025, anchored by long-standing migration corridors that route earnings to home countries. Yet outward transfers are rising quickly, delivering a 16.53% CAGR that mirrors economic ascent in historically recipient economies. GCC nations exemplify the pivot: expatriates remitting to South Asia and Africa generate sizeable outbound corridors, while rising wages in China fuel transfers tied to trade and investment. Blockchain corridors appeal in these lanes because correspondent bank ties are thin, and near-instant settlement eliminates pre-funded nostro accounts. As more emerging markets export capital, outward flows will dilute the dominance of inward transfers and diversify revenue across providers.
Growth in outward transfers also changes pricing tactics. Providers can bundle FX hedging or installment features to court SMEs that pay overseas suppliers. Product innovation, combined with regulatory liberalization in countries such as Nigeria and Indonesia, erodes legacy caps on remittance amounts, further accelerating volume. The link between migration, diaspora entrepreneurship, and bilateral trade underpins a feedback loop that reinforces the outward boom and boosts overall digital remittance market turnover.


By Channel: Crypto Gateways Disrupt Mobile Dominance
Mobile apps held a 54.85% share in 2025, benefitting from ubiquitous smartphones and intuitive user journeys. Web portals serve higher-ticket corporate users, and USSD codes keep basic phones connected. Crypto gateways, however, outpace every other channel with a 24.18% CAGR as stablecoins slash conversion costs and real-time blockchains trim settlement to seconds. Countries such as the Philippines now receive dollar-backed stablecoins that recipients convert to local wallets without passing through multiple banks, spotlighting how channel innovation rewires cost structures.
Providers increasingly adopt an omnichannel stance, letting customers scan QR codes, send a stablecoin, or complete a card pull—all in the same app. This flexibility boosts retention and widens addressable segments. As central-bank digital currencies mature, integration layers that bridge CBDCs with private rails will become pivotal. Players unable to orchestrate multiple rails risk being pigeonholed, while orchestrators can price aggressively and grow the digital remittance market beyond traditional consumer transfers.
By End-User: Business Remittances Accelerate Commercial Adoption
Migrant workers generated 64.72% of 2025 volumes, sending predictable, lower-value tickets that anchor provider liquidity models. Business users, though smaller today, exhibit a brisk 14.25% CAGR as SMEs plug digital corridors into procurement, payroll, and marketplace payouts.
Digital platforms reduce reconciliation friction via instant confirmations and automated invoice matching. Embedded finance lets an e-commerce seller book inventory, import it, and pay the supplier without leaving the order-management screen. These efficiencies deepen wallet stickiness, lift average transaction values, and draw enterprise-grade revenues into the digital remittance industry. As compliance APIs mature, risk-scored onboarding will cut KYC timelines from weeks to hours, further catalyzing business uptake.
By Provider Type: Crypto Gateways Challenge Traditional Hierarchies
Money transfer operators still own 46.35% share, but their moat is eroding as agent-led networks give way to app-based flows. Banks retain high-value corridors, yet fee caps and real-time domestic systems expose them to price pressure. Fintech specialists such as Wise and Remitly scale through transparent fees and viral referral loops, compressing margins industry-wide. Crypto gateways, though nascent, clock a 24.18% CAGR as regulators draft clearer rules for stablecoins and tokenized deposits.
Hybrid strategies are emerging. Western Union integrates blockchain rails while leveraging its brand and compliance muscle. Nium’s tie-up with Partior demonstrates how liquidity pools on distributed ledgers can reach bank clients without displacing existing accounts. Success will hinge on striking the right balance among cost, coverage, and compliance. Providers that harmonize those elements will capture outsized slices of the digital remittance market.
Geography Analysis
Asia–Pacific dominates the landscape with 34.85% digital remittance market share, propelled by India’s USD 129 billion annual inflows and the world-class UPI rail that now handles more than 12 billion monthly transactions. Subscribers across Indonesia, Vietnam, and the Philippines show high willingness to switch providers for better rates, forcing continuous innovation. Project Nexus, linking five central-bank instant-payment systems, promises real-time cross-border settlement and could further expand regional corridors. The digital remittance market size for Asia–Pacific is set to accelerate as these integrations compress fees and settlement windows.
North America remains a major source region, especially for Latin American corridors. Mexico relies on remittances for macro stability, crossing USD 65 billion in inflows in 2024. The FedNow service launched in 2024 lays the groundwork for faster domestic interbank transfers that can ultimately plug into cross-border hubs. Canada’s fintech approvals are rising, as seen with Navro’s money-service registration, signaling more choice in Canada-to-Asia corridors.
The Middle East and Africa register the fastest growth at 12.05% CAGR through 2031. GCC countries, hosting millions of expatriates, generate 27% of remittances to Africa and fuel corridors such as Saudi Arabia-to-Kenya that top USD 3 billion annually. Sub-Saharan Africa’s 1.1 billion mobile money accounts provide a ready payout lattice. Somalia’s nationwide instant-payment switch, launched in 2024, underlines how even fragile states can leapfrog legacy rails and extend reach into rural cash-dominant zones. As regional payment links mature, the digital remittance market size for Africa is expected to rise swiftly, rewarding players who localize interfaces and price points.

Competitive Landscape
Competition is intensifying across three strategic archetypes. First, incumbents such as Western Union and MoneyGram leverage decades-old brands and agent footprints while acquiring digital wallets or forming blockchain partnerships to modernize. Second, pure-play fintechs—Wise, Remitly, WorldRemit—scale via transparent fee structures, localized apps, and referral programs that slash acquisition costs. Third, blockchain-native networks like Ripple, Stellar, and XDC offer near-zero marginal costs, courting both banks and fintechs that require instant settlement.
Strategically, incumbents are pursuing mergers and API partnerships to retain corridor relevance. Western Union’s Dash wallet buyout broadens its consumer funnel, whereas MoneyGram’s leadership refresh prioritizes platform investments and bank integrations. Pure-plays are diversifying beyond person-to-person flows into B2B disbursements and card-issuing, seeking stickier revenue. Blockchain networks focus on enterprise pilots that demonstrate compliance-ready settlement; Nium and Partior’s Singapore initiative exemplifies co-creation between fintech liquidity hubs and regulated banks. Patent activity underscores the technological race, with HUMBL receiving U.S. approvals for tokenized settlement methods that could boost security and efficiency.
Success factors are converging on three pillars: compliant access to low-cost liquidity, omnichannel customer experiences, and the agility to localize features. Players that lock in two of these pillars can mount sustainable defenses; those lacking all three may become acquisition targets as the digital remittance market consolidates.
Digital Remittance Industry Leaders
The Western Union Company
PayPal Holdings, Inc.
Wise plc
MoneyGram International, Inc.
Remitly Global, Inc.
- *Disclaimer: Major Players sorted in no particular order

Recent Industry Developments
- June 2025: Thunes expanded its direct network into Denmark, Norway, and Sweden, widening reach in Nordic corridors and enhancing European settlement options.
- May 2025: TerraPay partnered with Wave to bolster cross-border remittances in West Africa, aiming to deepen financial inclusion across francophone markets.
- May 2025: XDC Network collaborated with Bitso Business to power United States–to-Mexico transfers using blockchain for lower costs and faster settlement.
- April 2025: Spin by Oxxo forged a strategic alliance with Félix Pago to enable WhatsApp-based remittances from the United States to Latin America, targeting Mexico’s USD 65 billion corridor.


Research Methodology Framework and Report Scope
Market Definitions and Key Coverage
According to Mordor Intelligence, the digital remittance market captures every cross-border person-to-person and person-to-business transfer that is originated, processed, and settled through fully online or mobile channels, including app-based wallets, API-enabled money-transfer operators, and bank-hosted digital portals. Values reflect the total face value of funds sent plus disclosed transaction fees.
Scope Exclusion: Pure cash-to-cash counter services without a digital initiation step are left outside this study's boundary.
Segmentation Overview
- By Remittance Type
- Inward Remittance
- Outward Remittance
- By Channel
- Mobile (App-based)
- Online/Web
- USSD/SMS
- By End-User
- Migrant Workers
- Businesses (SMEs & Large)
- Individuals (Non-migrant family & friends)
- By Provider Type
- Banks and Traditional FIs
- Money Transfer Operators (MTOs)
- FinTech/Neobanks
- Crypto / Blockchain Gateways
- By Geography
- North America
- United States
- Canada
- Mexico
- South America
- Brazil
- Argentina
- Rest of South America
- Europe
- United Kingdom
- Germany
- France
- Italy
- Spain
- Nordics
- Rest of Europe
- Middle East and Africa
- GCC
- Israel
- South Africa
- Rest of Middle East and Africa
- Asia-Pacific
- China
- India
- Japan
- South Korea
- ASEAN
- Australia
- New Zealand
- Rest of Asia-Pacific
- North America
Detailed Research Methodology and Data Validation
Primary Research
To ground these findings, Mordor analysts run structured interviews with fintech executives, migrant-worker collectives, and compliance officers across Asia-Pacific, North America, the Gulf, and Sub-Saharan Africa. Short surveys with frequent senders help us validate average ticket sizes, preferred channels, and elasticity to fee changes, filling gaps that published data cannot cover.
Desk Research
Our analysts first map the universe of digital corridors using publicly available inputs from sources such as the World Bank Remittance Prices Worldwide database, IMF Balance of Payments, UN DESA migration stock tables, and regional payment association dashboards. We also review central-bank payment statistics, listed operator 10-Ks, and credible press releases. When corridor-level granularity is missing, D&B Hoovers and Dow Jones Factiva help us approximate revenue splits and user counts. A broader scan of patent abstracts via Questel highlights emerging blockchain rails that could alter fee trajectories. The sources cited here are illustrative; numerous additional datasets and documents feed our desk analysis.
Market-Sizing & Forecasting
A top-down reconstruction begins with IMF outward-remittance outflows, which are then filtered by each country's digital penetration rate, smartphone adoption, and KYC-enabled account ratio. Supplier roll-ups of leading platforms and sampled average send value multiplied by monthly active users act as a selective bottom-up cross-check before final calibration. Key variables, including diaspora growth, mobile-money wallet circulation, average transfer fee compression, regulatory sandbox uptake, and corridor-specific FX spreads, drive yearly adjustments. A multivariate regression with ARIMA overlays projects 2026-2030 values, while scenario analysis buffers for abrupt policy shifts such as caps on crypto gateways.
Data Validation & Update Cycle
Outputs pass variance checks against independent indicators like SWIFT cross-border volume and central-bank retail payments. An anomaly review with senior analysts precedes sign-off. Reports refresh every twelve months, and interim reruns are triggered by material events, for example, fee-cap legislation or sanctions.
Why Mordor's Digital Remittance Baseline Commands Reliability
Published estimates diverge because firms pick different inclusion rules, fee treatments, and update cadences.
Key gap drivers include the exclusion of business-to-person flows by some publishers, varied treatment of platform fee revenue, and inconsistent currency conversions. Mordor's disciplined scope, dual-track modeling, and annual refresh reduce such disparities.
Benchmark comparison
| Market Size | Anonymized source | Primary gap driver |
|---|---|---|
| USD 266.87 B (2025) | Mordor Intelligence | |
| USD 24.48 B (2024) | Global Consultancy A | Narrow scope; omits low-value corridors and platform fee component |
| USD 188.68 B (2025) | Industry Association B | Relies on reported operator revenue, not face value of transfers; limited primary validation |
The comparison shows that when scope breadth, fee treatment, and timely validation are aligned, Mordor's balanced approach offers decision-makers a dependable, transparent baseline they can trace back to clear variables and repeatable steps.


Key Questions Answered in the Report
What is the current value of the digital remittance market?
The digital remittance market stands at USD 278.17 billion in 2026 and is forecast to reach USD 342.35 billion by 2031.
Which region leads the digital remittance market?
Asia–Pacific leads with 34.85% market share, aided by India’s large inflows and mature instant-payment rails.
What channel is growing fastest?
Crypto and blockchain gateways are expanding at 24.18% CAGR as stablecoins and tokenized deposits cut FX spreads.
How fast are business remittances growing?
Business-focused transfers are rising at 14.25% CAGR as SMEs digitize cross-border trade and adopt embedded finance.
What is the main restraint on growth?
Complex, multi-jurisdictional compliance requirements trim 1.1 percentage points from forecast CAGR by raising operating costs.
Are traditional MTOs losing ground?
Money transfer operators still hold 46.35% share, but cost pressure and digital disruption are pushing them to invest in blockchain partnerships and mobile apps to stay competitive.
Page last updated on:


