
Market Overview
| Study Period | 2020 - 2031 |
|---|---|
| Market Size (2026) | USD 566.52 Billion |
| Market Size (2031) | USD 985.03 Billion |
| Growth Rate (2026 - 2031) | 11.68 % |
| Fastest Growing Market | Asia Pacific |
| Largest Market | North America |
| Market Concentration | Medium |
Major Players *Disclaimer: Major Players sorted in no particular order Image © Mordor Intelligence. Reuse requires attribution under CC BY 4.0. | |
Digital Lending Market Analysis by Mordor Intelligence
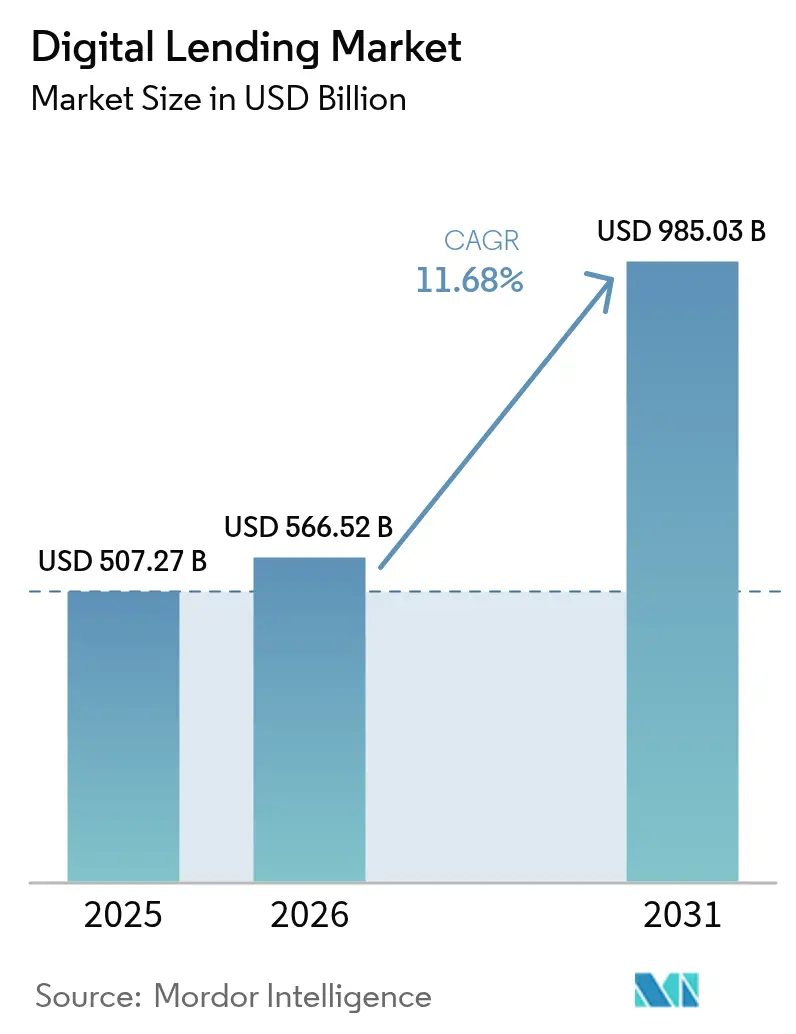
The digital lending market size was valued at USD 507.27 billion in 2025 and estimated to grow from USD 566.52 billion in 2026 to reach USD 985.03 billion by 2031, at a CAGR of 11.68% during the forecast period (2026-2031). This growth profile underscores steady gains in technology-mediated credit origination, rising embedded-finance volumes, and wider institutional acceptance of AI underwriting. Real-time credit decisioning, open-banking data transfers, and buy-now-pay-later (BNPL) options continue to draw borrowers away from branch channels. Institutions are investing in cloud-native loan-origination systems that trim processing costs and shrink disbursement times from weeks to minutes. New revenue opportunities have emerged around thin-file customers and cross-border small-business funding, aided by alternative-data credit scoring. Competitive intensity is strengthening as fintechs, traditional banks, and BigTech platforms converge on identical customer segments in every major region.
Key Report Takeaways
- By type, consumer lending led with 60.78% of the digital lending market share in 2025, while enterprise and SME lending are advancing at a 16.08% CAGR through 2031.
- By deployment mode, cloud platforms commanded 68.62% of the digital lending market size in 2025, and hybrid architectures are expanding at a 14.55% CAGR.
- By business model, BNPL and other embedded-finance structures captured 33.58% revenue share in 2025; the same segment is projected to grow at a 19.52% CAGR to 2031.
- By geography, Asia-Pacific accounted for 39.35% of the digital lending market size in 2025, whereas Africa is on track for the fastest 21.85% CAGR through 2031.
- By technology, AI-driven underwriting processes controlled 43.62% of the digital lending market in 2025 and boosted approval rates by 25% without raising risk.
Note: Market size and forecast figures in this report are generated using Mordor Intelligence’s proprietary estimation framework, updated with the latest available data and insights as of 2026.
Market Trends and Insights
Drivers Impact Analysis of Digital Lending Market*
| Driver | (~) % Impact on CAGR Forecast | Geographic Relevance | Impact Timeline |
|---|---|---|---|
| Smartphone and internet penetration | +2.8% | Asia-Pacific, Africa | Medium term (2-4 years) |
| Fintech instant-approval platforms | +2.1% | North America, Europe | Short term (≤2 years) |
| Open-banking and e-KYC regulations | +1.9% | Europe, Asia-Pacific, Latin America | Medium term (2-4 years) |
| MSME demand for rapid working-capital loans | +1.7% | Global | Short term (≤2 years) |
| Alternative-data credit scoring | +1.5% | Underbanked regions | Long term (≥4 years) |
| Rise of embedded-finance lending | +1.4% | Asia-Pacific, North America | Medium term (2-4 years) |
| Source: Mordor Intelligence | |||
Surge in smartphone and internet penetration accelerates mobile-first lending
Global smartphone users totaled 6.8 billion in 2024, giving lenders a direct path to borrowers through mobile apps. In Asia-Pacific alone, digital-wallet payments hit USD 9.8 trillion, reinforcing customer readiness for in-app credit offers[2]Deloitte, “Beyond Payments: Digitalization Trends in the Cross-Border Checkout Revolution,” deloitte.com. Lenders now harness geolocation, device metadata, and behavioural signals to evaluate risk in seconds, opening credit lines to millions of first-time borrowers. Regulators such as India’s Data Protection Board and the EU’s AI Act are standardizing data use, which helps lenders scale compliant mobile-first models.
Proliferation of fintech instant-approval platforms transforms borrower expectations
More than 90% of digital loan applications are now routed through automated underwriting engines, and Upstart reports 80% instant approvals without document uploads. Machine-learning models digest hundreds of borrower attributes in real time, cutting origination costs and elevating customer satisfaction. Banks unable to match sub-five-minute approval windows increasingly choose white-label partnerships with fintech vendors to preserve market share.
Favorable open-banking and e-KYC regulations enable data-driven underwriting
European PSD3 rules and similar mandates across Asia require banks to expose customer account data through secure APIs, furnishing lenders with verified income, cash-flow, and liability feeds[3]Platformable, “EU Open-Banking Regulation Triumvirate in 2024,” platformable.com. Digital identity rails, such as India’s e-KYC interface, shorten onboarding to under 60 seconds, while Experian’s Cashflow Score demonstrates a 25% uplift in predictive power versus legacy bureau scores.
MSME demand for rapid working-capital loans drives B2B adoption
Small businesses face a USD 5.7 trillion global funding gap. Digital lenders plug this deficit with revenue-based finance and invoice-factoring products underwritten on real-time sales data. Platforms such as Novo and Bitty Advance disburse capital in 24 hours, supporting supply-chain continuity for merchants in Latin America, Southeast Asia, and the United States.
Restraints Impact Analysis of Digital Lending Market*
| Restraint | (~) % Impact on CAGR Forecast | Geographic Relevance | Impact Timeline |
|---|---|---|---|
| Cyber-security and data-privacy risks | –1.8% | North America, Europe | Short term (≤2 years) |
| Regulatory interest-rate caps | –1.2% | Emerging markets | Medium term (2-4 years) |
| Investor fatigue in peer-to-peer markets | –0.9% | Europe, North America | Short term (≤2 years) |
| Cloud-provider concentration risk | –0.7% | Europe, Asia-Pacific | Long term (≥4 years) |
| Source: Mordor Intelligence | |||
Cyber-security and data-privacy risks challenge platform scalability
Financial institutions allocate just 13% of IT budgets to security even as API footprints widen. In 2024, 62% of surveyed lenders registered rising fraud incidents, and regulators now demand zero-trust architectures under GDPR and CCPA regimes. Higher cyber-insurance premiums and mandatory breach notifications inflate compliance costs, particularly for cross-border platforms.
Investor fatigue in peer-to-peer markets curbs capital supply
Historic default spikes at several European P2P venues have pushed average arrears to 6% and triggered the bankruptcy of once-high-profile platforms. Risk-averse retail investors have responded by redirecting funds to insured deposits, forcing marketplace lenders to hike yields or court institutional buyers. Resulting funding volatility restricts loan inventory and slows platform expansion.
*Our forecasts treat driver/restraint impacts as directional, not additive. The impact forecasts reflect baseline growth, mix effects, and variable interactions.
Digital Lending Market Segment Analysis
By Type:
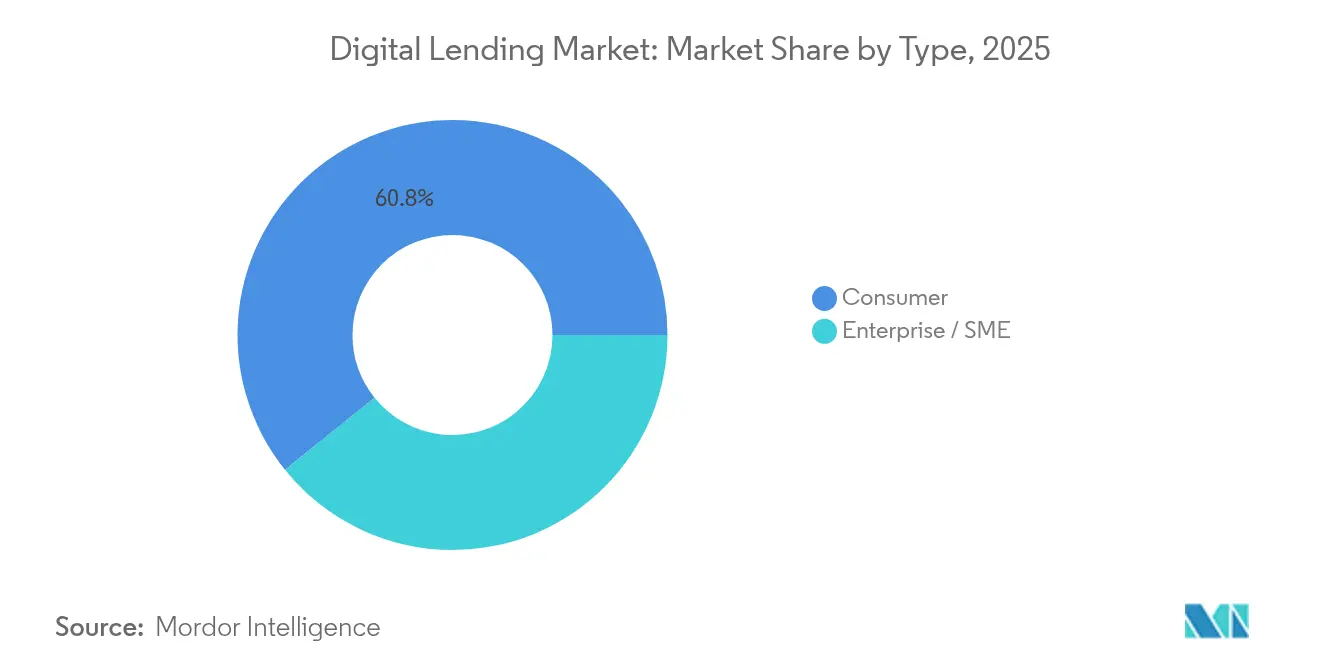
Consumer lending holds scale while SME credit posts faster gainsConsumer loans retained 60.78% of the digital lending market in 2025, propelled by personal finance and BNPL demand. At the same time, SME facilities are forecast to grow at a 16.08% CAGR to 2031, reflecting working-capital shortages and adoption of alternative-data models that reward real-time cash-flow visibility. The digital lending market size for SME products is projected to reach USD 246.09 billion by 2031. Lenders integrate APIs with accounting software to harvest invoices, payroll, and tax data, reducing underwriting cycles from weeks to 48 hours. As localized platforms achieve credit-loss rates on par with consumer portfolios, global banks are entering revenue-sharing partnerships to secure distribution.
In the consumer arena, embedded credit offers inside e-commerce checkouts continue to extend reach into lower-income cohorts. A growing share of salaried millennials now use pay-period data to unlock salary-advance options. Advanced explainable-AI models mitigate bias, pointing to downward pressure on charge-offs across large peer cohorts. Together, these forces preserve a solid base for consumer-loan volumes while opening an even faster-growing SME lane.



By Loan Type:
Personal loans dominate; working-capital loans log the fastest CAGRPersonal loans represented 35.44% of the digital lending market size in 2025, fueled by instant-decision models and low acquisition costs. Auto loans follow, leveraging point-of-sale integrations that cut dealership desk time to under 60 seconds [UPSTART.COM]. Mortgage, home-equity, and student-loan categories are undergoing slower digital migration due to complex collateral checks and subsidy rules.
Working-capital loans to small businesses are projected to register a 10.52% CAGR. Revenue-based financing aligns repayments with daily card receipts, offering merchants flexibility during demand fluctuations. Invoice-factoring platforms that anchor inside enterprise-resource-planning dashboards unlock liquidity within 24 hours of invoice issuance. This embedded-finance route attracts global logistics, agriculture, and freelancer ecosystems that historically lacked collateral for traditional lines of credit.
By Deployment Mode:
Cloud leads; hybrid structures close the gapCloud installations controlled 68.62% of 2025 revenues after banks pivoted toward containerized, API-first lending stacks. A sizable subset of tier-1 institutions still mandate on-premise storage for sensitive data. Hybrid deployments, therefore, are advancing at a 14.55% CAGR as banks segment workloads, keeping personally identifiable information behind firewalls while leveraging public clouds for compute-intensive AI model training.
Vendor lock-in risk has pushed regulators to examine systemic concentration. Europe’s EBA and the Bank of England encourage multi-cloud strategies that sustain operational continuity. Lenders respond by diversifying across hyperscalers and incorporating Kubernetes portability layers. Such architecture supports real-time credit decisions on mobile devices even in bandwidth-constrained markets, broadening customer reach.
By Business Model:
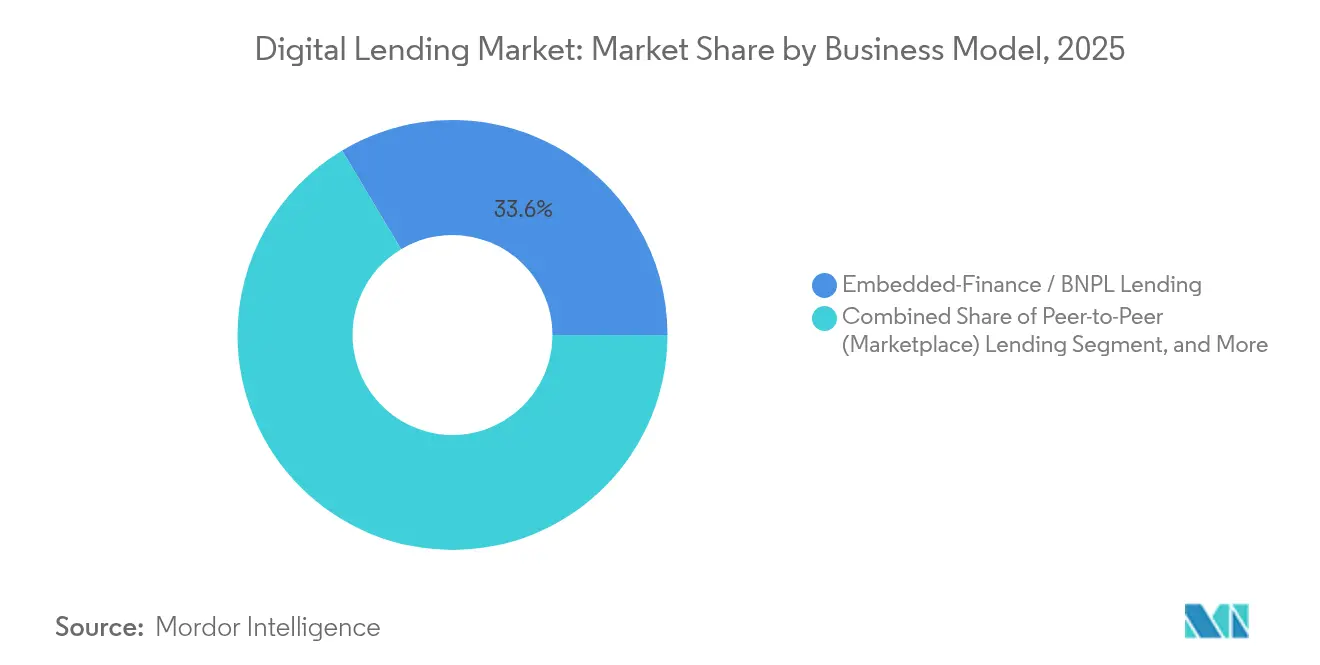
Embedded finance redefines loan distributionBNPL and embedded-finance agreements captured 33.58% of 2025 revenue and are expected to expand at almost 19.52% annually. Non-bank merchants integrate credit buttons inside checkout flows via Banking-as-a-Service rails, lifting ticket sizes and customer retention. Peer-to-peer platforms retain a loyal investor niche but confront funding volatility, whereas balance-sheet fintech lenders obtain warehouse lines from banks to scale originations without dilution.
Embedded-finance penetration into B2B channels is the next frontier, with logistics and procurement portals embedding supplier-credit lines. Partnerships between card networks and e-commerce software firms accelerate this trend, making credit a default feature rather than an add-on. The digital lending industry increasingly measures success on time-to-yes metrics rather than net-interest spread alone.
By Technology:
AI underwriting tops adoption; blockchain remains exploratoryAI-powered underwriting engines held 43.62% of technology spend in 2025, driving 25% incremental approvals versus traditional scorecards. Open-banking APIs ensure continuous data refresh, boosting early-warning signals for credit deterioration. Generative-AI pilots are surfacing in document classification and borrower communication, but account for less than 10% of production workloads.
Blockchain-based smart contracts have gained traction in secured micro-lending but remain below 2% of total loan volume. Banks cite oracle risks and regulatory ambiguity. Big-data analytics, meanwhile, underpin alternative-data models that tap utility payments, social-media footprints, and e-commerce ratings, thereby widening access for underbanked consumers.
Geography Analysis
APAC Digital Lending Market
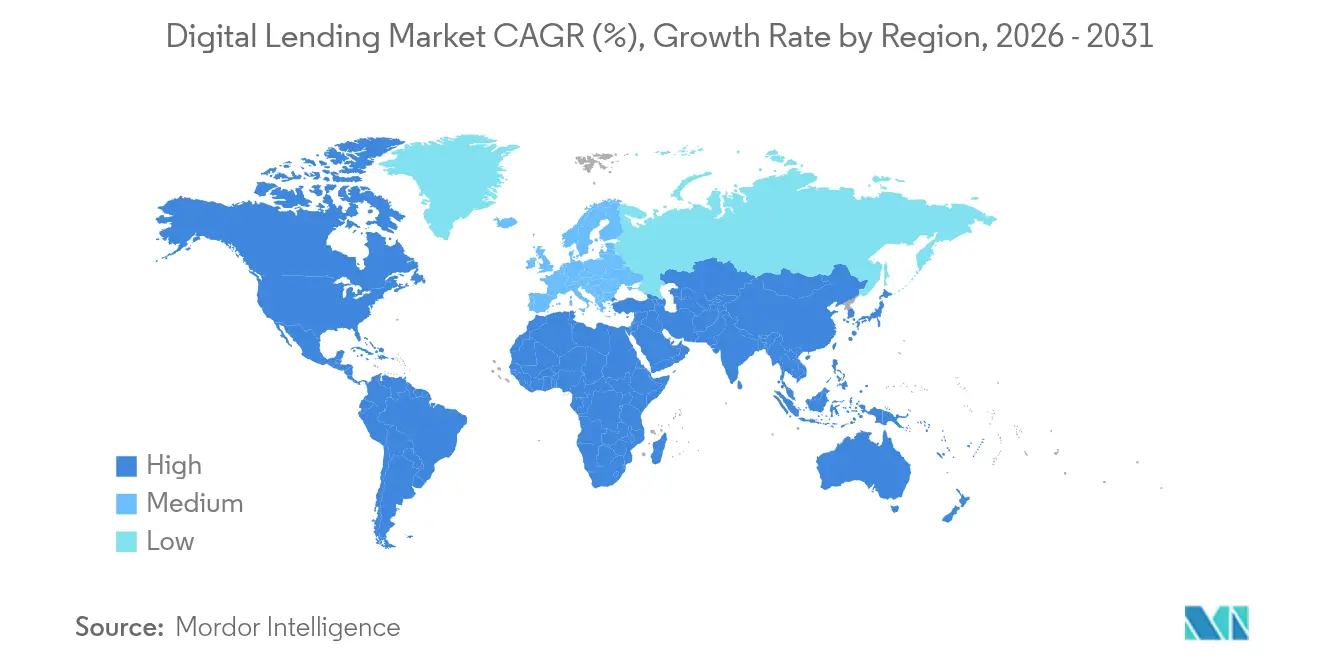
Asia-Pacific accounted for 39.35% of the digital lending market in 2025, supported by more than 235 licensed digital banks and government-backed payment infrastructures such as India’s UPI, which averaged 12 billion monthly transactions in 2025. China’s super-apps layer credit on top of wallets, ride-hailing, and food-delivery services, creating powerful data loops. Governments in Singapore and Australia operate regulatory sandboxes that shorten product-testing cycles to six months, accelerating market entry for challenger lenders.
Africa Digital Lending Market
Africa recorded the fastest 21.85% CAGR and is forecast to reach USD 47 billion in revenues by 2028. Mobile-money rails pioneered in Kenya and Ghana form the backbone of microlending engines that evaluate airtime purchases and peer-to-peer transfers to score risk. Start-ups in Nigeria and Egypt attract international venture funds and develop cross-border payroll-advance solutions for the African diaspora.
North America, Europe and LATAM Digital Lending Market
North America and Europe exhibit high penetration but slower headline growth. U.S. BNPL legislation remains fluid, yet PayPal surpassed USD 30 billion in cumulative originations, demonstrating scale for mature players. In Europe, PSD3 upgrades and the EU AI Act provide unified rules that enhance cross-border passporting, though interest-rate caps in several consumer-credit directives restrain high-yield segments. Latin America sees growing embedded-finance deals anchored on real-time payments such as Brazil’s PIX, creating a runway for double-digit lending growth despite macro volatility.

Regulatory Landscape
Digital lending regulation is converging around consumer data rights, oversight of third-party lending ecosystems, and auditability of automated credit decisions. In the European Union, the EU AI Act (Regulation (EU) 2024/1689) classifies creditworthiness assessment and credit scoring as high-risk AI use cases, with enforceable requirements for financial services from August 2026. This lifts governance expectations around model documentation, monitoring, and human oversight.
In the United States, the Consumer Financial Protection Bureau (CFPB) has continued rulemaking relevant to digital lending, including Regulation B (ECOA) changes and parallel activity affecting open-banking style data access and BNPL treatment under consumer credit rules. In high-growth emerging markets, regulators are tightening licensing, disclosures, and reporting for digital lending apps and lending service providers. The Reserve Bank of India consolidated its framework through the Reserve Bank of India (Digital Lending) Directions 2025, introducing structured requirements for regulated entity and lending service provider (RE-LSP) arrangements and mandating reporting of Digital Lending Apps (DLAs), including DLA data uploads by June 15, 2025, with additional provisions effective from November 1, 2025 for LSPs partnering with multiple regulated entities. Nigeria also brought digital credit further into the regulatory perimeter via the FCCPC Digital, Electronic, Online, or Non-traditional Consumer Lending Guidelines 2025, effective November 18, 2025, reinforcing disclosure and conduct expectations for app-based lending.
Value Chain Analysis
Digital lending value creation starts with customer acquisition and embedded distribution, then moves through onboarding and e-KYC, data aggregation (bank-account, cash-flow, device, and alternative data), automated underwriting and pricing, funding or capital provisioning, and servicing or collections, with compliance and reporting spanning the lifecycle. The market is increasingly organized around modular, API-led architectures where banks, NBFCs, fintech lenders, and third-party Lending Service Providers (LSPs) connect to deliver origination, decisioning, and servicing at scale, while cloud platforms provide elastic compute for real-time decisioning and model training.
Key bottlenecks cluster at handoffs between intake, underwriting, approval, and funding when institutions run disconnected legacy tools that require manual re-entry, slowing time-to-yes and raising operational risk. AI underwriting and the data connectivity layer have become choke points because they determine approval speed, explainability, and fraud controls, while funding rails (warehouse lines, forward-flow, and securitization) constrain scalable origination. Regulatory requirements also shape ecosystem design, for example India’s RBI Digital Lending Directions 2025 strengthens accountability across RE-LSP arrangements and DLA disclosures and reporting (including CIMS portal reporting by June 15, 2025), which increases the need for auditable workflows, standardized data capture, and API-based reporting.
Competitive Landscape
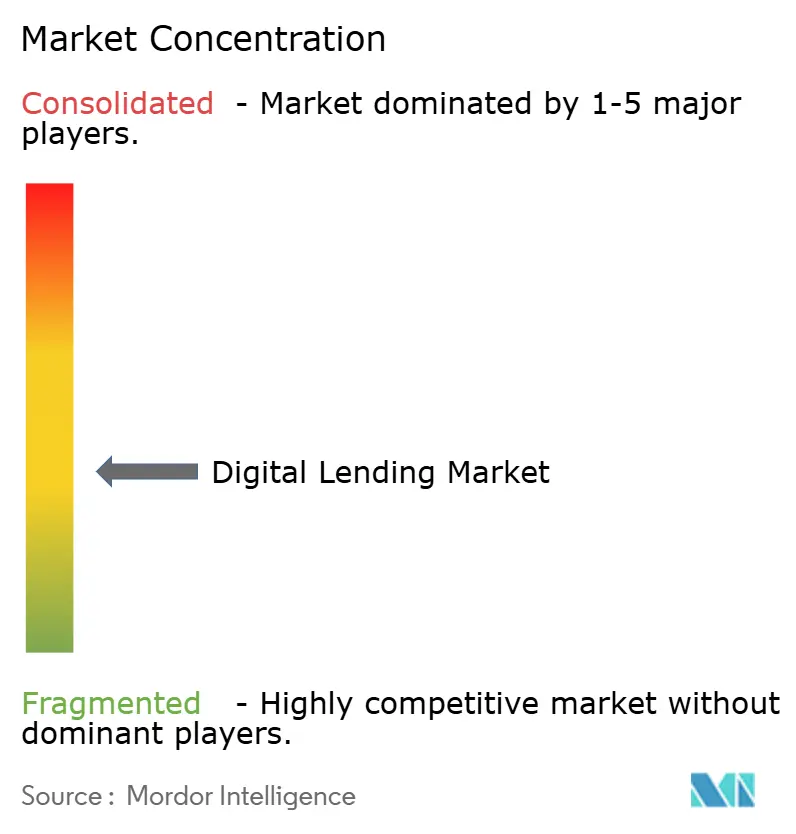
Competition is moderate and fragmented. Established payment brands such as PayPal and Square exploit merchant relationships to onboard borrowers at low acquisition cost. Pure-play digital lenders like Upstart and LendingClub differentiate through proprietary AI models that deliver 90% automated approvals. Challenger banks like Nubank expand from cards into salary-advance products, while traditional institutions migrate legacy portfolios onto cloud loan-origination systems to stay relevant.
Mergers and acquisitions continue. Gen Digital agreed to buy MoneyLion for USD 1 billion, adding 9 million users and analytics assets. Amazon’s takeover of India-based Axio provides an embedded-credit engine for its e-commerce ecosystem. Moody’s acquired Numerated to embed origination technology within its credit-assessment suite, signaling a trend toward end-to-end platforms that marry data, scoring, and workflow.
Technology arms races drive strategy. Vendors focus on explainable AI to meet forthcoming audit mandates. Multi-cloud capability, low-code configuration, and predictive maintenance of loan portfolios are emerging table stakes. The top five originators controlled roughly 28% of 2024 volumes, indicating room for consolidation yet significant entry opportunity for specialized providers.
Digital Lending Industry Leaders
Funding Circle Limited (Funding Circle Holdings PLC)
On Deck Capital Inc.
Prosper Marketplace, Inc.
Bizfi LLC
LendInvest Plc
PayPal Holdings, Inc.
- *Disclaimer: Major Players sorted in no particular order
Digital Lending Market Companies Covered in this Report
- Ant Group Co., Ltd.
- WeBank Co., Ltd.
- PayPal Holdings, Inc.
- Klarna Bank AB (publ)
- LendingClub Corporation
- Upstart Holdings, Inc.
- Funding Circle Holdings plc
- On Deck Capital, Inc.
- Prosper Marketplace, Inc.
- SoFi Technologies, Inc.
- Kabbage, Inc. (American Express Co.)
- LendInvest plc
- Zopa Bank Ltd.
- Kaspi.kz JSC
- Ferratum Oyj
- CAN Capital, Inc.
- International Personal Finance plc
- Faircent Tech Pvt. Ltd.
- LenDenClub Techserve Pvt. Ltd.
- CapFloat Financial Services Pvt. Ltd.
- Oriente Group Limited
- Mercado Libre, Inc.
- Square Loans (Block, Inc.)
- PayU Finance India Pvt. Ltd.
- PagSeguro Digital Ltd.

Market Opportunities and Future Outlook
Whitespace is emerging around agentic-AI and workflow automation that compresses cycle times and tightens compliance controls within digital origination. In March 2026, Blend launched Blend Autopilot to review application data and compliance checks in seconds, and similar platform moves have shifted more decisions into straight-through processing rather than exception-heavy back offices. For lenders and platform vendors, this creates demand for configurable decisioning, adverse-action explanation tooling, and continuous model monitoring as scrutiny of AI-led credit decisions increases.
Embedded and small-business credit also offers room for product and infrastructure expansion, particularly where funding gaps remain large and underwriting depends on real-time cash-flow data. The global small-business funding gap cited in the market context (USD 5.7 trillion) supports demand for revenue-based finance and working-capital products that can be underwritten from payment and accounting data. On the infrastructure side, more institutions are standardizing on cloud and hybrid deployments, with cloud holding 68.62% share in 2025, to support API integrations and elastic compute for underwriting models. Regulatory changes such as the RBI’s Digital Lending Directions 2025 and Nigeria’s FCCPC Consumer Lending Guidelines 2025 raise the bar for disclosure, app registration or reporting, and third-party oversight, creating opportunity for compliance-by-design platforms and embedded regtech capabilities in loan-origination and servicing stacks.
Recent Industry Developments in Digital Lending Market
- July 2026: Prosper Marketplace expanded personal loan repayment terms up to six years (72 months). The change broadens product flexibility for borrowers and can improve conversion in rate-sensitive segments by lowering monthly payments. Longer tenors also increase the importance of lifecycle risk monitoring and collections analytics in platform operations.
- June 2026: Funding Circle completed SBOLT 2026-1, its tenth public securitisation of investor loans, and noted the participation of the British Business Bank in a Funding Circle public securitisation. The transaction reinforces access to scalable, capital-markets-based funding that supports sustained origination capacity. It also indicates ongoing institutionalization of funding structures for digital SME lending platforms.
- December 2024: Gen Digital announced an agreement to acquire MoneyLion for USD 1 billion. The deal expands Gen Digital into consumer finance distribution and data-driven money management capabilities that can be used across digital credit journeys. It also highlights continued consolidation as platforms seek end-to-end engagement, underwriting insights, and cross-sell pathways.


Digital Lending Market Report Scope and Research Methodology
Market Definition and Coverage
For this study, the digital lending market is defined as the value of loan origination and disbursement that is enabled through digital channels and workflows, including borrower onboarding, credit decisioning, documentation, and servicing done online or through apps.
Scope exclusions: We exclude traditional branch-only lending activity that is not initiated or processed through a digital journey, and we also exclude pure software-only revenues that do not represent lending volume.
Segments Covered in This Report
- By Type
- Consumer
- Enterprise / SME
- By Loan Type
- Personal Loans
- Auto Loans
- Student Loans
- Mortgage / Home Equity
- Small Business Working-Capital Loans
- By Deployment Mode
- Cloud-based Platforms
- On-premise Solutions
- Hybrid
- By Business Model
- Peer-to-Peer (Marketplace) Lending
- Balance-Sheet (Direct) Lending
- Embedded-Finance / BNPL Lending
- Crowdfunding and Revenue-Based Financing
- By Technology
- AI / Machine-Learning–driven Underwriting
- API and Open-Banking Platforms
- Blockchain-based Lending
- Big-Data Analytics
- By Geography
- North America
- United States
- Canada
- Mexico
- Europe
- Germany
- United Kingdom
- France
- Russia
- Rest of Europe
- Asia-Pacific
- China
- Japan
- India
- South Korea
- Australia
- Rest of Asia-Pacific
- Middle East and Africa
- Middle East
- Saudi Arabia
- United Arab Emirates
- Rest of Middle East
- Africa
- South Africa
- Egypt
- Rest of Africa
- Middle East
- South America
- Brazil
- Argentina
- Rest of South America
- North America
Data Sources, Market Sizing, and Validation
Desk Research
Desk research was used to set the base structure of the model and to make sure our definitions align with how lending is tracked in public statistics. We relied on non-paywalled sources such as the World Bank, IMF, BIS, and OECD for macro and credit trend indicators, and on central bank and financial regulator publications in key countries for banking credit, consumer credit, and supervisory notes.
We also reviewed sources such as SEC filings and annual reports of listed lenders and financial platforms, investor presentations, central bank payment and digital finance updates, and reputable financial press to understand how digital origination is expanding inside total lending. For cross-checks on activity in specific corridors, we used an import-export shipment-level database only where it helps validate device and infrastructure demand signals linked to digital finance rollout. These examples are not exhaustive, and many other public sources were used to collect data, validate inputs, and clarify assumptions.
Primary Interviews and Surveys
Primary work focused on validating the share of lending being originated digitally, how underwriting and approval rates are changing, and how unit economics are evolving across borrower types. We spoke with a mix of lenders, fintech platforms, risk and compliance specialists, and channel partners across major regions, so assumptions on adoption, pricing, and credit quality could be stress tested.
When public datasets did not show digital splits clearly, expert inputs were used to set realistic penetration ranges and to sense-check the direction of change before finalizing the model.
Distribution of primary research fieldwork respondents
| Company type | Respondent position | Region |
|---|---|---|
| Top tier: 30% | CXOs: 17% | APAC: 46% |
| Mid tier: 49% | Functional/Unit leaders: 23% | EMEA: 34% |
| Smaller Players: 21% | Managers: 60% | Americas: 20% |
Market-Sizing & Forecasting
Sizing starts from a demand pool reconstruction, where overall credit origination and outstanding lending activity by geography is translated into digitally originated volumes using penetration rates derived from public signals and interview validation. We then corroborate the total with selective bottom-up approximations, such as sampled lender throughput checks, average loan ticket size patterns, and product mix splits by borrower type, which are adjusted when the two views do not align.
Key inputs used in the model include digital origination penetration by loan category, approval and pull-through rates, average ticket size by borrower cohort, delinquency and charge-off trend direction, policy and compliance shifts affecting onboarding, and smartphone and internet penetration as a practical adoption proxy. Forecasting relied mainly on scenario analysis, since adoption and credit cycles can shift quickly, and the scenarios were anchored to expert views on rate cycles, funding availability, and risk appetite. When bottom-up signals were missing for smaller geographies, we filled gaps using peer-market analogs with similar banking depth and digital usage, followed by conservative caps to avoid overstating growth.
Data Validation & Update Cycle
Model outputs are checked against independent signals, including credit growth trends, lending product mix disclosures, and reported digital channel traction, and then variances are reviewed in a second analyst pass before sign-off. Outliers are investigated by re-checking input series, currency conversions, and any step changes in regulation or reporting definitions, and re-contact is triggered when a key assumption moves beyond an expected band.
Reports are refreshed annually, and interim updates are done when material events occur, such as major regulatory changes, sharp rate moves, or disruptions in funding markets. Before delivery, an analyst runs a fresh review so clients receive an updated view that matches the latest available data and validation notes.
Mordor Intelligence's Digital Lending Market Size Measured Against Other Published Estimates
Published estimates for digital lending often differ because firms mix up what they are measuring, some track loan origination value while others track platform or software revenues, and the year used for currency and inflation can also shift totals. We keep the logic transparent so a reader can trace each step back to clear demand indicators and interview-backed adoption ranges.
The biggest gap drivers usually come from whether mortgages and other secured lending are included, whether figures represent disbursements versus outstanding balances, and whether penetration rates are applied consistently across regions without checks on credit mix and approval behavior. When the scope is limited to platform revenues or to a narrow set of lending products, the number will look much smaller, which is the pattern seen in a few widely cited figures, a scope choice handled differently by Mordor Intelligence.
Benchmark comparison
| Source | Market Size | Gaps in Research Methodology |
|---|---|---|
| Mordor Intelligence | USD 566.52 B (2026) | |
| Global Consultancy A | USD 450.00 B (2023) | Often presented as a single-year valuation tied to broad digital finance adoption, with limited clarity on whether it measures origination value, outstanding credit, or only select loan categories, which can compress totals versus an origination-led model. |
| Trade Journal B | USD 15.26 B (2024) | This figure typically tracks digitization and workflow solutions around lending rather than the value of loans originated digitally, and it may apply a technology spend lens that excludes the underlying lending volume. |
The table shows that the spread is mainly explained by what is counted as the market unit, which is either loan value flowing through digital channels or spending on enabling technology. By keeping the definition tied to origination and cross-checking penetration and ticket size assumptions with interviews, we end up with a practical estimate that can be repeated and updated with clear inputs.


Key Questions Answered in the Report
How large is the digital lending market in 2026?
The digital lending market stood at USD 566.52 billion in 2026 and is on track for USD 985.03 billion by 2031.
Which region is the fastest-growing for digital consumer credit?
Africa leads with a projected 21.85% CAGR through 2031 thanks to mobile-money rails and supportive regulatory sandboxes.
What share of digital loans use AI underwriting today?
AI-enabled engines handle roughly 43.62% of loans and have lifted approval rates by 25% without raising portfolio risk.
Why are hybrid cloud deployments becoming more popular among lenders?
A global USD 5.7 trillion working-capital gap fuels demand, while APIs into accounting systems speed underwriting to under 48 hours.
How is embedded finance reshaping credit distribution?
BNPL and embedded-finance products embed loan offers directly inside purchase journeys, already holding 33.58% revenue share and growing near 19.52% annually.
Page last updated on:




