Digital Signatures Market Size and Share
Market Overview
| Study Period | 2020 - 2031 |
|---|---|
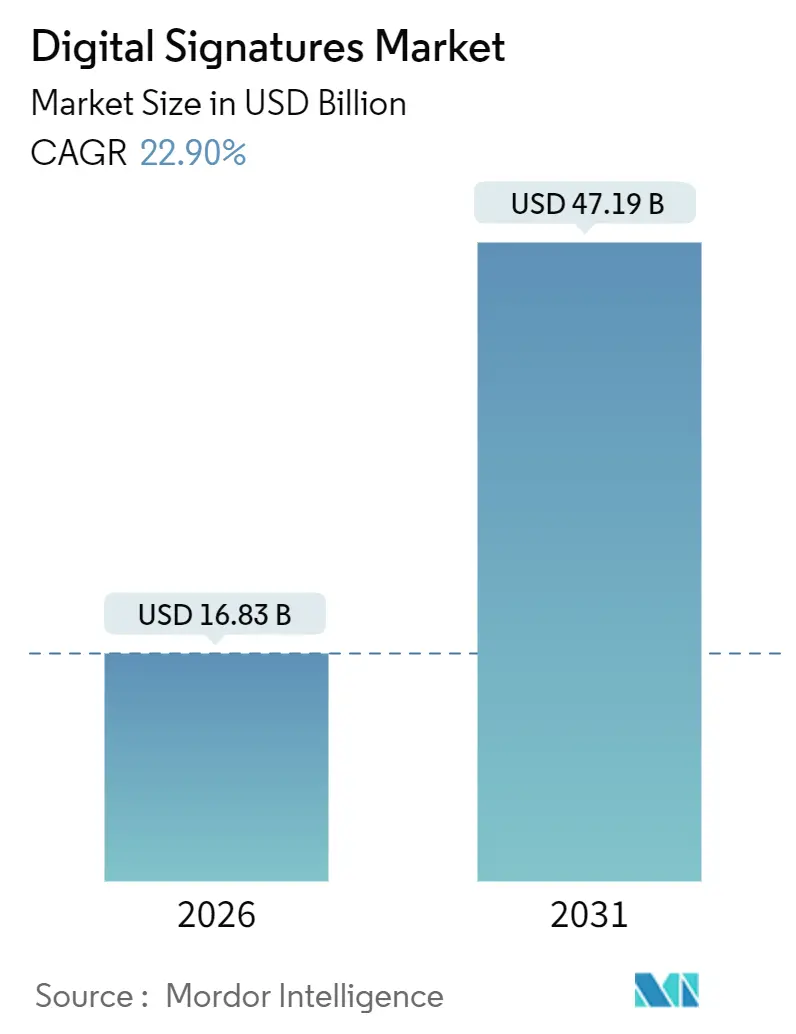
| Market Size (2026) | USD 16.83 Billion |
| Market Size (2031) | USD 47.19 Billion |
| Growth Rate (2026 - 2031) | 22.90% CAGR |
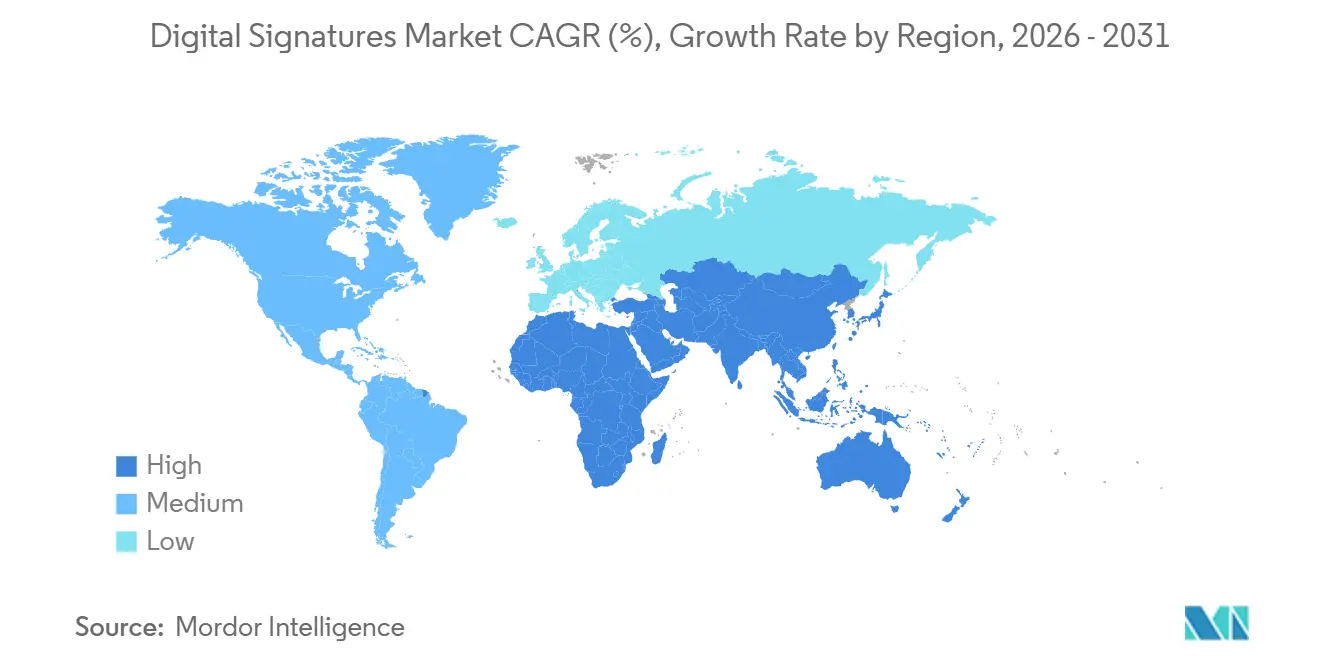
| Fastest Growing Market | Asia Pacific |
| Largest Market | North America |
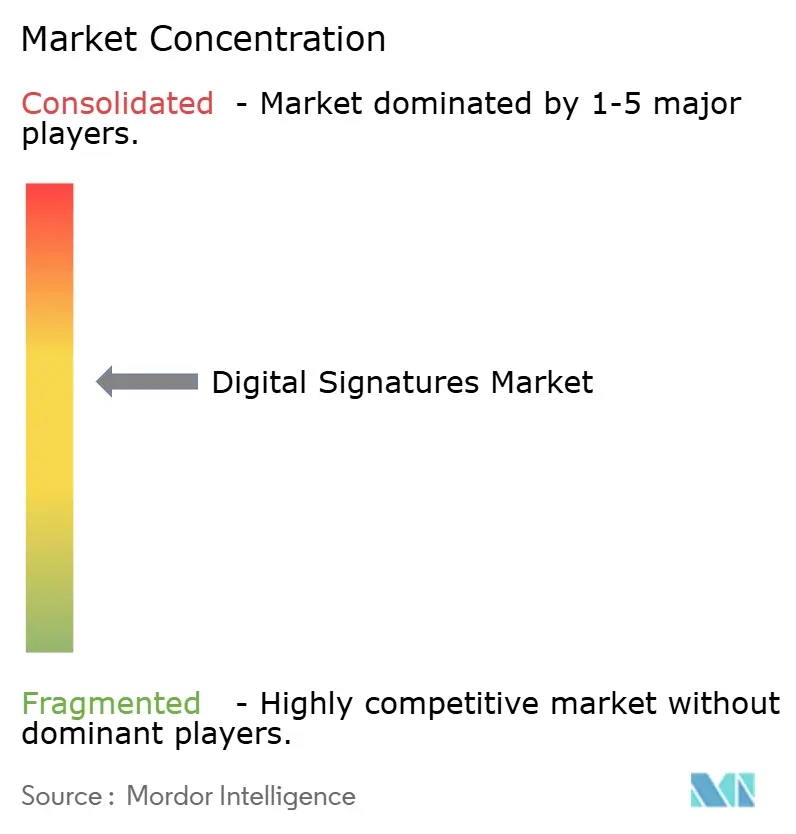
| Market Concentration | Medium |
Major Players *Disclaimer: Major Players sorted in no particular order Image © Mordor Intelligence. Reuse requires attribution under CC BY 4.0. | |
Digital Signatures Market Analysis by Mordor Intelligence
The digital signatures market size is USD 16.83 billion in 2026 and is forecast to reach USD 47.19 billion by 2031, expanding at a 22.90% CAGR during 2026-2031. This rapid expansion reflects enterprises moving from ink to cryptography as governments tighten compliance rules and software vendors bake signing functions into everyday applications, creating seamless user experiences that boost transaction throughput. Demand for cloud-delivered workflows is accelerating because CIOs want API-first platforms that plug directly into Microsoft 365 and Salesforce, while post-quantum cryptography (PQC) timelines are prompting upgrades of certificate stacks and hardware security modules. Price competition is intensifying as productivity-suite vendors bundle signatures at marginal cost, yet specialist providers still win regulated deals that demand high assurance and auditability. ESG programs are also driving adoption, with multinational corporations linking executive pay to reductions in paper usage, reinforcing the trajectory of the digital signatures market.
Key Report Takeaways
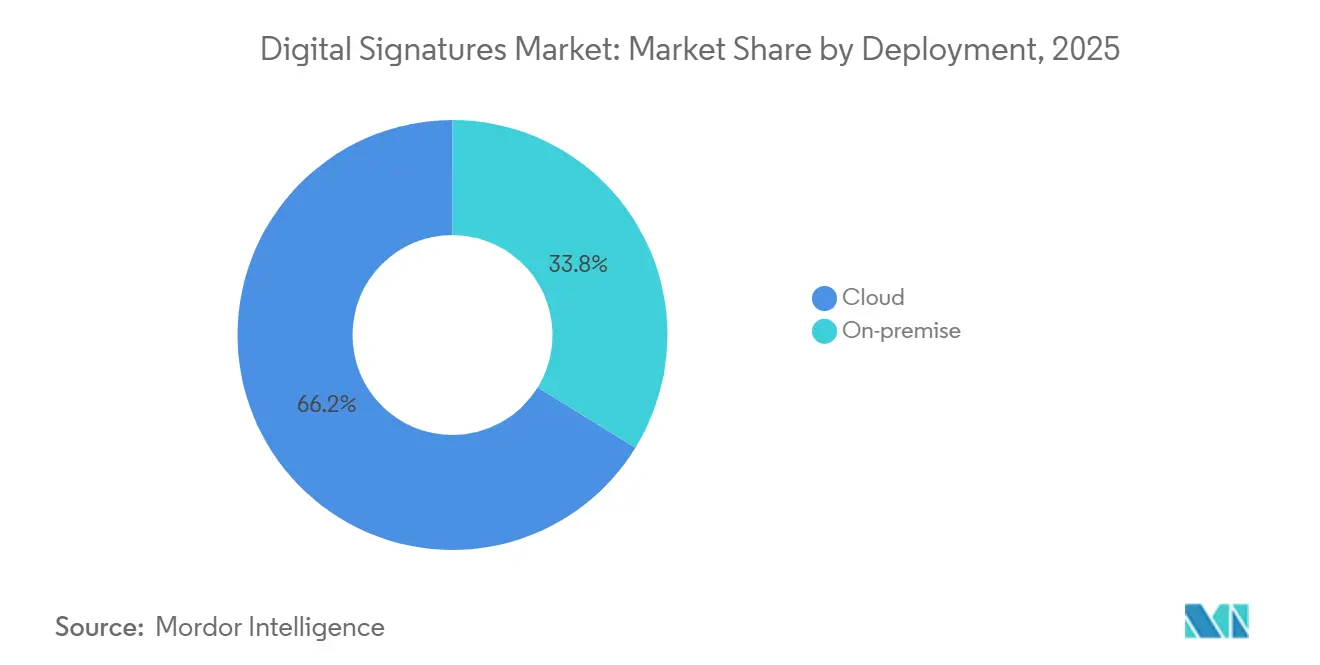
- By deployment, cloud captured 66.22% of the digital signatures market share in 2025, and the segment is projected to advance at a 25.66% CAGR through 2031.
- By offering, software accounted for 78.44% of the digital signatures market size in 2025, while services are the fastest-growing component at a 24.76% CAGR to 2031.
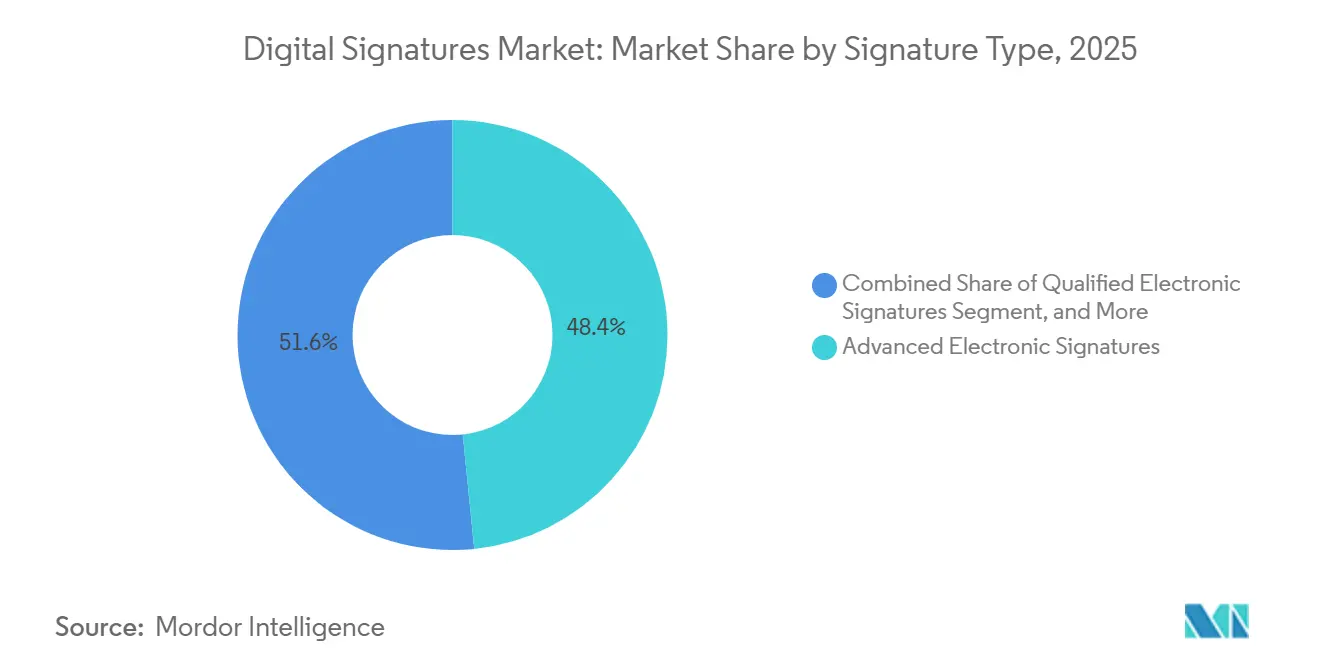
- By signature type, advanced electronic signatures led with 48.38% revenue share in 2025, whereas qualified signatures are on track for a 23.84% CAGR through 2031.
- By end-user industry, banking, financial services, and insurance held 29.76% revenue share in 2025, and healthcare is expected to expand at a 24.12% CAGR to 2031.
- By geography, North America dominated with 40.12% share of the digital signatures market in 2025, but Asia Pacific is the fastest-growing region at a 23.22% CAGR through 2031.
Note: Market size and forecast figures in this report are generated using Mordor Intelligence’s proprietary estimation framework, updated with the latest available data and insights as of January 2026.
Global Digital Signatures Market Trends and Insights
Drivers Impact Analysis*
| Driver | (~) % Impact on CAGR Forecast | Geographic Relevance | Impact Timeline |
|---|---|---|---|
| Accelerated Compliance Mandates for Qualified E-Signatures in EU (eIDAS 2.0) | +5.2% | Europe, with spillover to Middle East and Africa aligning with EU adequacy frameworks | Medium term (2-4 years) |
| Mega-Scale Digitisation Programmes in Asia Pacific Public Sector Workflows | +4.8% | Asia Pacific core (India, Singapore, Australia), expanding to Southeast Asia | Short term (≤ 2 years) |
| Embedded E-Signature APIs in Enterprise SaaS Suites (Microsoft 365, Salesforce) | +4.1% | Global, with highest penetration in North America and Europe | Short term (≤ 2 years) |
| Renewal Cycle Toward Post-Quantum Cryptography Certificate Stacks | +3.3% | Global, led by defense and financial institutions in North America and Europe | Long term (≥ 4 years) |
| ESG-Linked Push for Paperless Transactions and Scope-3 Carbon Reduction | +2.9% | Global, concentrated in North America and Europe with multinational headquarters | Medium term (2-4 years) |
| Digital Signatures Embedded in IoT Device Firmware Updates | +2.7% | Global, with early adoption in automotive hubs (Germany, Japan, United States) | Medium term (2-4 years) |
| Source: Mordor Intelligence | |||


Accelerated Compliance Mandates For Qualified E-Signatures In EU (eIDAS 2.0)
The phased rollout of eIDAS 2.0 is forcing enterprises to adopt qualified electronic signatures that carry the same legal weight as handwritten ink across all EU jurisdictions. Implementing Regulation 2025/1569 spells out cryptographic algorithms and audit requirements, prompting a surge in qualified certificate issuance that climbed 340% year-over-year in H1 2025.[1]European Commission, “Commission Implementing Regulation (EU) 2025/1569,” eur-lex.europa.eu Notaries, land registries, and government procurement portals are aligning on the new specifications, compressing timelines for legacy certificate authorities to modernize or exit. The regulation’s extraterritorial pull is visible in Dubai International Financial Centre, which amended its Electronic Transactions Law to mirror eIDAS requirements, signaling a broader harmonization trend that stimulates the digital signatures market.
Mega-Scale Digitization Programs In Asia Pacific Public-Sector Workflows
India processed 1.2 billion Aadhaar-authenticated signatures in 2024 under its eSign framework, a 68% jump that spilled into banking and vehicle registration use cases.[2]Ministry of Electronics and Information Technology, “eSign Annual Report 2024-25,” meity.gov.in Singapore’s Sign with Singpass had reached 95% adoption across agencies by mid-2025, cutting approval cycles for public housing from five days to less than two hours. Australia’s Digital Identity system, live since November 2024, is projected to save AUD 11.4 billion (USD 7.6 billion) over 10 years. These programs establish national trust infrastructures that private firms can tap, accelerating network effects and raising the floor for the digital signatures market.
Embedded E-Signature APIs In Enterprise SaaS Suites
Microsoft added native signing to Word, Outlook, and SharePoint in October 2024, capturing 18% of the North American mid-market within nine months. Salesforce reports that 63% of new Sales Cloud tenants activate pre-built signature connectors inside 30 days, trimming implementation from 12 weeks to five. Standalone vendors face price compression as customers treat signatures as a checkbox feature bundled into existing subscriptions. However, API volumes are surging. Adobe logged a 110% jump in API-originated signature requests in 2025, cementing cloud as the default delivery model for the digital signatures market.
Renewal Cycle Toward Post-Quantum Cryptography Certificate Stacks
NIST finalized PQC standards FIPS 204 and FIPS 205 in August 2024, starting a global migration to lattice- and hash-based algorithms. The National Security Agency requires national security systems to complete the shift by 2030, and enterprises are dual-signing with RSA-2048 plus ML-DSA to remain future proof. DigiCert launched hybrid certificates in January 2025, while Thales plans to embed ML-DSA in Luna HSMs by Q4 2025. The capex burden is sizable. Thales estimates 40% of installed HSMs need replacement, yet vendors able to automate algorithm agility gain a competitive edge, lifting long-run growth for the digital signatures market.
Restraints Impact Analysis*
| Restraint | (~) % Impact on CAGR Forecast | Geographic Relevance | Impact Timeline |
|---|---|---|---|
| Country-Specific Data-Localisation Rules Hindering Cross-Border Validity | -3.1% | Asia Pacific (China, India, Vietnam), Russia, Brazil | Medium term (2-4 years) |
| Fragmented Global Trust-Service Accreditation Regimes | -2.4% | Global, with highest friction between EU, United States, and Asia Pacific | Long term (≥ 4 years) |
| UX Gaps for Biometric Signatures on Low-Bandwidth Mobile Networks | -1.8% | Africa, South Asia, rural Latin America | Short term (≤ 2 years) |
| High Cost of HSM-Backed Qualified Signatures for SMBs | -1.6% | Global, concentrated in Europe where eIDAS 2.0 mandates qualified signatures | Medium term (2-4 years) |
| Source: Mordor Intelligence | |||
Country-Specific Data-Localization Rules Hindering Cross-Border Validity
China’s 2024 Cybersecurity Law revision forces all signature keys and logs to stay onshore, blocking multinational clouds from offering unified services across Asia Pacific.[3]Cyberspace Administration of China, “Regulations on Cryptographic Key Management for Cloud Services,” cac.gov.cn India mandates domestic certificates for any document addressed to government entities, fragmenting workflows for firms signing both public and private contracts. Brazil’s LGPD raises uncertainty around whether keys constitute sensitive data, pushing firms to host separate signature stacks for subsidiaries. These overlapping rules inflate compliance costs and slow adoption among mid-market firms, moderating the global CAGR of the digital signatures market.
Fragmented Global Trust-Service Accreditation Regimes
European qualified trust service lists do not automatically honor WebTrust-audited U.S. certificate authorities, forcing parallel audits that can exceed USD 300,000 per market. The CA/Browser Forum’s tighter domain checks, updated in March 2025, clash with some national ID schemes, requiring vendors to maintain region-specific certificate profiles. Cross-border transactions like bills of lading still stall when one party’s certificate is not recognized in the destination port, adding legal risk and slowing full digitization of international trade. Until mutual recognition progresses, this restraint weighs on long-range expansion of the digital signatures market.
*Our forecasts treat driver/restraint impacts as directional, not additive. The impact forecasts reflect baseline growth, mix effects, and variable interactions.
Segment Analysis
By Deployment: Cloud Architectures Dominate Infrastructure Choices
Cloud deployments accounted for 66.22% of the digital signatures market share in 2025, and the segment is projected to grow at a 25.66% CAGR to 2031 as firms favor multi-tenant platforms that keep per-signature costs below USD 0.10. Microsoft’s decision to include signatures at no extra charge for Microsoft 365 E5 subscribers accelerated migration and reduced vendor sprawl. The digital signatures market size attributable to cloud workflows is expanding fastest in regulated industries that now accept ISO/IEC 27001-certified outsourcing.
While on-premise remains important for air-gapped defense networks, hybrid models are emerging. Hospitals hold patient keys on-site yet route vendor contracts through cloud-based orchestrators, compressing turnaround from days to hours. Edge deployments, where IoT gateways validate firmware signatures offline, are gaining traction among offshore energy operators. These nuanced patterns underscore why the digital signatures market retains diversity even as cloud dominates overall growth.

By Offering: Services Surge As Implementation Complexity Rises
Software still captured 78.44% of the 2025 digital signatures market size, but services are expanding at a 24.76% CAGR as firms confront legacy integrations. Managed PKI, compliance consulting, and user-training bundles address gaps that pure software cannot. OneSpan’s professional-services revenue jumped 32% year-over-year, reflecting this pivot.
Hardware spends remain steady because qualified signatures require tamper-resistant modules, yet commoditized USB tokens serve advanced-signature workflows at sub-USD 20 price points. Training and change-management programs reduce help-desk load for qualified signature rollouts, supporting outcome-based engagement models. As enterprises demand turnkey solutions rather than licenses, the services segment will outpace software in contribution to overall digital signatures market growth.
By Signature Type: Advanced Signatures Balance Usability And Legal Weight
Advanced electronic signatures held 48.38% revenue share in 2025, offering enterprises cryptographic assurance without the accredited infrastructure overhead that qualified signatures demand. Courts are tightening evidentiary standards, nudging firms to abandon basic click-wrap methods for any contract above materiality thresholds. The digital signatures market size for qualified signatures is on track to expand at a 23.84% CAGR as EU rules harmonize certificate profiles, lowering integration friction.
Qualified signatures are rising fastest in real-estate and public-procurement workflows, such as Spain’s decree that mandates qualified certificates for property transfers above EUR 300,000 (USD 320,000). Biometric signatures are emerging as a niche, provided capture devices align with ISO/IEC 19794 standards. Vendors that streamline access to qualified or biometric options inside a unified interface will capture incremental wallet share, enhancing stickiness in the digital signatures market.

By End-User Industry: Healthcare Outpaces Traditional Leaders
Banking, financial services, and insurance owned 29.76% revenue in 2025, reinforcing its historical role as the largest vertical user base. Yet healthcare is the fastest-growing vertical, expanding at a 24.12% CAGR through 2031 as telemedicine, electronic health records, and FDA 21 CFR Part 11 requirements meet. Hospitals are embedding signatures directly into patient portals, cutting consent turnaround from hours to minutes.
Government agencies are moving rapidly under digitization mandates, while logistics, real estate, and legal services continue rising adoption curves. IoT firmware signing for automotive and industrial equipment introduces a fresh, high-margin niche. These vertical motions illustrate how diverse pain points converge to propel the broader digital signatures market.
Geography Analysis
North America accounted for 40.12% of the digital signatures market in 2025, buoyed by the mature ESIGN Act and concentration of major vendors. Canadian lenders report that 84% of mortgage applications used electronic signatures in 2025, while Mexico’s 2024 code amendment has pushed notarial acts online. Court enforcement certainty and abundant vendor choice sustain robust transaction volumes across fintech, healthcare, and real estate.
Asia Pacific is the fastest-growing region with a 23.22% CAGR to 2031. India’s eSign handled 76% of vehicle transfers through digital signatures in 2025, extending reach beyond banking. Singapore’s near-universal government adoption and Australia’s national digital identity scheme prove public-sector leadership can jump-start private demand. China’s tight data-localization rules slow foreign cloud vendors but foster domestic champions that satisfy local residency mandates. Japan’s 2024 legal update unlocked export-documentation digitization, lifting usage among manufacturers.
Europe shows complex dynamics. eIDAS 2.0 mandates pan-EU recognition of qualified signatures, and Germany alone issued 2.3 million certificates in 2025. The United Kingdom, outside the EU, recognizes electronic bills of lading under its 2024 regulations, spurring trade-finance digitization. France reduced accredited trust providers to 12 under stricter 2025 audit rules, consolidating share among larger players. Smaller regions such as the Middle East and Africa benefit from EU-aligned frameworks, and Brazil’s ICP-Brasil underpins qualified tax filings across South America. Together these regional trends underscore the global breadth of the digital signatures market.

Competitive Landscape
DocuSign, Adobe, Microsoft, OneSpan, and Thales controlled roughly 58% of the digital signatures market in 2025, yet competitive intensity is rising as enterprise-SaaS platforms embed signing at marginal cost. Microsoft leverages its 400 million-user base to capture mid-market accounts without separate procurement. Adobe focuses on AI-driven content summarization and workflow triggers that elevate document intelligence. DocuSign launched Maestro Agentic AI to auto-extract signers, shrinking configuration time by 70%.
Regional specialists thrive by navigating data-localization rules and trust-service accreditation hurdles. India’s eMudhra, Brazil’s CertiSign, and the Nordic region’s Signicat secure public-sector contracts by operating domestic data centers and complying with local cryptography guidelines. PKI specialists like DigiCert and Entrust penetrate IoT firmware signing, where automotive cybersecurity demands high-assurance, low-latency verification. Patent filings for PQC, blockchain audit trails, and biometrics climbed 210% in 2024-2025, showing that technology differentiation remains vital.
Market structure is drifting toward bifurcation: premium qualified trust-service providers charge for high assurance, while commodity advanced-signature vendors compete on user experience and integrations. Vendors that master algorithm agility, identity federation, and AI-based fraud detection will capture disproportionate value as the digital signatures market scales internationally.
Digital Signatures Industry Leaders
DocuSign Inc.
Adobe Inc. (Adobe Sign)
OneSpan Inc.
Thales Group (SafeNet)
Entrust Corporation
- *Disclaimer: Major Players sorted in no particular order

Recent Industry Developments
- December 2025: DocuSign released ComplianceManager, an AI-supported dashboard that auto-maps signature workflows to regional data-residency obligations for multinational customers.
- November 2025: DocuSign launched Maestro Agentic AI to extract signer requirements and automate routing, cutting manual setup by 70%.
- September 2025: The European Commission issued Implementing Regulation 2025/1569 defining technical standards for the European Digital Identity Wallet.
- August 2025: Adobe unveiled Acrobat AI Assistant with embedded signatures, driving a 23% rise in API traffic.


Research Methodology Framework and Report Scope
Market Definitions and Key Coverage
Our study defines the digital signatures market as the total yearly revenue generated from software, hardware, and managed signing services that apply public-key cryptography to create verifiable, tamper-evident electronic signatures for documents, data packets, and workflow APIs. This covers licensed platforms, cloud subscriptions, hardware security modules, and support fees sold to enterprises and public agencies worldwide.
Scope Exclusions: The analysis omits simple e-signature tools that lack certificate-based encryption and any standalone biometric verification systems.
Segmentation Overview
- By Deployment
- On-Premise
- Cloud
- By Offering
- Software
- Hardware
- Services
- By Signature Type
- Basic Electronic Signatures
- Advanced Electronic Signatures
- Qualified Electronic Signatures
- By End-User Industry
- BFSI
- Government
- Healthcare
- Oil and Gas
- Military and Defense
- Logistics and Transportation
- Other End-User Industries (Research and Education, Real Estate, Manufacturing, Legal, IT and Telecom)
- By Geography
- North America
- United States
- Canada
- Mexico
- South America
- Brazil
- Argentina
- Chile
- Peru
- Rest of South America
- Europe
- Germany
- United Kingdom
- France
- Italy
- Spain
- Rest of Europe
- Asia Pacific
- China
- Japan
- South Korea
- India
- Australia
- New Zealand
- Rest of Asia Pacific
- Middle East
- United Arab Emirates
- Saudi Arabia
- Turkey
- Africa
- South Africa
- Kenya
- Nigeria
- Rest of Africa
- North America
Detailed Research Methodology and Data Validation
Primary Research
Structured interviews with CSPs, trust-service providers, compliance officers, and procurement heads across North America, Europe, Asia-Pacific, and the GCC helped us validate pricing corridors, deployment mix, and renewal cycles.
Follow-up surveys with large banks and government digital ID teams closed data gaps and reconciled conflicting desk findings.
Desk Research
We gathered baseline demand signals from open sources such as the European Commission's eIDAS implementation tracker, NIST digital identity guidelines, U.S. Federal Procurement Data, and regional ICT spending dashboards. Company 10-Ks, IPO filings, and quarterly earnings gave us adoption ratios, while trade bodies like ETSI and the Cloud Signature Consortium supplied certificate issuance volumes.
Mordor analysts then tapped D&B Hoovers for vendor financial splits, Dow Jones Factiva for deal flow, and Questel for patent families that signal pipeline strength. Other public datasets, for instance, national cyber-crime statistics and postal service digitization KPIs, further shaped market boundary checks. The sources listed are illustrative, not exhaustive, and many additional references informed our view.
Market-Sizing & Forecasting
A top-down reconstruction of spend was built from regulated transaction volumes and certificate penetration rates, which is corroborated once with bottom-up roll-ups of sampled vendor revenue and channel checks. Key variables in the model include eIDAS 2.0 enforcement timelines, BFSI Know-Your-Customer refresh cycles, API call volumes in SaaS ecosystems, average price per qualified certificate, and regional cloud adoption indices. Multivariate regression on these drivers produces annual growth factors, after which scenario analysis stress-tests low-adoption and accelerated-digitization cases.
Data Validation & Update Cycle
Outputs pass anomaly checks against independent metrics, peer review by a senior analyst, and, if variance exceeds set thresholds, re-contact of primary sources. We refresh each model yearly and issue interim updates when regulation or mega-mergers materially shift assumptions.
Why Mordor's Digital Signatures Baseline Commands Global Reliability
Published figures often differ because each firm chooses distinct scope boundaries, input proxies, and refresh cadences. By anchoring totals to cryptography-based signatures only and by aligning certificate counts with documented regulatory filings, we minimize hidden overlaps or omissions.
Key gap drivers with other publishers include whether simple e-signatures are bundled, how cloud API revenue is recognized, the currency conversion month used, and the frequency of forecast revision.
Benchmark comparison
| Market Size | Anonymized source | Primary gap driver |
|---|---|---|
| USD 13.32 Billion (2025) | Mordor Intelligence | |
| USD 13.40 Billion (2025) | Global Consultancy A | Bundles non-cryptographic e-signature and PKI certificate sales, inflating scope |
| USD 6.98 Billion (2025) | Trade Journal B | Relies on public vendor statements and omits cloud API revenue streams |
| USD 7.13 Billion (2024) | Industry Publication C | Uses prior-year exchange rates and excludes hardware security modules |
Taken together, the comparison shows that Mordor's disciplined scope selection, transparent variables, and annual refresh schedule deliver a balanced, dependable baseline that decision-makers can trace and replicate with confidence.


Key Questions Answered in the Report
What is the projected value of the digital signatures market in 2031?
It is expected to reach USD 47.19 billion, expanding at a 22.90% CAGR during 2026-2031.
Which deployment model is growing fastest within digital signing?
Cloud workflows lead, with a 25.66% CAGR forecast through 2031.
Why is healthcare adoption accelerating?
Telemedicine consent, EHR integrations, and FDA Part 11 compliance drive a 24.12% CAGR to 2031.
How are post-quantum requirements affecting adoption?
NIST PQC standards push vendors to dual-sign certificates, creating upgrade demand for HSMs and software stacks.
Which region shows the highest growth potential?
Asia Pacific posts a 23.22% CAGR through 2031 due to large-scale public-sector digitization programs.
Page last updated on:


