Digital Battlefield Market Size and Share
Market Overview
| Study Period | 2019 - 2031 |
|---|---|
| Market Size (2026) | USD 82.65 Billion |
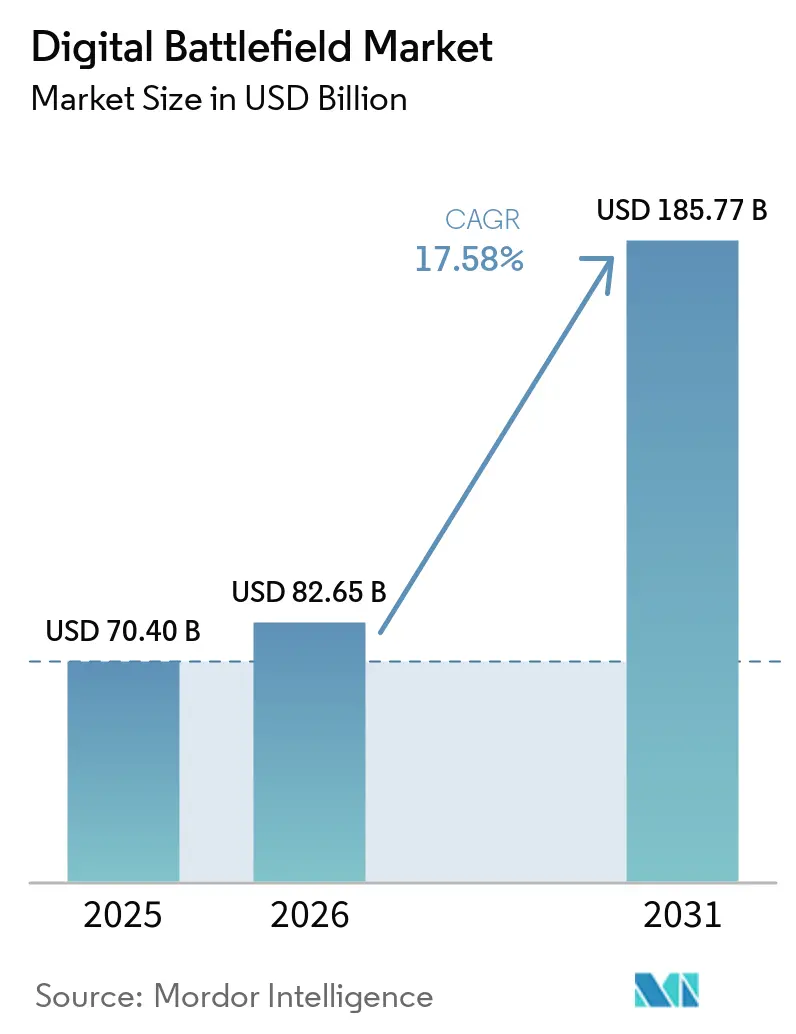
| Market Size (2031) | USD 185.77 Billion |
| Growth Rate (2026 - 2031) | 17.58% CAGR |
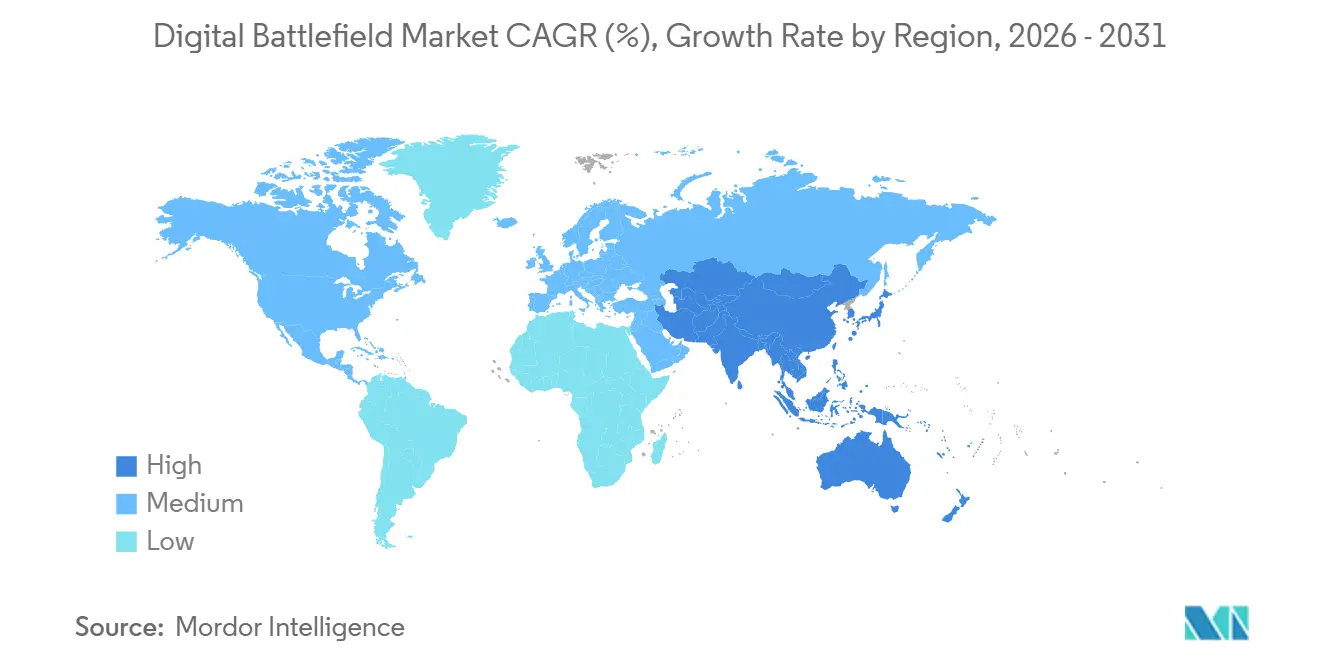
| Fastest Growing Market | Asia-Pacific |
| Largest Market | North America |
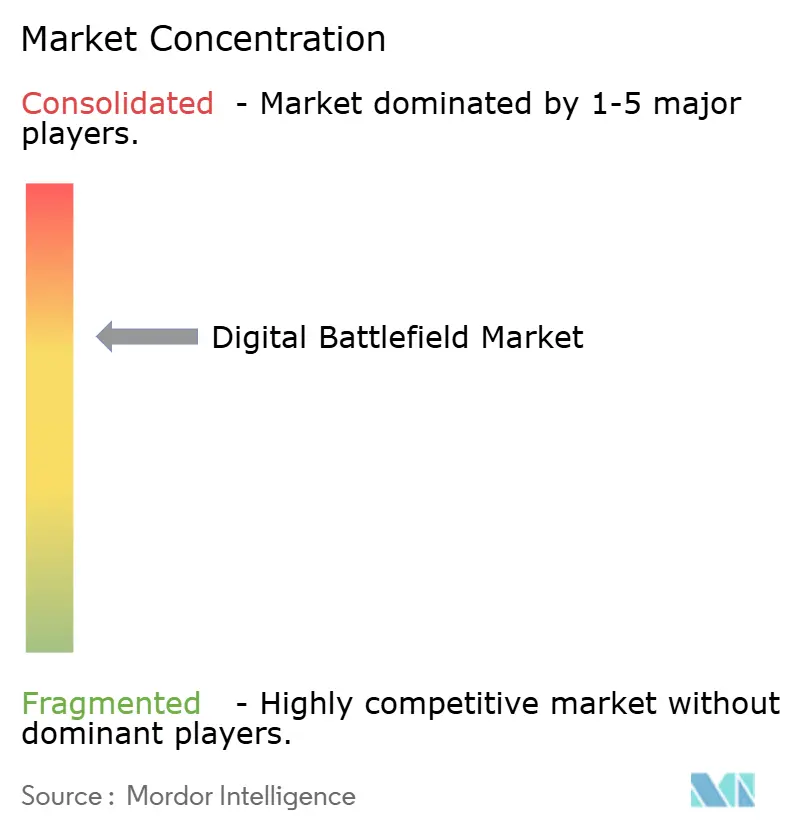
| Market Concentration | Medium |
Major Players *Disclaimer: Major Players sorted in no particular order Image © Mordor Intelligence. Reuse requires attribution under CC BY 4.0. | |
Digital Battlefield Market Analysis by Mordor Intelligence
The digital battlefield market was valued at USD 70.40 billion in 2025 and is projected to grow from USD 82.65 billion in 2026 to USD 185.77 billion by 2031, at a 17.58% CAGR from 2026 to 2031. Defense buyers are moving spending away from stand-alone platforms and toward software-defined architectures that connect command, sensing, communications, and fires across a shared data layer. Public funding remains a major support for the digital battlefield market, with the US Department of Defense (DoD) requesting USD 23.2 billion for C4I procurement and R&D in its FY2026 submission to Congress, which shows the scale of institutional commitment behind current programs. Procurement cycles are also being shortened by geopolitical pressure across Europe, Asia, and the Middle East, which is pushing faster adoption of integrated command networks, ISR, and connected fires. The digital battlefield market is also being shaped by a contest between established defense primes protecting large program positions and software-led entrants that can deliver open architecture and rapid updates. At the same time, cybersecurity exposure, legal scrutiny of autonomy, and supply constraints on specialized chips remain real constraints that affect procurement timing, certification, and vendor selection.
Key Report Takeaways
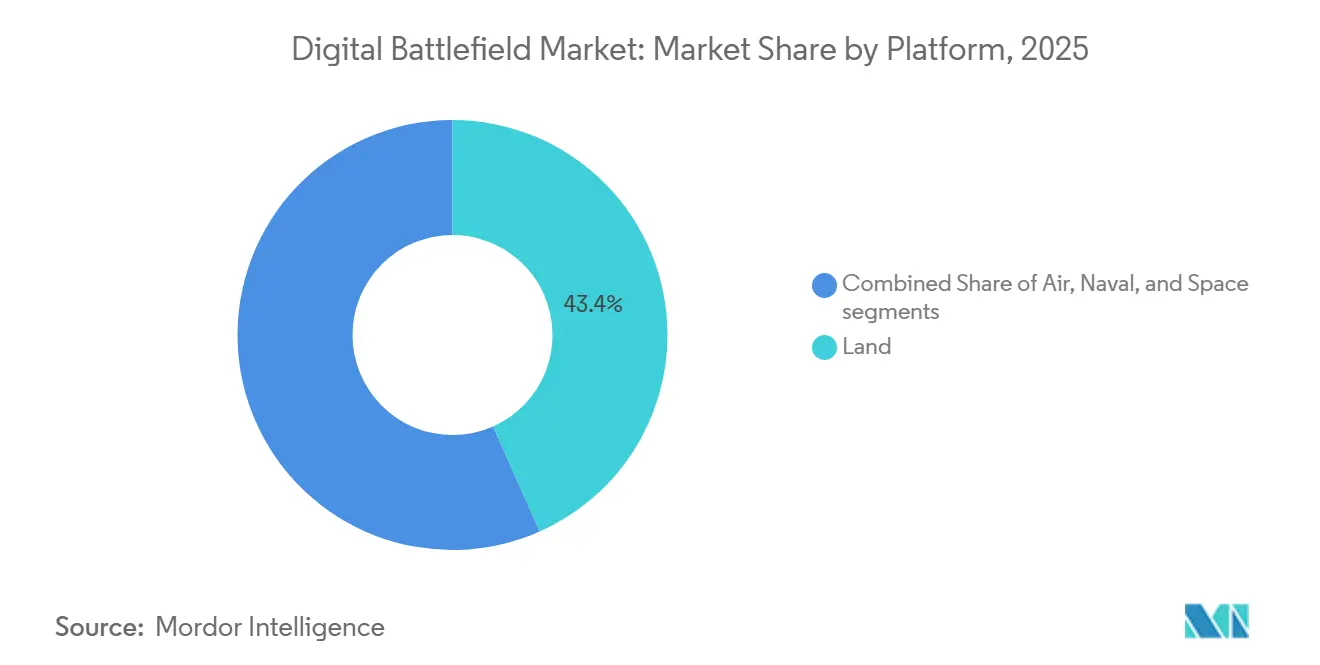
- By platform, land held 43.35% share in 2025, while space is forecast to expand at a 19.66% CAGR through 2031.
- By component, hardware led with 48.67% share in 2025, while services are forecast to grow at a 20.43% CAGR through 2031.
- By technology, AI and big data analytics accounted for a 28.41% share in 2025, while digital twin and simulation are forecast to grow at a 19.84% CAGR through 2031.
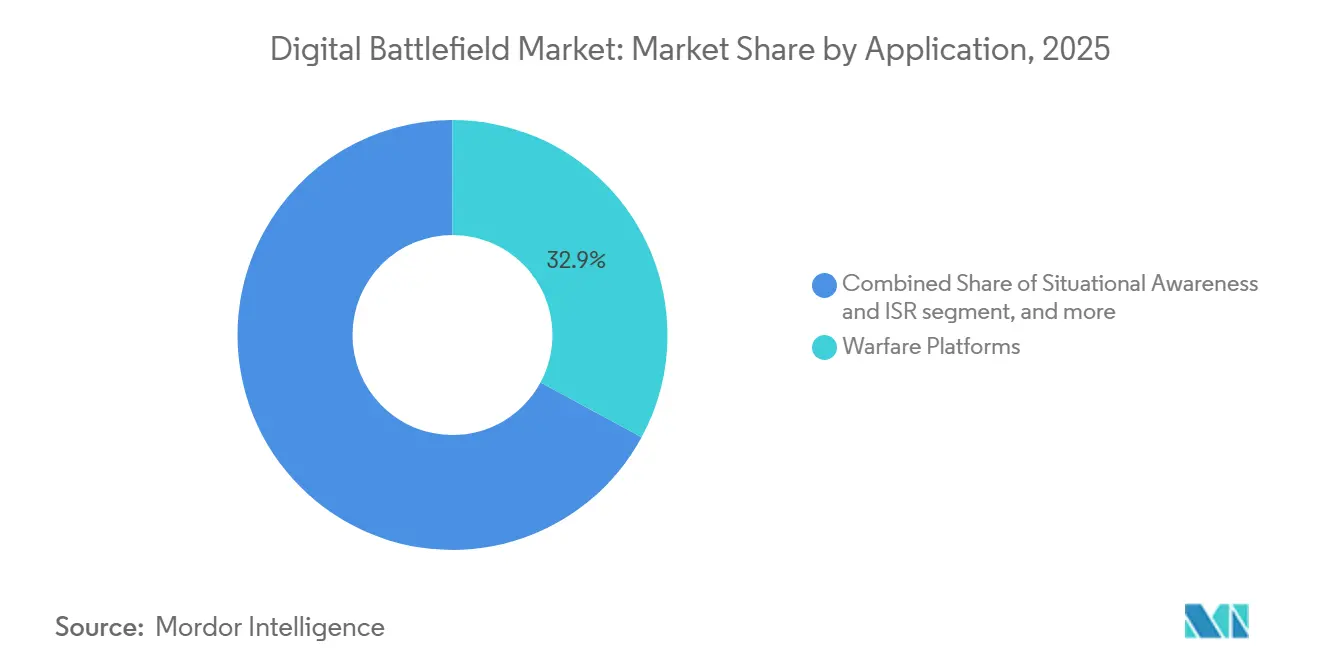
- By application, warfare platforms captured 32.89% share in 2025, while logistics and fleet management are projected to grow at an 18.05% CAGR through 2031.
- By end-user, the Army held a 39.25% share in 2025, while the Navy is forecast to expand at a 19.64% CAGR through 2031.
- By geography, North America accounted for 32.78% of global value in 2025, while Asia-Pacific is projected to grow at a 18.39% CAGR through 2031.
Note: Market size and forecast figures in this report are generated using Mordor Intelligence’s proprietary estimation framework, updated with the latest available data and insights as of January 2026.
Global Digital Battlefield Market Trends and Insights
Drivers Impact Analysis*
| Driver | (~) % Impact on CAGR Forecast | Geographic Relevance | Impact Timeline |
|---|---|---|---|
| Advances in AI and big-data analytics for real-time decision-making | +3.8% | Global, led by US, China, Israel | Short term (≤ 2 years) |
| Growing military adoption of IoT-enabled sensors and devices | +3.5% | Global, with concentrated gains in North America and apac core | Short term (≤ 2 years) |
| Rising defense budgets for network-centric warfare (NCW) capabilities | +3.2% | North America, Europe, APAC | Medium term (2-4 years) |
| Expansion of 5G/SATCOM networks for resilient connectivity | +2.8% | North America, Europe spill-over to MEA | Medium term (2-4 years) |
| Adoption of digital twin tech for combat-scenario simulation | +2.2% | North America, Europe, APAC | Medium term (2-4 years) |
| Demand for energy-autonomous edge devices to cut logistical burden | +1.6% | Global, concentrated in expeditionary-force nations | Long term (≥ 4 years) |
| Source: Mordor Intelligence | |||
Growing Military Adoption of IoT-Enabled Sensors and Devices
The digital battlefield market is gaining from a steady rise in sensor density at the tactical edge. Peer-reviewed research in Discover Internet of Things shows that military IoT deployments depend on solving interoperability, energy management, security, and network resilience simultaneously, which is pushing procurement toward more specialized battlefield hardware and secure onboarding models as a denser sensor mesh improves the common operating picture and shortens the time between detection and response without requiring a full redesign of every command post. The US DoD reinforced this direction through its July 2025 zero-trust memorandum, which explicitly extends compliance expectations to IoT and edge devices and gives buyers a clearer baseline for vendor qualification.[1]Department of Defense Chief Information Officer, “Directive-Type Memorandum 25-003 Implementing the DoD Zero Trust Strategy,” U.S. Department of Defense, esd.whs.mil As these security and interoperability rules become clearer, the digital battlefield market is benefiting from lower deployment friction for wearables, sensors, and connected battlefield nodes. The result is a procurement cycle that increasingly treats tactical connectivity and sensor ingestion as core mission capabilities rather than as a support layer.
Rising Defense Budgets for Network-Centric Warfare Capabilities
The digital battlefield market is also supported by a broader rearmament cycle that is shifting budgets toward network-centric warfare and data-linked operations. In the US, congressional defense materials for FY2026 show large allocations for C4I, space systems, missile warning, and related digital capabilities, confirming that battlefield digitization is embedded in mainstream defense planning rather than in experimental lines. Japan is moving in the same direction with its FY2026 budget request, where cross-domain operational capability and stand-off defense remain central themes.[2]Japan Ministry of Defense, “FY2026 Budget Request,” Ministry of Defense Japan, mod.go.jp France also moved to strengthen its military digital base through a new defense digital authority and additional public support for cyber and digital resilience, indicating that European programs are becoming more centralized and faster to execute. These shifts are important because the digital battlefield market now sits closer to cloud infrastructure, data management, and secure software operations than to traditional stand-alone equipment replacement. That is gradually expanding the set of relevant suppliers beyond defense hardware firms alone.
Advances in AI and Big-Data Analytics for Real-Time Decision-Making
The digital battlefield market is being reshaped by AI systems that reduce the time needed to process and use operational data. The US Army's research on Project Odin described how battlefield feeds on fuel, maintenance, terrain, and weather can be fused into a decision support tool that helps commanders anticipate conditions and act sooner, changing the role of AI from a specialist tool into a layer that links sensing, logistics, command, and mission execution. It also supports a wider shift in spending priorities, where software-defined analytics layers can receive budget preference over additional stand-alone hardware in programs that already have large installed fleets. The digital battlefield market, therefore, benefits not only from new AI applications but also from the way AI increases the value of existing radios, sensors, and command systems by enabling their outputs to be used more quickly. As adoption deepens, budget power is likely to continue moving toward software, model maintenance, and trusted data infrastructure rather than toward hardware alone.
Expansion of 5G/SATCOM Networks for Resilient Connectivity
The digital battlefield market is also gaining from the move toward hybrid communications networks that blend terrestrial and satellite connectivity. Lockheed Martin and Nokia Federal Solutions introduced a field-ready, modular 5G capability in 2026 that aligns with CMOSS open-architecture standards, demonstrating that standards-based military 5G is moving from test work into deployable systems.[3]Lockheed Martin, “Nokia Federal Solutions and Lockheed Martin Introduce Mission-Critical 5G Solution,” Lockheed Martin Newsroom, news.lockheedmartin.com This matters because resilient connectivity now depends less on a single network layer and more on a mix of transport options that can withstand disruption while still moving data at a useful speed. The DoD's Private 5G Deployment Strategy also makes security architecture and Open RAN alignment part of the procurement path, which directly shapes supplier eligibility. As satellite and terrestrial layers are more closely linked, force mobility improves because units can maintain data services with less reliance on fixed ground infrastructure. That makes communications resilience one of the more durable supports for the digital battlefield market through the forecast period.
Restraints Impact Analysis*
| Restraint | (~) % Impact on CAGR Forecast | Geographic Relevance | Impact Timeline |
|---|---|---|---|
| Cybersecurity vulnerabilities and data-breach risks | -1.8% | Global, most acutely in North America and Europe | Short term (≤ 2 years) |
| Interoperability hurdles with legacy C4ISR systems | -1.2% | Global, particularly in NATO multi-force operations | Medium term (2-4 years) |
| Ethical-legal concerns over autonomous lethal decision-making | -0.9% | Global, led by EU, UN member states | Long term (≥ 4 years) |
| Supply-chain shortages of radiation-hardened semiconductors | -0.7% | North America, Europe, APAC space programs | Medium term (2-4 years) |
| Source: Mordor Intelligence | |||
Cybersecurity Vulnerabilities and Data-Breach Risks
The digital battlefield market carries a wider attack surface as more devices, radios, sensors, and edge processors are connected to shared mission networks. France’s National Cybersecurity Strategy for 2026 to 2030 also raised reporting and resilience expectations, which signals higher compliance obligations for contractors operating across allied defense programs. These pressures can slow procurement in the digital battlefield market because buyers increasingly require secure update paths, stronger auditability, and more evidence of system hardening before wider deployment. The result is not a collapse in demand, but a longer and more expensive path from demonstration to field use.
Ethical-Legal Concerns Over Autonomous Lethal Decision-Making
The digital battlefield market also faces legal and policy risk as autonomous targeting capabilities move closer to frontline use. The UN Group of Governmental Experts on lethal autonomous weapons systems held one 2026 session in March and scheduled a second session for August to September 2026, with the current mandate tied to the Seventh CCW Review Conference in November 2026.[4]United Nations Office for Disarmament Affairs, “Convention on Certain Conventional Weapons Group of Governmental Experts on Lethal Autonomous Weapons Systems 2026,” United Nations, meetings.unoda.org In parallel, the ICRC’s October 2025 position paper argued that existing humanitarian law already places strong limits on some categories of autonomous weapons and supports stricter control over others. For vendors in the digital battlefield market, this means increased spending on human-machine interface design, review tools, logging functions, and audit trails that demonstrate meaningful human control. It also means longer certification paths where procurement bodies want legal assurance before scaling autonomous functions. These factors do not stop investment, but they do slow the pace at which some higher-autonomy features can move from pilot programs into standard procurement.
*Our forecasts treat driver/restraint impacts as directional, not additive. The impact forecasts reflect baseline growth, mix effects, and variable interactions.
Segment Analysis
By Platform: Space Assets Outpace Legacy Ground Systems
Land platforms held 43.35% of the market in 2025, maintaining their position as the largest platform group on the digital battlefield. This position reflects the large installed base of soldier systems, vehicle command nodes, battlefield radios, and ground sensing equipment already embedded in force structures. Land remains central because army formations still account for the broadest operational demand across command, logistics, ISR, and tactical communications. Even so, the platform mix is starting to widen as air, naval, and space programs absorb a larger part of new digital spending.
The faster shift is visible in space, where the segment is projected to grow at a 19.66% CAGR through 2031. The US defense materials for FY2026 included USD 34 billion in space procurement and R&D. This part of the digital battlefield market is driven by the need for low-latency relaying, resilient sensing, and theater-wide connectivity that ground networks alone cannot provide. A growing share of defense planning now treats space assets as an operational data transport layer rather than as a remote support function. That shift should keep diluting the relative weight of legacy, ground-heavy spending, even as land remains the largest installed base.


By Component: Services Growth Reflects the Software-First Procurement Shift
Hardware accounted for 48.67% of component value in 2025, which made it the largest component group in the digital battlefield market. That lead is still supported by radios, computing modules, sensors, displays, and mission equipment that must be fielded at scale. Hardware also remains essential because open architecture still depends on compatible physical nodes that can host software, transport data, and survive military operating conditions. Even so, the greatest change in buying behavior is occurring outside of one-time equipment delivery.
Services are forecast to grow at a 20.43% CAGR through 2031, making it the fastest-growing component of the digital battlefield market, reflecting a clear move toward managed support, data-layer maintenance, cyber compliance, software maintenance, and ongoing model updates throughout a program's life. Lockheed Martin's NGC2 work has shown how iterative development and recurring field feedback are becoming part of routine delivery rather than a separate prototype phase. The same pattern appears in General Dynamics Information Technology's USD 988 million Navy C5ISR support award, where long-duration support carries much of the value rather than a narrow hardware shipment.[5]General Dynamics, “GDIT Awarded USD 988 Million Contract to Modernize Navy C5ISR Systems,” General Dynamics Investor Relations, investorrelations.gd.com In practical terms, the digital battlefield industry is becoming increasingly dependent on recurring service contracts to maintain mission readiness after hardware is fielded.
By Technology: AI Analytics Commands the Largest Share, Digital Twins Drive the Next Wave
AI and big data analytics held a 28.41% share in 2025, giving it the largest technology position in the digital battlefield market. That leadership reflects the immediate value of turning raw ISR, logistics, terrain, and mission data into usable decision support. Programs such as Project Odin show why this layer remains central, since commanders need systems that can combine large data feeds and help prioritize action under time pressure, keeping AI at the center of current spending, even as other technologies advance faster.
Digital twin and simulation are projected to grow at a 19.84% CAGR through 2031, making it the fastest-growing technology track in the digital battlefield market. A digital-intelligent parallel battlefield framework for air defense and anti-missile operations facilitates the simultaneous testing of multiple simulated paths to optimize strike geometry and timing. That matters because militaries can compress testing cycles and reduce live-fire risk while still improving readiness and mission planning. IoT and edge computing continue to gain from zero-trust requirements, while resilient communications layers benefit from the broader 5G and SATCOM build-out. The digital battlefield industry is therefore moving on two tracks at once, where AI holds the largest current role and digital twins create the next wave of faster experimentation and validation.
By Application: Logistics Modernization Unlocks Hidden Combat Power
Warfare platforms accounted for 32.89% of application demand in 2025, making them the largest application group in the digital battlefield market, maintaining consistency with defense budgets that still prioritize weapon integration, target engagement, and mission system effectiveness. In many programs, digital upgrades are first justified by their effect on strike accuracy, survivability, and time to engage. That keeps warfare-centric applications at the front of near-term spending even as other uses expand.
Logistics and fleet management are projected to grow at an 18.05% CAGR through 2031, making it the fastest-growing application in the digital battlefield market. The US Army has framed NGC2 logistics work around a shift from fragmented, delayed reporting to a common operating picture that is timely, accurate, and actionable, demonstrating how logistics data now directly supports command decisions. AWS also demonstrated an intelligent energy management system for tactical forces that optimized power allocation across multiple technologies and reduced generator burden in field conditions, as readiness losses often begin with constraints on fuel, maintenance, batteries, and transport rather than with weapon shortages.
By End-User: Navy's Digital Deficit Drives Above-Market Catch-Up
Army held a 39.25% share in 2025, giving it the largest end-user position in the digital battlefield market. That lead reflects the scale of ground formations and the breadth of requirements for command networks, tactical communications, sensing, and sustainment tools across the land domain. Army spending is also highly visible because major modernization programs carry large annual budget lines and broad fielding needs. As a result, the digital battlefield market still relies heavily on land-force modernization cycles to drive baseline demand.
Navy is projected to expand at a 19.64% CAGR through 2031, making it the fastest-growing end-user in the digital battlefield market. General Dynamics Information Technology’s Navy C5ISR modernization award shows that fleet digitization now depends on long-duration support across communications, computing, combat management, ISR, and surveillance systems. Air Force demand is also rising as all-domain command networks and connected air operations require stronger data infrastructure, and L3Harris was selected in 2026 to support the digital backbone for the Advanced Battle Management System (ABMS).
Geography Analysis
North America accounted for 32.78% of the global market value in 2025, maintaining its position as the largest regional block in the digital battlefield market. The region benefits from the scale of US defense spending, a dense contractor base, and procurement frameworks that shape allied procurement behavior. Congressional defense materials for FY2026 show the depth of US spending across C4I, space, and missile warning functions, which supports continuing program momentum. The region also sets important vendor standards through zero-trust and private 5G security frameworks that influence qualification beyond the United States.
Asia-Pacific is projected to expand at a 18.39% CAGR through 2031, making it the fastest-growing region in the digital battlefield market. Growth is being supported by large digitization programs across China, India, Japan, and South Korea, with demand spanning AI-enabled command tools, secure communications, cyber cooperation, and networked operations. Japan’s FY2026 defense budget request continued to emphasize cross-domain capabilities and stand-off digital connectivity, reinforcing the view that regional military planning is moving toward more integrated battlefield systems. India and South Korea also expanded their defense technology cooperation in 2026 through a joint strategic vision that covered cyber, innovation, and advanced technology areas relevant to connected operations.
Europe, the Middle East, and Africa remain important growth corridors for the digital battlefield market. Europe is moving faster on defense digitization through greater centralized digital authority and a stronger focus on interoperability across allied programs. The UK’s Babel Fish exercise with Lockheed Martin Skunk Works in April 2026 showed practical progress in sharing F-35 data with ground-effector command networks, which is critical for coalition operations. South America remains the smallest regional segment, where spending is more concentrated in border surveillance and maritime ISR than in full-scale digital transformation.

Competitive Landscape
The digital battlefield market shows moderate concentration at the top tier, where a limited group of large defense primes captures much of the revenue from major programs. At the same time, the mid-tier, software-led layer is much more fragmented, especially in analytics, edge computing, power management, and open data tools. That creates a market where scale matters for long-cycle awards, but specialization still matters for mission software and integration problems that cannot be solved by size alone. The result is a competitive structure in which incumbents defend their installed positions while newer firms vie to win the data layer, the application layer, or the open-architecture interface.
A common strategy across leading suppliers is to position around modular integration rather than closed, end-to-end ownership. Lockheed Martin’s NGC2 work with the 25th Infantry Division used a common data layer and a modular mission interface to connect capabilities across domains, demonstrating how large primes are adapting to open-architecture expectations. General Dynamics Information Technology’s Navy C5ISR modernization award is another example, since the contract centers on sustaining an operational digital backbone over time rather than delivering isolated equipment. L3Harris also strengthened its position through selection for ABMS network infrastructure, which ties the company to the data integration backbone of joint all-domain command and control (JADC2). These moves show that the digital battlefield market rewards suppliers that can stay relevant by fielding upgrades, managing data, ensuring interoperability, and providing recurring support.
Competition is also being shaped by combat validation, compliance, and the ability to work inside open standards. Elbit Systems’ digitization contracts for the IDF’s Tzayad Digital Ground Army and MARS programs show how operationally proven systems can support export credibility and broader modernization positioning. CMOSS alignment is becoming increasingly important for vehicle-mounted C5ISR hardware, while zero-trust and cyber certification are increasingly shaping supplier access to sensitive work. The largest open commercial space still sits in coalition interoperability, where many allied forces still struggle to share sensor, fire-control, and logistics data in real time. Vendors that can bridge standards, security levels, and data formats without forcing full reprocurement are likely to gain outsized value in the digital battlefield market.
Digital Battlefield Industry Leaders
Lockheed Martin Corporation
RTX Corporation
Northrop Grumman Corporation
BAE Systems plc
Thales Group
- *Disclaimer: Major Players sorted in no particular order

Recent Industry Developments
- May 2026: Nokia Federal Solutions and Lockheed Martin introduced a modular, field-ready 5G capability for the US Department of War platforms. This solution adheres to CMOSS open-architecture standards and is designed for integration across military vehicles, making it the first deployment-ready CMOSS 5G solution.
- May 2026: L3Harris was chosen by the US Air Force to develop digital infrastructure for the ABMS network, functioning as the data integration backbone for JADC2.
- April 2026: The UK Ministry of Defence (MoD) and Lockheed Martin Skunk Works completed the Babel Fish exercise. This exercise demonstrated the F-35's ability to share data with British Army ground effectors using Lockheed's open-systems NEXUS architecture, validating multi-domain allied interoperability.
- February 2026: Elbit Systems Ltd. received contracts totaling more than USD 100 million from Israel's Directorate of Defense Research & Development. These contracts aim to develop fifth-generation digitization for the IDF as part of the Tzayad Digital Ground Army and MARS border defense programs.


Global Digital Battlefield Market Report Scope
The digital battlefield refers to the integration of advanced technologies, such as artificial intelligence, IoT, and augmented reality, into military operations to enhance decision-making, situational awareness, and operational efficiency. It enables real-time data sharing and analysis across various platforms and components, ensuring a more connected and informed battlefield environment.
The digital battlefield market is segmented by platform, component, technology, application, end-user, and geography. By platform, the market is segmented into land, air, naval, and space. By component, it is segmented into hardware, software, and services. By technology, the market includes artificial intelligence (AI) and big data analytics, the Internet of Things (IoT) and edge computing, 5G/SATCOM connectivity, augmented reality (AR) and virtual reality (VR), and digital twins and simulation. By application, the market is categorized into warfare platforms, situational awareness and ISR, command and control (C2), and logistics and fleet management. By end-user, the market is segmented into the army, navy, and air force. The report also covers the market sizes and forecasts for the digital battlefield market in major countries across different regions. For each segment, the market size is provided in terms of value (USD).
| Land |
| Air |
| Naval |
| Space |
| Hardware |
| Software |
| Services |
| Artificial Intelligence (AI) and Big-Data Analytics |
| Internet of Things (IoT) and Edge Computing |
| 5G/SATCOM Connectivity |
| Augmented Reality (AR) and Virtual Reality (VR) |
| Digital Twin and Simulation |
| Warfare Platforms |
| Situational Awareness and ISR |
| Command and Control (C2) |
| Logistics and Fleet Management |
| Army |
| Navy |
| Air Force |
| North America | United States | |
| Canada | ||
| Mexico | ||
| Europe | United Kingdom | |
| France | ||
| Germany | ||
| Russia | ||
| Rest of Europe | ||
| Asia-Pacific | China | |
| India | ||
| Japan | ||
| South Korea | ||
| Rest of Asia-Pacific | ||
| South America | Brazil | |
| Argentina | ||
| Rest of South America | ||
| Middle East and Africa | Middle East | Israel |
| Saudi Arabia | ||
| Turkey | ||
| Rest of Middle East | ||
| Africa | South Africa | |
| Rest of Africa | ||
| By Platform | Land | ||
| Air | |||
| Naval | |||
| Space | |||
| By Component | Hardware | ||
| Software | |||
| Services | |||
| By Technology | Artificial Intelligence (AI) and Big-Data Analytics | ||
| Internet of Things (IoT) and Edge Computing | |||
| 5G/SATCOM Connectivity | |||
| Augmented Reality (AR) and Virtual Reality (VR) | |||
| Digital Twin and Simulation | |||
| By Application | Warfare Platforms | ||
| Situational Awareness and ISR | |||
| Command and Control (C2) | |||
| Logistics and Fleet Management | |||
| By End-User | Army | ||
| Navy | |||
| Air Force | |||
| By Geography | North America | United States | |
| Canada | |||
| Mexico | |||
| Europe | United Kingdom | ||
| France | |||
| Germany | |||
| Russia | |||
| Rest of Europe | |||
| Asia-Pacific | China | ||
| India | |||
| Japan | |||
| South Korea | |||
| Rest of Asia-Pacific | |||
| South America | Brazil | ||
| Argentina | |||
| Rest of South America | |||
| Middle East and Africa | Middle East | Israel | |
| Saudi Arabia | |||
| Turkey | |||
| Rest of Middle East | |||
| Africa | South Africa | ||
| Rest of Africa | |||


Key Questions Answered in the Report
What is the expected growth path for digital battlefield spending through 2031?
The digital battlefield market is projected to rise from USD 82.65 billion in 2026 to USD 185.77 billion by 2031, at a 17.58% CAGR.
Which platform segment is expanding the fastest?
Space is the fastest-growing platform segment, with a projected 19.66% CAGR through 2031, supported by rising defense spending on resilient communications and missile warning systems.
Why are services growing faster than hardware?
Services are projected to grow at 20.43% CAGR because militaries are buying more software maintenance, managed connectivity, cyber support, and AI model upkeep alongside hardware.
Which region offers the strongest growth opportunity?
Asia-Pacific is the fastest-growing region with an 18.39% CAGR through 2031, supported by large military digitization efforts across China, India, Japan, and South Korea.
What are the main risks facing connected battlefield programs?
The main risks are cybersecurity exposure in connected systems, legal scrutiny around autonomous decision-making, interoperability gaps with legacy systems, and supply shortages in specialized semiconductors.
Which end-user is likely to add demand the fastest?
Navy is expected to post the fastest end-user growth at 19.64% CAGR, reflecting catch-up spending in fleet communications, C5ISR modernization, and digital support infrastructure.
Page last updated on:


