UAS Warfare Market Size and Share
Market Overview
| Study Period | 2019 - 2030 |
|---|---|
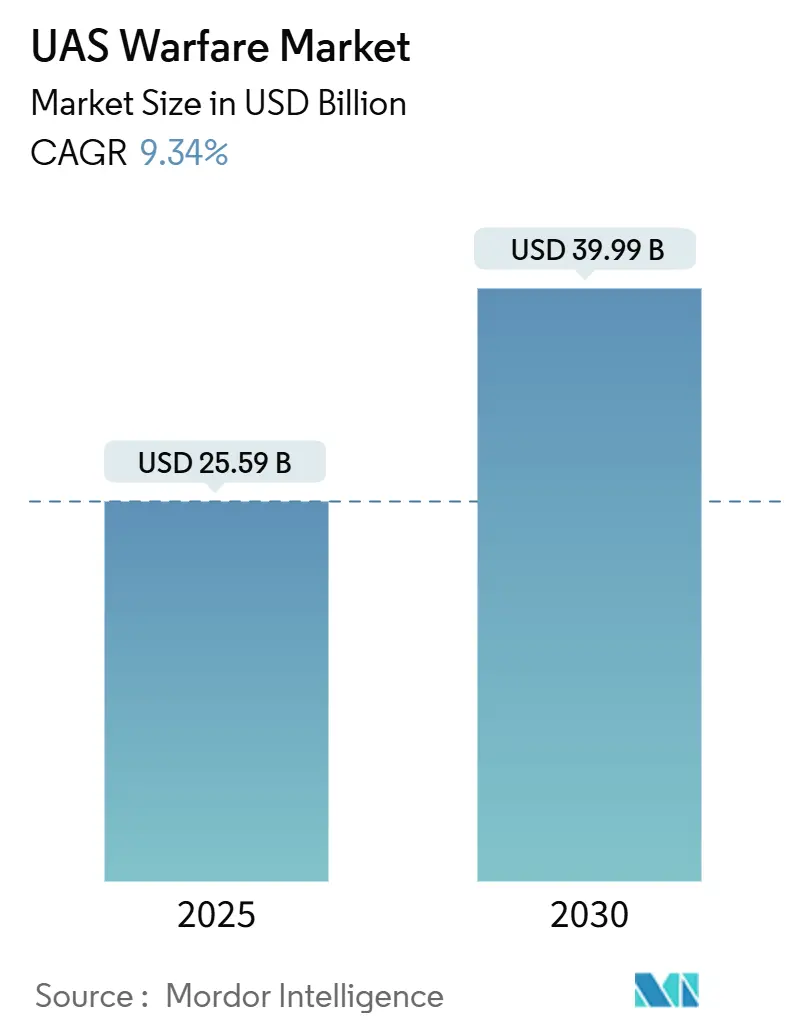
| Market Size (2025) | USD 25.59 Billion |
| Market Size (2030) | USD 39.99 Billion |
| Growth Rate (2025 - 2030) | 9.34% CAGR |
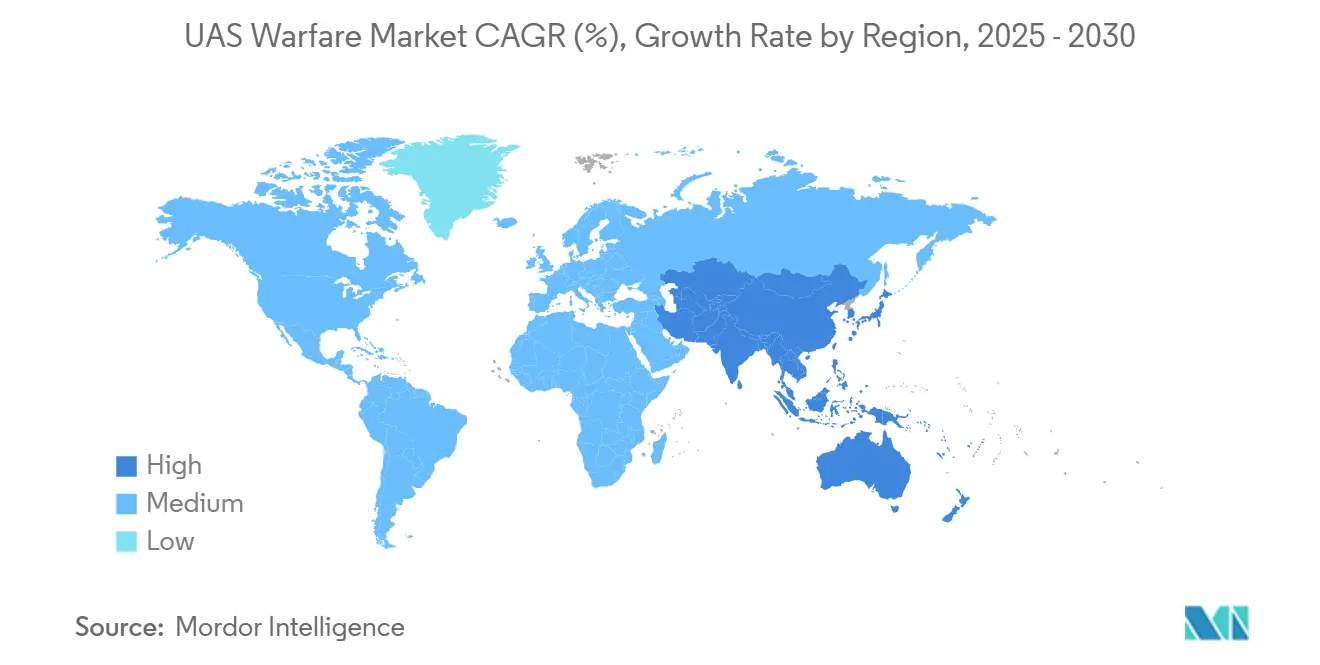
| Fastest Growing Market | Asia Pacific |
| Largest Market | North America |
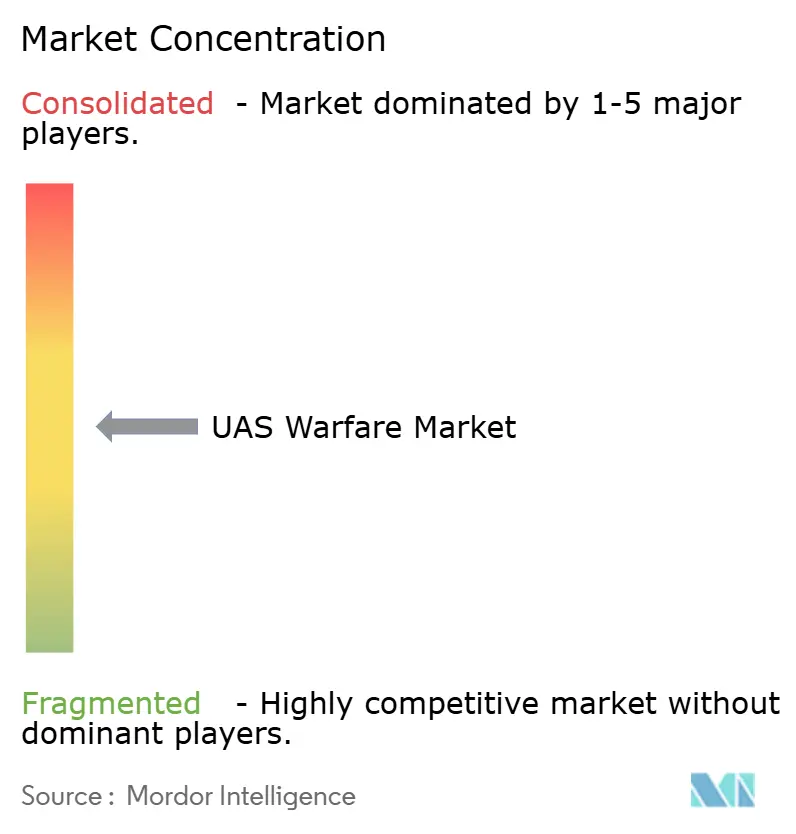
| Market Concentration | Medium |
Major Players *Disclaimer: Major Players sorted in no particular order Image © Mordor Intelligence. Reuse requires attribution under CC BY 4.0. | |
UAS Warfare Market Analysis by Mordor Intelligence
The UAS warfare market size stands at USD 25.59 billion in 2025 and is projected to reach USD 39.99 billion by 2030, advancing at a 9.34% CAGR. Procurement momentum is accelerating as defense ministries favor autonomous platforms that cut personnel risk and shorten mission planning cycles. Pentagon realignment, including a dedicated USD 33 billion drone budget, signals a lasting pivot from legacy crewed aircraft toward scalable unmanned fleets. Geopolitical flashpoints—from Eastern Europe to the Indo-Pacific—keep intelligence, surveillance, and reconnaissance (ISR) demand high, while AI-enabled swarming doctrines lower per-mission costs and expand operational reach. Supply-chain localization moves the agenda as China tightens component exports, encouraging trusted supplier networks across North America and Europe. Competitive intensity rises as traditional primes acquire niche drone specialists, seeking vertical integration that pairs air vehicles with electronic-warfare payloads and battery advances.
Key Report Takeaways
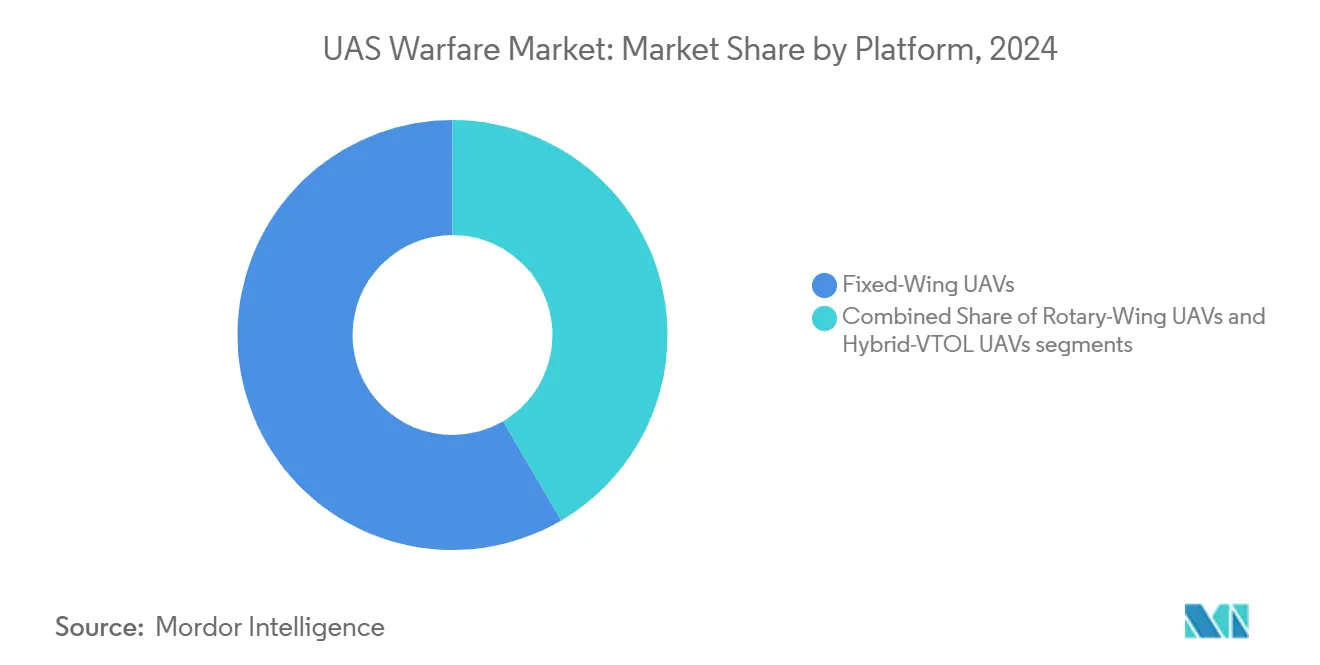
- By platform, fixed-wing UAVs held 58.45% of the UAS warfare market share in 2024, while hybrid-VTOL units are set to grow at 11.45% CAGR through 2030.
- By range, long-range aircraft commanded a 47.47% share of the UAS warfare market in 2024; beyond-line-of-sight (BLOS) platforms are expanding at a 9.8% CAGR to 2030.
- By application, intelligence, surveillance, and reconnaissance (ISR) led with 39.76% revenue in 2024, whereas electronic warfare (EW) use cases are forecast to advance at a 10.65% CAGR.
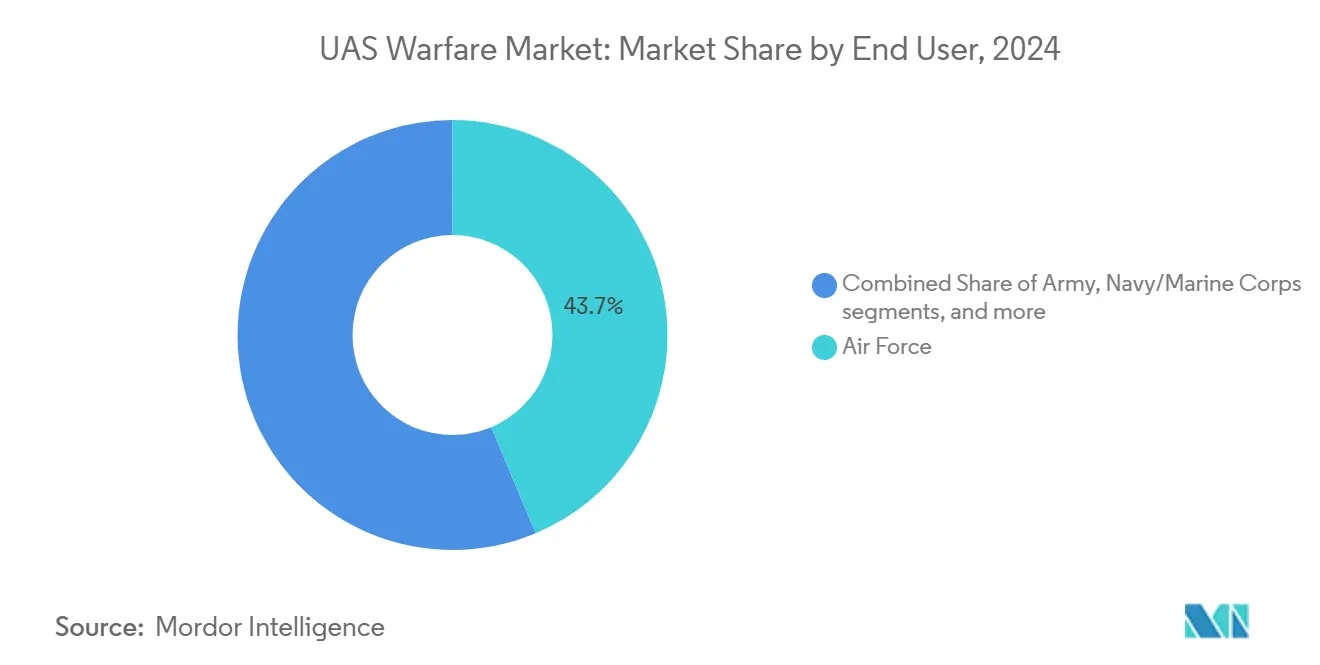
- By end user, Air Force organizations captured a 43.67% share in 2024; Special Operations Forces usage is rising fastest at 10.37% CAGR.
- By end user, air force organizations captured a 43.67% share in 2024; special operations organizations' usage is rising fast. Rapid miniaturization of EO/IR payloads is enabling micro-UAS lethality at a 10.37% CAGR.
Global UAS Warfare Market Trends and Insights
Drivers Impact Analysis*
| Driver | (%) Impact on CAGR Forecast | Geographic Relevance | Impact Timeline |
|---|---|---|---|
| DoD fleet-refresh programs accelerating procurement cycles | +2.10% | North America with NATO spillover | Medium term (2-4 years) |
| Escalating gray-zone conflicts driving persistent ISR demand | +1.80% | Eastern Europe, Indo-Pacific | Short term (≤ 2 years) |
| AI-enhanced swarming doctrines reducing per-mission costs | +1.40% | Advanced militaries worldwide | Long term (≥ 4 years) |
| Miniaturization of EO/IR payloads enabling micro-UAS lethality | +1.20% | Early adopters in US, Israel, China | Medium term (2-4 years) |
| Loitering-munition cost-effectiveness versus legacy PGMs | +1.60% | Conflict zones and borders | Short term (≤ 2 years) |
| Energy-dense solid-state batteries extending sortie endurance | +0.90% | US, Europe, Japan | Long term (≥ 4 years) |
| Source: Mordor Intelligence | |||
DoD Fleet-Refresh Programs Accelerating Procurement Cycles
Pentagon restructuring channels USD 13.5 billion to small uncrewed systems and USD 9 billion to collaborative combat aircraft, compressing acquisition timelines that once spanned a decade into two to four years. The US Air Force plans 200 unmanned fighters by 2028, backed by USD 8.89 billion through fiscal year 2029. Rapid awards cascade across contractors; AeroVironment won a USD 990 million stand-off contract in August 2025.[1]Shephard Media, “AeroVironment Wins $990 Million Stand-Off Contract with the US DoD,” shephardmedia.com The Replicator program targets an 18-month fielding rhythm, pressuring supply chains to match the pace of commercial electronics. Modernization also funds ground stations; General Atomics secured USD 174 million to upgrade MQ-9A control nodes through 2029. Compressed cycles favor firms with modular airframes and open-architecture avionics, creating a competitive edge for vertically integrated suppliers.
Escalating Gray-Zone Conflicts Driving Persistent ISR Demand
Ukraine manufactures 96% of its drones domestically and targets 4 million units in 2025, underscoring how contested regions prize persistent surveillance. Qatar’s USD 2 billion MQ-9B package highlights demand for 40-hour endurance and 11,000 km range. European nations follow, with Spain allotting USD 18.7 million to Skydio X10D systems for border monitoring. Distributed operations require networks of smaller aircraft rather than single high-value assets, spurring procurement of expendable platforms. Counter-surveillance grows in tandem; fiber-optic FPV drones bypass jamming yet impose range limits.[2]United24 Media, “One of Ukraine’s Biggest Challenges for 2025: Fiber-Optic FPV Drones,” united24media.com ISR focus cements the UAS warfare market as an intelligence multiplier across services.
AI-Enhanced Swarming Doctrines Reducing Per-Mission Costs
DARPA trials show AI swarms achieve 40% better threat detection than traditional patrols.[3]Karve, “Autonomous Surveillance: A Game Changer for Military Intelligence,” karveinternational.com The F-35 now controls multiple drones through an AI interface, extending sensor reach without adding cockpits. Automated planning slashes operator workload, allowing smaller crews to manage larger fleets. Swarm logic lets defense ministries buy numerous low-cost units rather than a few exquisite platforms, preserving capability even after attrition. The US Air Force invested USD 15.048 million to equip F-22 cockpits for manned-unmanned teaming, reflecting a doctrinal shift toward human command of autonomous assets. As software defines capability, aftermarket updates promise recurring revenue streams.
Miniaturization of EO/IR Payloads Enabling Micro-UAS Lethality
Advances in gimballed optics place high-definition sensors on palm-sized airframes, giving platoon leaders organic targeting. Israel and China showcase sub-2 kg drones carrying cooled infrared cameras for night reconnaissance. US Special Operations Command tests cavity-penetrating micro-UAS able to map tunnels in real time. Smaller sensors shrink logistics footprints, enabling forward resupply by 3-D printed parts. As payloads slim down, batteries can occupy more fuselage volume, extending flight endurance without enlarging airframes. The trend boosts hybrid-VTOL uptake because runway-independent launches pair well with lighter sensors.
Restraints Impact Analysis*
| Restraint | (%) Impact on CAGR Forecast | Geographic Relevance | Impact Timeline |
|---|---|---|---|
| Spectrum congestion and electronic-attack vulnerabilities | -1.30% | Global high-density zones | Short term (≤ 2 years) |
| Escalating counter-UAS procurement by major powers | -1.10% | North America, Europe, Asia-Pacific | Medium term (2-4 years) |
| Multilateral export-control regimes on dual-use components | -0.80% | Global tech hubs | Long term (≥ 4 years) |
| Supply-chain choke-points in high-grade composite airframes | -0.60% | US, Europe, Asia-Pacific | Medium term (2-4 years) |
| Source: Mordor Intelligence | |||
Spectrum Congestion and Electronic-Attack Vulnerabilities
Russian jamming neutralized large portions of the Ukrainian fleets, proving that open frequencies remain a critical weakness.[4]The Economist, “Many Ukrainian Drones Have Been Disabled by Russian Jamming,” economist.com Silent Swarm 2024 saw the US Navy test distributed EW with 500 participants to harden links. Adversaries deploy broadband noise and deceptive spoofing that hijack navigation. Fiber-optic control avoids RF disruption but limits range and adds tether mass. Anti-jamming modules drive up unit cost, narrowing the affordability gap versus crewed aircraft. As platforms devote payload weight to antennas and encryption, endurance gains from battery progress partially offset the added burden.
Escalating Counter-UAS Procurement by Major Powers
Lockheed Martin's AI counter-drone suite combines radar, electro-optical sensors, and directed energy to knock out swarms. Canada's CAD 169 million (USD 125 million) award to CACI typifies NATO's emphasis on layered defenses. High-power microwave arrays create exclusion bubbles that compel redesign of drone signatures. Budget planners weigh the rising cost of survivability features against initial low-cost selling points. Offensive-defensive escalation can slow procurement as militaries study loss-exchange ratios in recent conflicts. Suppliers respond with stealth coatings, electronic counter-countermeasures, and decoy tactics, all of which add complexity.
*Our forecasts treat driver/restraint impacts as directional, not additive. The impact forecasts reflect baseline growth, mix effects, and variable interactions.
Segment Analysis
By Platform: Fixed-Wing Dominance Faces VTOL Disruption
Fixed-wing aircraft generated 58.45% of 2024 revenue within the UAS warfare market, benefiting from endurance profiles exceeding 30 hours and payloads over 1 ton. Long-loiter missions for ISR and electronic warfare rely on these attributes. Hybrid-VTOL units, advancing at 11.45% CAGR, combine runway independence with aerodynamic efficiency, trimming turnaround times for ship-deck and alpine operations. Programs like DARPA’s XRQ-73 validate demand for foldable wings that transition to forward flight, while PteroDynamics contracts show naval interest in compact logistics craft. Traditional rotary-wing drones continue to serve urban assault teams, yet face cost pressure due to higher blade fatigue rates. VTOL designs can extend on-station duration as battery energy density improves, eroding fixed-wing dominance by 2030. Still, fixed-wing airframes retain altitude ceilings above 45,000 ft, granting line-of-sight to distant targets during electromagnetic suppression missions. Suppliers hedge bets through modular fuselages that accept tilt-rotor pods or conventional wings, future-proofing inventory against doctrinal shifts.
Second-order effects include new airfield planning doctrines. Runway-independent fleets permit dispersed basing, complicating enemy target lists and reducing damage from missile salvos. In turn, maintenance crews must deploy mobile re-arm stations, spurring procurement of ruggedized ground equipment. Airworthiness regulators adapt standards for transition modes, which blend helicopter and fixed-wing safety envelopes. Insurance underwriters factor lower crash energy for VTOL landings, potentially lowering total ownership cost. Hybrid-VTOL popularity may catalyze fresh competition among Tier-2 avionics suppliers that deliver attitude-control algorithms for variable geometry wings.


By Range: Long-Range Leadership Challenged by BLOS Growth
Long-range systems between 200 km and 1,000 km contributed 47.47% of 2024 revenue in the UAS warfare market. These models fill strategic reconnaissance roles while keeping launch crews well inside friendly airspace. Due to great-power competition, BLOS airframes surpassing 1,000 km now grow at a 9.8% CAGR. The MQ-9B SkyGuardian’s 11,000 km ferry capacity illustrates baseline expectations for future contracts, especially island defense scenarios in the Pacific. Short-range craft under 50 km maintain relevance for platoon-level overwatch and decoy missions because their small signatures slip through radar gaps. Medium-range categories bridge operational divides, enabling theater commanders to retask assets within hours rather than days.
As militaries network satellites, high-frequency burst links close the command gap for BLOS drones. Space relays, though, raise vulnerability to anti-satellite weapons, forcing redundancy through mesh networks of lower altitude craft. Battery progress pairs with lightweight Ku-band terminals, letting smaller airframes pierce the BLOS mission set. Conversely, large wingspans needed for fuel volume can hamper operations in rugged terrain lacking long runways. Decision makers weigh platform recoverability: extended-range systems often ferry to distant bases for teardown, complicating logistics. Amphibious float kits offer recovery flexibility in contested seas, opening new requirements for corrosion-resistant materials.
By End User: Air Force Leadership Faces SOF Challenge
Air Force branches controlled 43.67% of 2024 spending, reflecting mature command-and-control frameworks and dedicated runways. Service culture emphasizes high-altitude runs, where large sensors exploit curvature advantages. Expanding at 10.37% CAGR, Special Operations Forces need portable systems that fit rotary-wing doors and subterranean entrances. SOCOM’s procurement of cave-mapping drones shows niche parameters that command premium prices. Army formations direct acquisitions toward counter-battery spotting and close air support; 2025 saw over USD 500 million in Army counter-UAS awards. Navy budgets focus on maritime ISR, integrating launch rails on destroyers to extend horizon coverage. Marine units prioritize squad-carried loitering munitions to break stalemates in littoral fights.
End-user diversity drives platform specialization. Air Forces favor auto-takeoff systems integrating with ATC software, while SOF demands silent propellers and encrypted peer-to-peer links. Maintenance doctrines diverge: the Army brigades rotate line-replaceable units onsite, whereas Navy dockyards schedule depot-level overhauls. Training syllabi mirror requirements; piloted services allocate hundreds of simulator hours, whereas SOF incorporates mixed-reality goggles for cave missions.
By Application: ISR Dominance Meets EW Innovation
ISR tasks accounted for 39.76% of the 2024 value, affirming that data remains the decisive commodity in modern combat. Real-time video streams feed AI analytics that predict adversary movements, making ISR the anchor tenant of defense cloud architectures. Electronic warfare accelerates at 10.65% CAGR as spectrum control shapes every mission phase. General Atomics and BAE Systems integrate EW pods on existing MQ-20 Avengers, shrinking program timelines compared with designing new airframes. Combat strike segments gain through loitering munitions that blend ISR sensors with warheads, embodying find-fix-finish loops in a single airframe. Logistics drones resupply 24-hour forward observation posts, as seen with the US Air Force Grasshopper cargo glider that carries 272 kg to frontline units.
The cross-domain stack converges; Chinese FH-95 drones combine jamming and imagery to blind and exploit in one sortie. ISR payload modularity allows operators to swap multispectral cameras for SIGINT racks in hours, boosting fleet flexibility. EW growth incentivizes shielded avionics that resist self-induced interference. Strike roles benefit from AI target verification, reducing fratricide risk and aligning with rules of engagement. Each new function increases airframe power draw, driving investment in next-gen generators and lightweight cooling loops.
Geography Analysis
North America captured 35.65% of 2024 global revenue, supported by sustained Department of Defense funding and the Replicator program. US export rules help regional suppliers secure allied sales, reinforcing the domestic industrial base. Asia-Pacific’s 9.48% CAGR reflects rapid capability build-ups; Taiwan’s 100,000-drone order spans reconnaissance and civil defense, establishing the world’s largest single program.[5] DIGITIMES Asia, “Taiwan Announces Historic Purchase of 100,000 Drones,” digitimes.com India fosters indigenous production, issuing tenders that include transfer-of-technology clauses to grow a local ecosystem.
Europe steps up through the ReArm initiative that channels EUR 800 billion (USD 934.49 billion) into defense by 2030. The European Defence Agency reports a 30% spending jump since 2021, with counter-UAS high on the list. Germany’s EUR 100 billion (USD 116.81 billion) rearmament and Greece’s USD 27 billion plan underline continental commitment. Middle East buyers like Qatar invest USD 2 billion in MQ-9Bs for coastal surveillance and partner these with Raytheon FS-LIDS defenses. Africa’s uptake remains smaller but focuses on border patrol drones to curb illicit flows. South America lags, with Brazil leading through technology-transfer partnerships that seed a nascent supply chain.
Regional dynamics influence feature priorities. Asian customers seek anti-jam resilience due to dense spectrum. European programs emphasize NATO interoperability, driving Link-16 upgrades. Middle East climates force suppliers to guarantee sensor cooling at 50°C ambient.

Competitive Landscape
Traditional primes and agile startups jostle for a share in the UAS warfare market. AeroVironment’s USD 4.1 billion merger with BlueHalo in May 2025 created a vertically integrated group spanning airframes, EW payloads, and satellite links, raising entry barriers for niche vendors. General Atomics added North Point Defense to secure RF engineering talent that feeds anti-jamming roadmaps. Redwire’s USD 925 million purchase of Edge Autonomy signals a space-to-air synergy vision, coupling small-sat relays with drones for resilient connectivity.
Strategy pivots toward autonomy rather than raw platform performance. Lockheed Martin demoed AI counter-drone suites while equipping F-35s to shepherd unmanned wingmen, blending legacy jets with emergent swarms. Northrop Grumman invests in open-architecture ground stations that lure customers through lifecycle cost savings. Supply-chain security shapes bids; US primes tout domestic microelectronics to sidestep Chinese restrictions. European integrators leverage the ReArm budget to market ITAR-free solutions, appealing to nations wary of export vetoes.
New entrants exploit white-space. Neros Technologies raised USD 35 million for FPV units compliant with BlueUAS rules.[6]StockTitan, “ZenaTech Launches Drone-As-A-Service for US Defense,” stocktitan.net ZenaTech positions Drone-as-a-Service subscriptions that bundle hardware, pilots, and analytics. Auterion’s USD 50 million kit deal with the Pentagon validates open-source autopilots at national-scale volumes. As consolidation progresses, mid-tier firms face a scale dilemma: ally with majors or specialize in ultraniche payloads like airborne chemical sensors. Capital flows favor teams that pair AI software with modular hardware, sustaining deal momentum through 2026.
UAS Warfare Industry Leaders
General Atomics
Northrop Grumman Corporation
BAYKAR A.S.
Israel Aerospace Industries Ltd.
AeroVironment Inc.
- *Disclaimer: Major Players sorted in no particular order

Recent Industry Developments
- August 2025: AeroVironment won a USD 990 million stand-off contract with the US DoD, underscoring confidence in long-range strike drones.
- July 2025: Auterion secured a USD 50 million Pentagon award for 33,000 AI-driven drone strike kits bound for Ukraine.
- July 2025: The US Air Force allocated USD 15.048 million to modify 142 F-22 cockpits for autonomous drone control, marking a manned-unmanned milestone.
- May 2025: Qatar signed a USD 3 billion package including USD 2 billion for MQ-9B Reapers and USD 1 billion for FS-LIDS defenses.


Global UAS Warfare Market Report Scope
| Fixed-Wing UAVs |
| Rotary-Wing UAVs |
| Hybrid-VTOL UAVs |
| Short-Range (Less than 50 km) |
| Medium-Range (50 to 200 km) |
| Long-Range (200 to 1,000 km) |
| Beyond-Line-of-Sight (Greater than 1,000 km) |
| Army |
| Air Force |
| Navy/Marine Corps |
| Special Operations Forces |
| Homeland Security and Law-Enforcement |
| Intelligence, Surveillance, and Reconnaissance (ISR) |
| Combat Strike/Loitering Munition |
| Electronic Warfare (EW) |
| Logistics and Resupply |
| North America | United States | |
| Canada | ||
| Mexico | ||
| Europe | United Kingdom | |
| France | ||
| Germany | ||
| Italy | ||
| Russia | ||
| Rest of Europe | ||
| Asia-Pacific | China | |
| India | ||
| Japan | ||
| South Korea | ||
| Australia | ||
| Rest of Asia-Pacific | ||
| South America | Brazil | |
| Rest of South America | ||
| Middle East and Africa | Middle East | Saudi Arabia |
| United Arab Emirates | ||
| Turkey | ||
| Rest of Middle East | ||
| Africa | South Africa | |
| Rest of Africa | ||
| By Platform | Fixed-Wing UAVs | ||
| Rotary-Wing UAVs | |||
| Hybrid-VTOL UAVs | |||
| By Range | Short-Range (Less than 50 km) | ||
| Medium-Range (50 to 200 km) | |||
| Long-Range (200 to 1,000 km) | |||
| Beyond-Line-of-Sight (Greater than 1,000 km) | |||
| By End User | Army | ||
| Air Force | |||
| Navy/Marine Corps | |||
| Special Operations Forces | |||
| Homeland Security and Law-Enforcement | |||
| By Application | Intelligence, Surveillance, and Reconnaissance (ISR) | ||
| Combat Strike/Loitering Munition | |||
| Electronic Warfare (EW) | |||
| Logistics and Resupply | |||
| By Geography | North America | United States | |
| Canada | |||
| Mexico | |||
| Europe | United Kingdom | ||
| France | |||
| Germany | |||
| Italy | |||
| Russia | |||
| Rest of Europe | |||
| Asia-Pacific | China | ||
| India | |||
| Japan | |||
| South Korea | |||
| Australia | |||
| Rest of Asia-Pacific | |||
| South America | Brazil | ||
| Rest of South America | |||
| Middle East and Africa | Middle East | Saudi Arabia | |
| United Arab Emirates | |||
| Turkey | |||
| Rest of Middle East | |||
| Africa | South Africa | ||
| Rest of Africa | |||


Key Questions Answered in the Report
What is the current value of the UAS warfare market?
The market totals USD 25.59 billion in 2025 and is projected to climb to USD 39.99 billion by 2030, advancing at a 9.34% CAGR..
Which segment is growing fastest within military drone platforms?
Hybrid-VTOL systems post the highest forecast growth at 11.45% CAGR through 2030.
How much market share does North America hold?
North America accounts for 35.65% of global revenue, reflecting strong US Department of Defense (DoD) investment.
Why are electronic-warfare drones gaining attention?
Militaries prioritize spectrum dominance, driving EW drone demand at a 10.65% CAGR to counter sophisticated radar and communications threats.
How will AI change UAS operations?
AI enables swarming, automated mission planning, and reduced operator workload, cutting per-mission costs and expanding fleet scale.
What challenges threaten market growth?
Spectrum congestion, counter-UAS proliferation, export-control regulations, and composite material shortages collectively temper the market CAGR by several percentage points.
Page last updated on:


