Defense Electronics Market Size and Share
Market Overview
| Study Period | 2019 - 2030 |
|---|---|
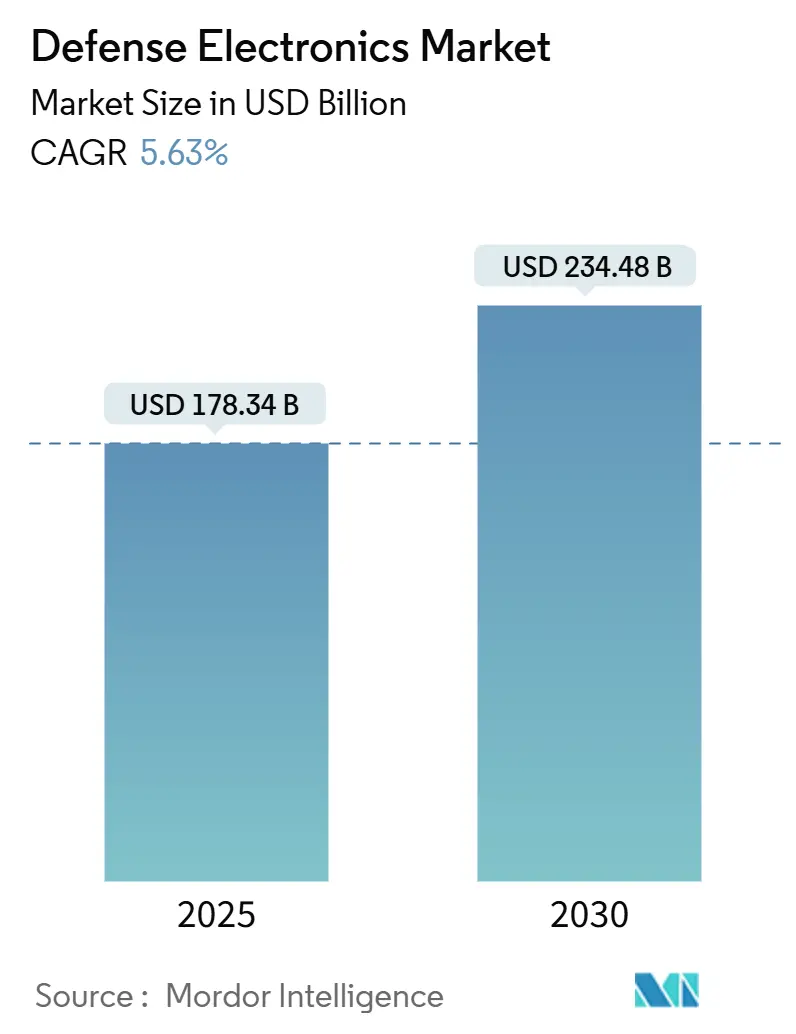
| Market Size (2025) | USD 178.34 Billion |
| Market Size (2030) | USD 234.48 Billion |
| Growth Rate (2025 - 2030) | 5.63% CAGR |
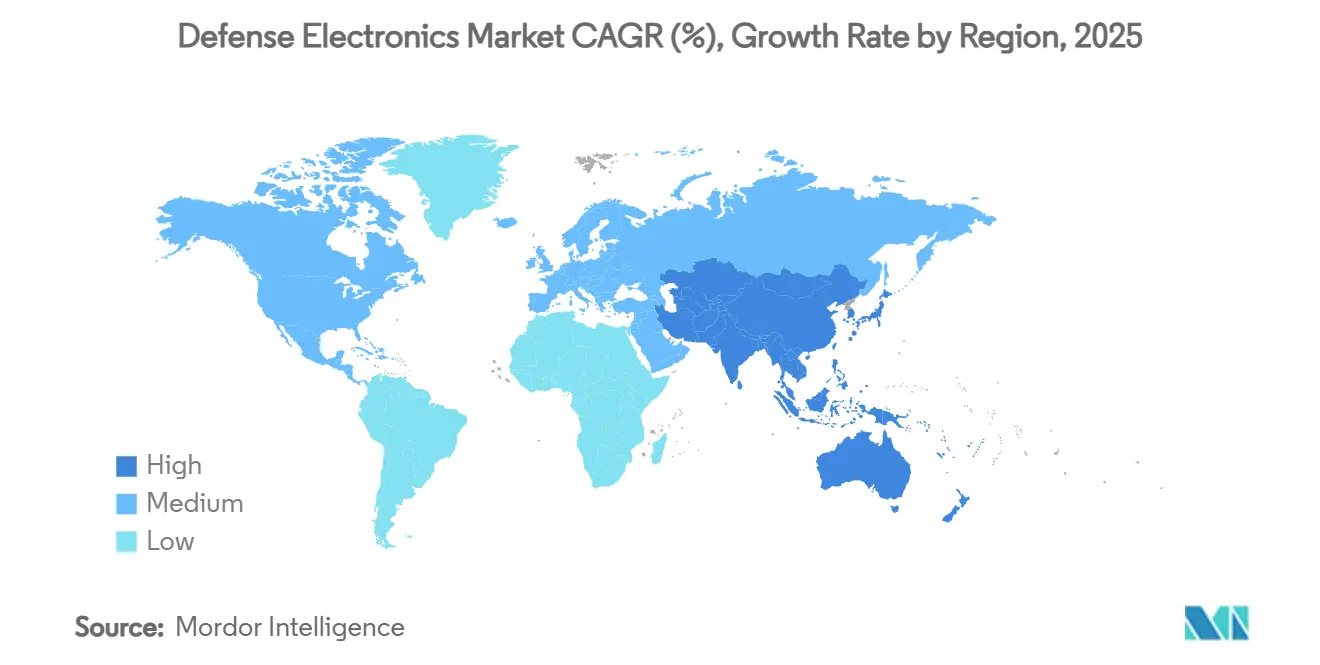
| Fastest Growing Market | Asia Pacific |
| Largest Market | North America |
| Market Concentration | Medium |
Major Players *Disclaimer: Major Players sorted in no particular order Image © Mordor Intelligence. Reuse requires attribution under CC BY 4.0. | |
Defense Electronics Market Analysis by Mordor Intelligence
The defense electronics market size is estimated at USD 178.34 billion in 2025 and is expected to reach USD 234.48 billion by 2030, translating into a 5.63% CAGR. Growth rests on multi-domain operations, rapid radar and sensor upgrades, AI-enabled edge systems, and public incentives that localize semiconductor production. Prime contractors expand vertically to secure critical sub-tier technologies, while mid-tier suppliers commercialize open architectures to capture retrofit demand. Sustained procurement for fighter and unmanned aircraft, space-based early-warning constellations, and hardened electronics for hypersonic weapons continues to shape opportunities. Regional spending accelerates as NATO allies backfill stocks and Asia-Pacific nations counterbalance Chinese military modernization.
Key Report Takeaways
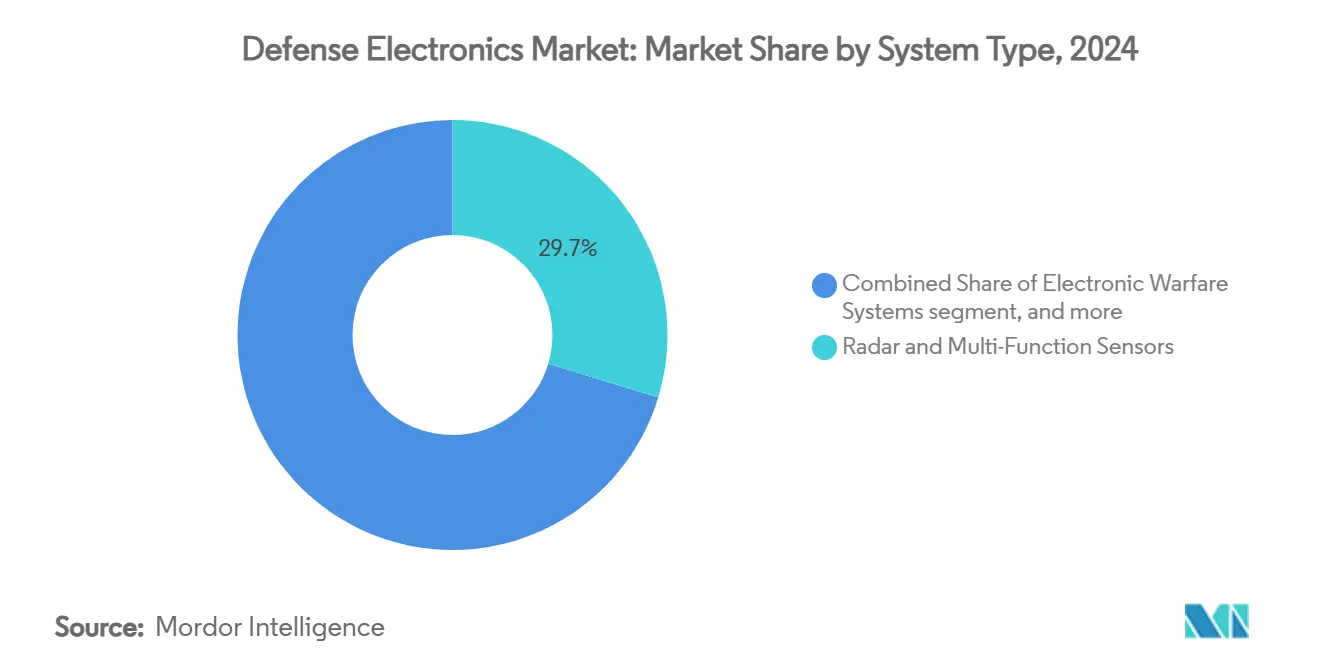
- By system type, radar and multi-function sensors led the defense electronics market with 29.67% of the share in 2024; electronic warfare systems are projected to advance at an 8.21% CAGR through 2030.
- By platform, airborne assets accounted for 44.21% of the defense electronics market size in 2024, while space platforms posted the highest 6.78% CAGR to 2030.
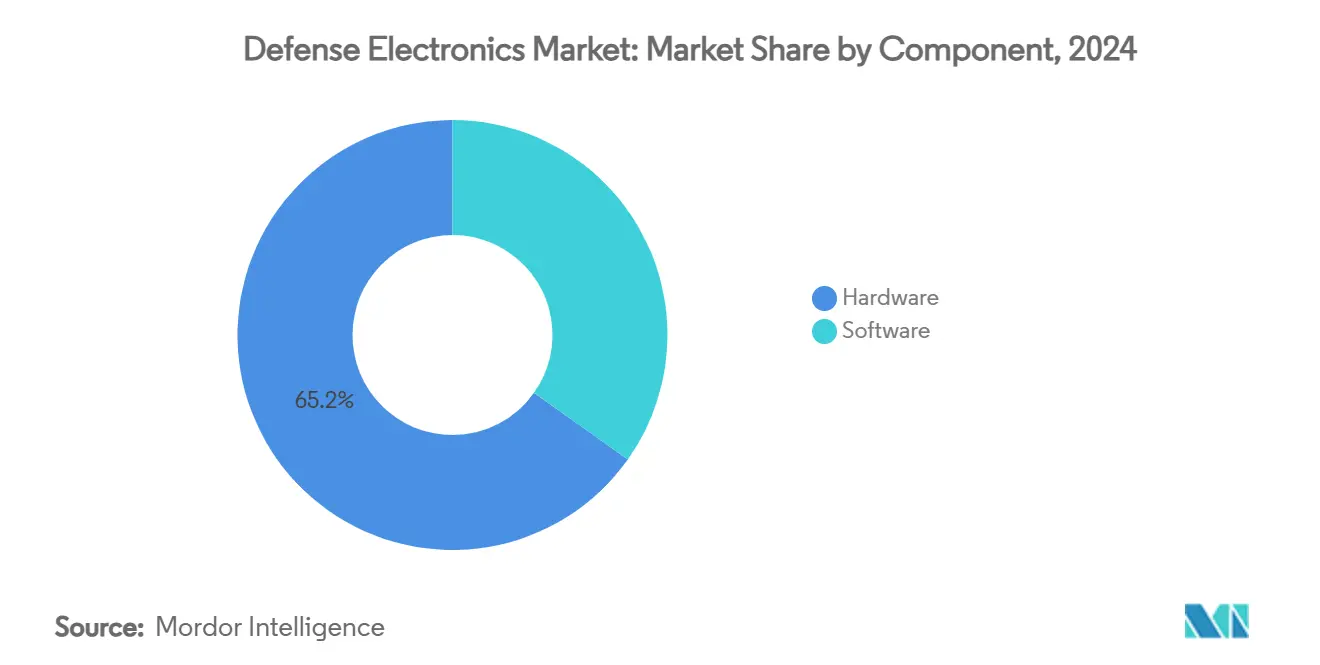
- By component, hardware captured a 65.18% share in 2024, whereas software is set to grow at a 6.25% CAGR.
- By fit, line-fit installations held a 61.77% share in 2024; retrofit applications expand faster at a 6.70% CAGR.
- By geography, North America dominated with a 38.35% share in 2024, and Asia-Pacific recorded the quickest 7.24% CAGR.
Global Defense Electronics Market Trends and Insights
Drivers Impact Analysis*
| Driver | (~) % Impact on CAGR Forecast | Geographic Relevance | Impact Timeline |
|---|---|---|---|
| Growing adoption of multi-domain operations as a strategic doctrine | +1.2% | Global – early uptake in North America and Europe | Medium term (2-4 years) |
| Acceleration of radar and AESA upgrade programs across legacy defense platforms | +0.8% | North America, Europe, Asia-Pacific | Short term (≤2 years) |
| Government incentives promoting localization of semiconductor supply chains | +0.6% | Core markets in North America, Europe, Asia-Pacific | Long term (≥4 years) |
| Integration of AI and machine learning into edge-based electronic warfare systems | +0.9% | Global – advanced deployment in North America and Europe | Medium term (2-4 years) |
| Breakthroughs in GaN-based power amplification technologies enhancing performance | +0.7% | Manufacturing centered in North America and Asia | Medium term (2-4 years) |
| Mandates for modular open-systems architectures improving interoperability and scalability | +1.1% | North America, NATO allies, emerging Asia-Pacific users | Long term (≥4 years) |
| Source: Mordor Intelligence | |||
Growing Adoption of Multi-Domain Operations as Strategic Doctrine
Multi-domain operations compel every service branch to connect sensors, shooters, and decision nodes into one information fabric, driving the defense electronics market toward interoperable, software-defined architectures. Demonstrations under the US Army Project Convergence and the Air Force Advanced Battle Management System proved that unified data links can shorten targeting cycles from minutes to seconds. NATO’s concept of multi-domain operations mirrors this urgency, prompting European nations to source radios, gateways, and AI decision aids that plug into allied networks. The Pentagon’s USD 6.9 billion hypersonic budget reinforces demand for electronics hardened against extreme heat and vibration. Interoperability demands also open doors for mid-tier suppliers specializing in open-standard hardware accredited under the Sensor Open Systems Architecture initiative. As more countries codify the doctrine, the defense electronics market sees long-tail demand for mesh networking, cloudless analytics, and cyber-resilient processors.
Acceleration of Radar and AESA Upgrade Programs Across Legacy Platforms
Active electronically scanned array retrofits remain the flagship upgrade path for fourth-generation fighters and ground surveillance radars. Lockheed Martin's 3DELRR trials showed tenfold reliability gains and triple detection range once GaN modules replaced TWT-based arrays.[1]Lockheed Martin, “3DELRR Program Advances,” lockheedmartin.com The F-16 Block 70/72 fleet represents over 300 aircraft slated for AESA conversions through 2030. European Typhoon and Rafale roadmaps mirror the emphasis, fueling bilateral projects that combine Thales, Leonardo, and HENSOLDT competencies. These block upgrades' revenue visibility provides anchor capital outlays within the defense electronics market, while follow-on maintenance contracts boost aftermarket margins. Electronic warfare enhancements ride the same wave because standard transmit-receive modules lower cost barriers for jammer pods co-installed with radars.
Government Incentives Promoting Localization of Semiconductor Supply Chains
The CHIPS and Science Act allocates USD 52 billion to reshore fabrication critical to the defense electronics market. Mercury Systems, for example, secured USD 8.5 million to engineer secure RF multi-chip packages suitable for extreme environments.[2]Mercury Systems, “DoD Awards Secure RF Package Contract,” mrcy.com Taiwan Semiconductor Manufacturing Company’s Arizona site includes dedicated “trusted” lines that accept US defense workloads, reducing exposure to geopolitical risk in the Taiwan Strait. Across the Atlantic, the European Chips Act channels EUR 43 billion (USD 50.60 billion) into regional fabs emphasizing GaN processes essential for high-power radar front ends. These incentives compress lead times and give Western primes more visibility over Tier-2 suppliers. Over the long term, they will also dilute cost advantages historically held by offshore foundries, recalibrating sourcing decisions across the defense electronics market.
Integration of AI and Machine Learning into Edge Electronic Warfare
Artificial intelligence (AI) enables cognitive jammers to identify, classify, and counter threats in under 250 milliseconds, a pace unachievable with rule-based logic. RTX joined forces with Shield AI to bake autonomous decision loops into loitering munitions and sensors, marking the first weapon family to fly with fully networked collaborative autonomy. DARPA’s SCEPTER effort uses AI simulation to compress new countermeasure development from months to hours. Northrop Grumman’s partnership with NVIDIA adds toolchains that allow rapid porting of algorithms onto rugged GPUs for field deployment. The drive to process at the edge, where satellite links are contested, elevates demand for low-size-weight-power modules and thermal management innovations, further expanding the defense electronics market.
Restraints Impact Analysis*
| Restraint | (~) % Impact on CAGR Forecast | Geographic Relevance | Impact Timeline |
|---|---|---|---|
| Stricter export control regulations on advanced radio frequency components | -0.4% | North America and Europe exports | Short term (≤2 years) |
| Ongoing shortage of skilled talent in RF and mixed-signal electronic design | -0.3% | Global – most acute in North America and Europe | Long term (≥4 years) |
| High cost of managing component obsolescence in long-life military systems | -0.5% | All major defense markets | Medium term (2-4 years) |
| Delays in cyber-hardening certification processes for mission-critical electronics | -0.2% | North America and NATO allies | Medium term (2-4 years) |
| Source: Mordor Intelligence | |||
Stricter Export Control Regulations on Advanced RF Components
Expanded US Commerce Control Lists restrict export of GaN power devices beyond 600 V breakdown, obliging primes to engineer separate variants for foreign sales, inflating non-recurring engineering costs. European Union dual-use rules impose similar burdens on ultra-wide-band jammers destined for non-NATO customers. Fragmented compliance stacks prolong licensing cycles, tempering near-term revenues within the defense electronics market. Suppliers respond by deepening domestic portfolios or partnering with local integrators to assemble kits inside recipient nations.
Ongoing Shortage of Skilled Talent in RF and Mixed-Signal Design
Universities graduate fewer than 2,000 RF engineers annually, while market demand tops 5,000 jobs, stretching project timelines and compensation budgets.[3]National Science Foundation, “Science and Engineering Indicators 2025,” ncses.nsf.gov Programs such as Mercury Systems’ apprentice pipeline ease gaps but cannot offset retirement cliffs expected from an aging specialist cohort. Asia-Pacific suppliers confront similar shortages, especially in compound-semiconductor epitaxy. Limited talent availability places a soft cap on how the defense electronics market can incorporate emerging technologies.
*Our forecasts treat driver/restraint impacts as directional, not additive. The impact forecasts reflect baseline growth, mix effects, and variable interactions.
Segment Analysis
By System Type: Radar Dominance Faces EW Disruption
Radar and multi-function sensors held 29.67% of the defense electronics market share in 2024, and remain indispensable for fire control and early warning. Electronic warfare systems, however, record the fastest 8.21% CAGR as modern threats require agile jamming and deception. The defense electronics market thus bifurcates between mature radar replacement cycles and emerging EW demand built on AI classifiers. C4ISR nodes grow steadily because multi-domain doctrines stress resilient communications, while optronics gain relevance for GPS-denied navigation.
Second-generation GaN amplifiers lift radar peak power by 40%, reducing platform counts for area coverage. Concurrently, cognitive EW pods migrate from narrowband barrage to adaptive waveforms, altering procurement priorities. Open-system back-ends let forces add new effects through software updates, reinforcing the shift toward algorithm-centric differentiation. As a result, hardware value pools stabilize while software and services accelerate within the defense electronics market.


By Platform: Space Acceleration Challenges Airborne Leadership
Airborne assets contributed 44.21% of the defense electronics market size. Yet space platforms grow at 6.78% CAGR on the back of missile-warning constellations and resilient SATCOM layers. The defense electronics market benefits as each small satellite hosts low-SWaP-C avionics, driving volume orders for rad-hard processors. Land systems regain investment emphasis in Eastern Europe, where counter-UAS radars and SAM networks proliferate.
Unmanned aircraft integration blurs the line between airborne and land categories because ground forces now field organic UAS with EW payloads. Naval demand stays steady, focused on surface combatant AESA retrofits that dovetail with collaborative targeting networks. The intensifying crossover among domains supports a unified acquisition approach, sustaining total spend even as platform mixes evolve.
By Component: Software Gains Ground on Hardware Dominance
Hardware maintained a 65.18% cut of 2024 revenue, yet software climbs 6.25% annually as mission packs switch to containerized apps. Mercury Systems’ Common Processing Architecture underpins this shift, letting operators inject new functionality via secure firmware loads. Utilities such as data fusion, automatic target recognition, and electronic order of battle mapping run atop standard VPX blades, trimming bespoke hardware content.
The defense electronics market still invests in high-frequency substrates, liquid-metal thermal conduction, and 3D packaging required for hypersonic vehicles, preserving hardware relevance. Even so, valuation multiples tilt toward software-heavy vendors because recurring licensing revenue outperforms one-time box sales. Over the forecast horizon, the component mix approaches parity as open middleware unlocks third-party innovation.
By Fit: Retrofit Momentum Reflects Budget Constraints
Line-fit programs generated 61.77% of 2024 revenue as new fighter and frigate builds embedded the latest electronics from day one. Retrofit demand grows 6.70% CAGR, riding cost-effective AESA and EW insertions for legacy fleets. The defense electronics market gains from standardized backplanes that slice integration times by 30%, enabling air forces to upgrade older jets within routine depot cycles.
Fiscal ceilings encourage commanders to stretch platform lifespans; retrofits become a quick win that sidesteps protracted development for replacement aircraft. Suppliers respond with kit-based solutions certified once and replicated across multiple nations, reinforcing economies of scale. The retrofit wave underlines how modular architectures reallocate spending toward electronics instead of structural airframes.
Geography Analysis
North America retains leadership by coupling the world’s largest defense budget with a mature industrial base that internalizes most high-end component production. The region also benefits from government-funded semiconductor fabs that reduce lead-time volatility and keep the defense electronics market resilient against external shocks. Canadian Arctic surveillance upgrades and NORAD digitalization widen demand for wide-aperture radars and secure data links.
Asia-Pacific posts the quickest expansion as China field-tests counter-stealth arrays and electronic counter-countermeasure suites, prompting Japan, South Korea, and Australia to co-develop next-generation jammers. India channels offset credits into local microwave monolithic integrated circuit fabs, anchoring supply chains inside its borders. Southeast Asian nations focus on coastal surveillance and counter-UAS gear, creating a cascade of small-lot procurements that aggregate into sizeable regional volume.
Europe accelerates modernization partly under NATO’s short-range air-defense gap analysis. Poland’s rapid F-16 AESA upgrades and Spain’s multi-band frigate radars showcase how EU members converge on common standards while still encouraging domestic participation. The European Defence Fund finances cross-border prototypes that emphasize open architectures, echoing MOSA principles embraced in the United States. This alignment fortifies interoperability in joint operations and increases total addressable value across the defense electronics market.

Competitive Landscape
Four primes—RTX Corporation, Lockheed Martin Corporation, Northrop Grumman Corporation, and BAE Systems plc—command a dominant slice of revenue. They integrate sensors, processors, and effectors under one roof and leverage captive semiconductor lines and sovereign export clearances to impose high entry barriers. L3Harris, HENSOLDT, and Mercury Systems defend niche leadership in tactical radios, passive radar, and secure processing. The defense electronics industry is witnessing a wave of vertical deals, exemplified by aerospace primes buying board-level specialists to control supply risk.
Technology convergence widens cooperation with commercial players. RTX’s tie-up with Shield AI extends autonomous swarm logic into defense portfolios. Northrop Grumman licenses NVIDIA AI to shorten algorithm training curves for airborne early-warning radars. Such collaborations shorten innovation cycles that traditional defense development once stretched over a decade. Simultaneously, export-control tightening nudges primes to establish local subsidiaries inside customer nations, forging co-production deals that distribute supply chains.
Competition intensifies in the software layer, where small and medium enterprises can secure contracts by offering specialty machine-learning models without owning fabs. Yet certification and cyber-hardening costs keep most of the partnering with primes rather than competing head-on. The net result is a concentrated but dynamic defense electronics market that rewards scale and agility.
Defense Electronics Industry Leaders
BAE Systems plc
RTX Corporation
Lockheed Martin Corporation
Thales Group
Northrop Grumman Corporation
- *Disclaimer: Major Players sorted in no particular order


Recent Industry Developments
- June 2025: The US Navy awarded Raytheon Technologies (RTX Corporation) a USD 646 million contract to continue the production of AN/SPY-6(V) radars, bringing the total number of radars under procurement to 42.
- March 2025: The Naval Sea Systems Command awarded Lockheed Martin Corporation a USD 54.2 million contract to manufacture submarine electronic warfare systems for new and operational submarines.


Global Defense Electronics Market Report Scope
| Radar and Multi-Function Sensors |
| Electronic Warfare Systems |
| C4ISR and Tactical Communications |
| Optronics and EO/IR Sensors |
| Avionics and Mission Computers |
| Defense Semiconductors and Power Modules |
| Airborne |
| Land |
| Naval |
| Space |
| Hardware |
| Software |
| Line-fit |
| Retrofit |
| North America | United States | |
| Canada | ||
| Mexico | ||
| Europe | United Kingdom | |
| France | ||
| Germany | ||
| Italy | ||
| Russia | ||
| Rest of Europe | ||
| Asia-Pacific | China | |
| India | ||
| Japan | ||
| South Korea | ||
| Australia | ||
| Rest of Asia-Pacific | ||
| South America | Brazil | |
| Argentina | ||
| Rest of South America | ||
| Middle East and Africa | Middle East | Saudi Arabia |
| United Arab Emirates | ||
| Rest of Middle East | ||
| Africa | South Africa | |
| Rest of Africa | ||
| By System Type | Radar and Multi-Function Sensors | ||
| Electronic Warfare Systems | |||
| C4ISR and Tactical Communications | |||
| Optronics and EO/IR Sensors | |||
| Avionics and Mission Computers | |||
| Defense Semiconductors and Power Modules | |||
| By Platform | Airborne | ||
| Land | |||
| Naval | |||
| Space | |||
| By Component | Hardware | ||
| Software | |||
| By Fit | Line-fit | ||
| Retrofit | |||
| By Geography | North America | United States | |
| Canada | |||
| Mexico | |||
| Europe | United Kingdom | ||
| France | |||
| Germany | |||
| Italy | |||
| Russia | |||
| Rest of Europe | |||
| Asia-Pacific | China | ||
| India | |||
| Japan | |||
| South Korea | |||
| Australia | |||
| Rest of Asia-Pacific | |||
| South America | Brazil | ||
| Argentina | |||
| Rest of South America | |||
| Middle East and Africa | Middle East | Saudi Arabia | |
| United Arab Emirates | |||
| Rest of Middle East | |||
| Africa | South Africa | ||
| Rest of Africa | |||


Key Questions Answered in the Report
What is the current size of the global defense electronics market?
The defense electronics market size is USD 178.34 billion in 2025 and is forecasted to hit USD 234.48 billion by 2030, reflecting a 5.63% CAGR.
Which region grows fastest in the defense electronics market through 2030?
Asia-Pacific records the quickest 7.24% CAGR, driven by Chinese modernization, Indian indigenous programs, and South Korean exports.
Which system segment leads the defense electronics market?
Radar and multi-function sensors hold 29.67% share in 2024, remaining the largest system category.
Why is retrofit activity rising in defense electronics?
Retrofit demand grows at 6.70% CAGR as militaries upgrade legacy fleets with AESA radars and EW suites to gain near-peer capability without buying new platforms.
How are open-systems architectures influencing supplier competition?
MOSA and SOSA standards let multiple vendors plug into common backplanes, shifting value toward software updates and lowering integration time, which spurs collaboration between primes and smaller tech firms.
Which companies dominate the defense electronics market?
RTX Corporation, Lockheed Martin Corporation, Northrop Grumman Corporation, Thales Group, and BAE Systems plc to dominate the market.
Page last updated on:


