Digital Shipyard Market Size and Share
Market Overview
| Study Period | 2019 - 2030 |
|---|---|
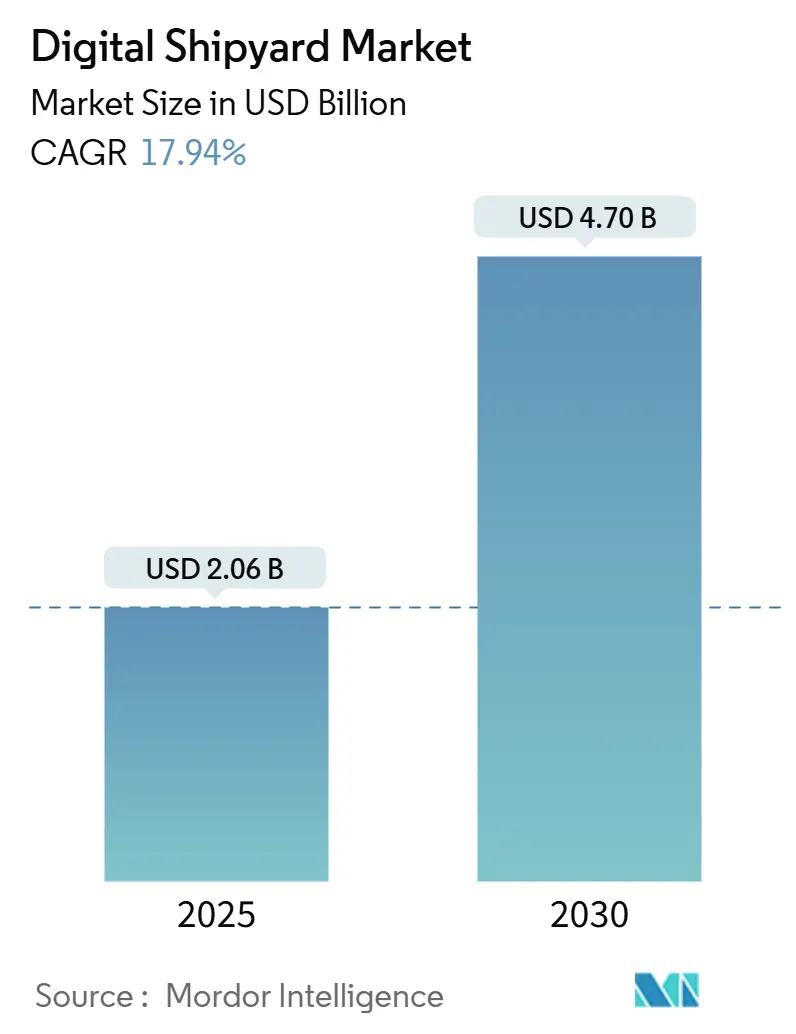
| Market Size (2025) | USD 2.06 Billion |
| Market Size (2030) | USD 4.70 Billion |
| Growth Rate (2025 - 2030) | 17.94% CAGR |
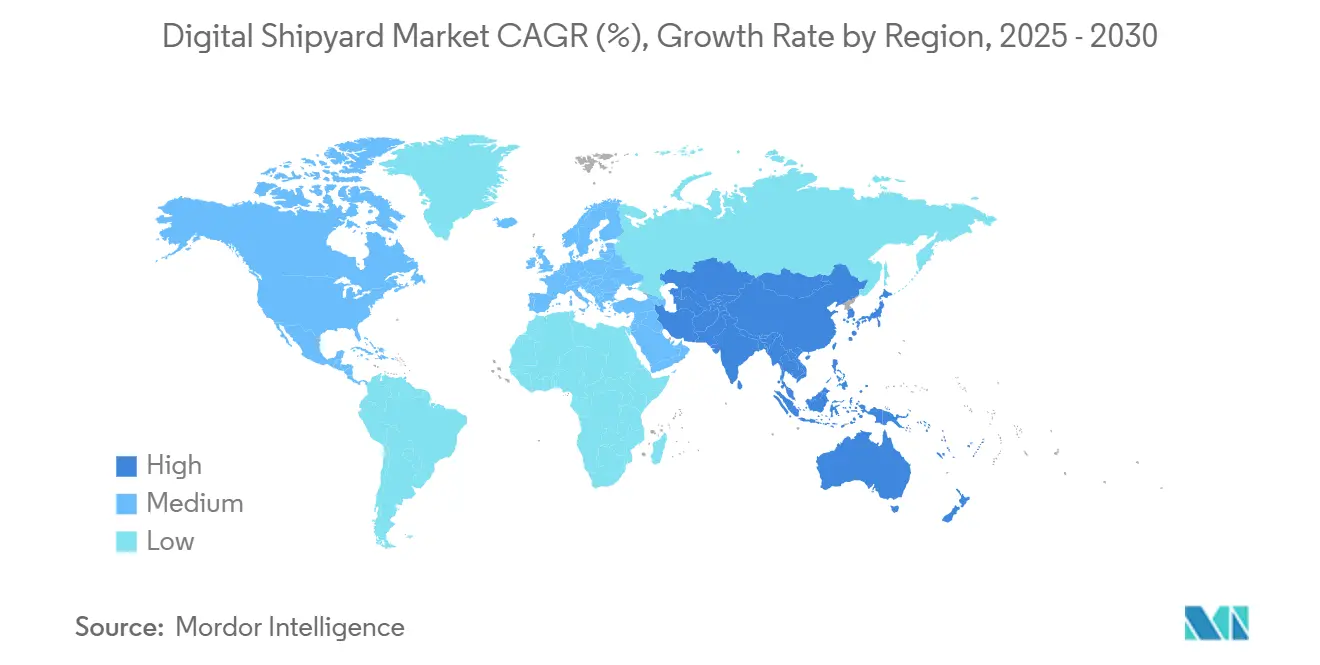
| Fastest Growing Market | Asia Pacific |
| Largest Market | North America |
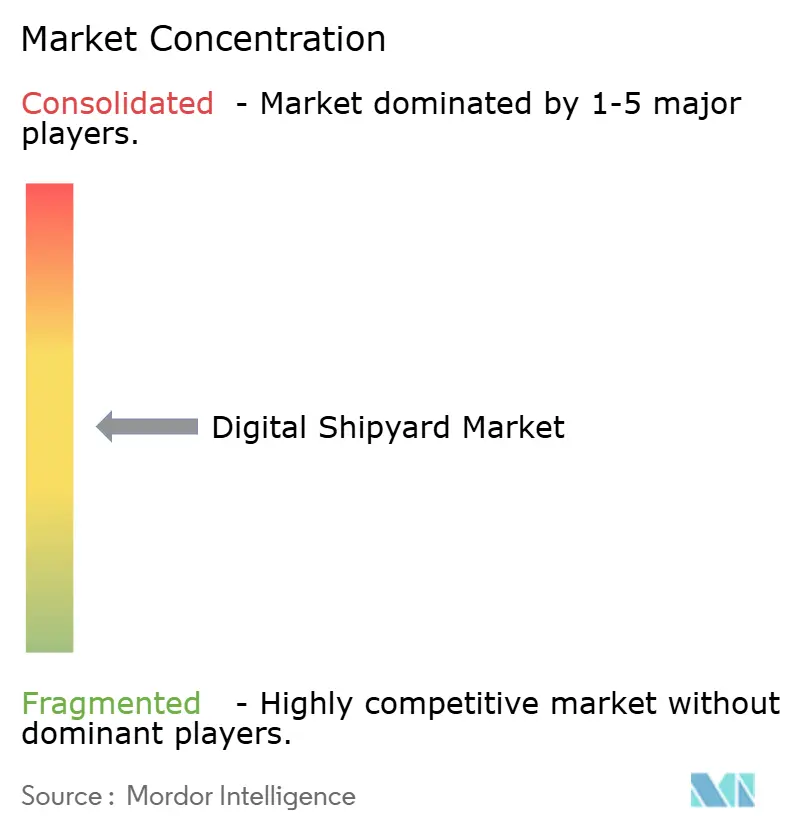
| Market Concentration | Medium |
Major Players *Disclaimer: Major Players sorted in no particular order Image © Mordor Intelligence. Reuse requires attribution under CC BY 4.0. | |
Digital Shipyard Market Analysis by Mordor Intelligence
The digital shipyard market size stands at USD 2.06 billion in 2025 and is forecasted to reach USD 4.7 billion by 2030, advancing at a 17.94% CAGR from 2025-2030. Intense regulatory pressure for decarbonization, a shrinking skilled labor pool, and rising cybersecurity concerns push yards to embrace Industry 4.0 solutions that deliver real-time visibility, shorter project cycles, and leaner workforces. North America leads revenue thanks to sustained defense funding and public-private modernization programs. Yet, Asia-Pacific is setting the innovation pace as Chinese and Korean yards scale digital-twin ecosystems that compress production time and boost quality. Digital twin platforms continue to anchor most smart-yard roadmaps. Still, blockchain-enabled cyber-physical security and VR-based training are the fastest-growing niches as operators confront data-integrity risks and talent shortages. Consolidation among top Asian builders gives them the capital to invest in end-to-end digital platforms. Western competitors create value in high-complexity, low-volume segments such as autonomous naval vessels.
Key Report Takeaways
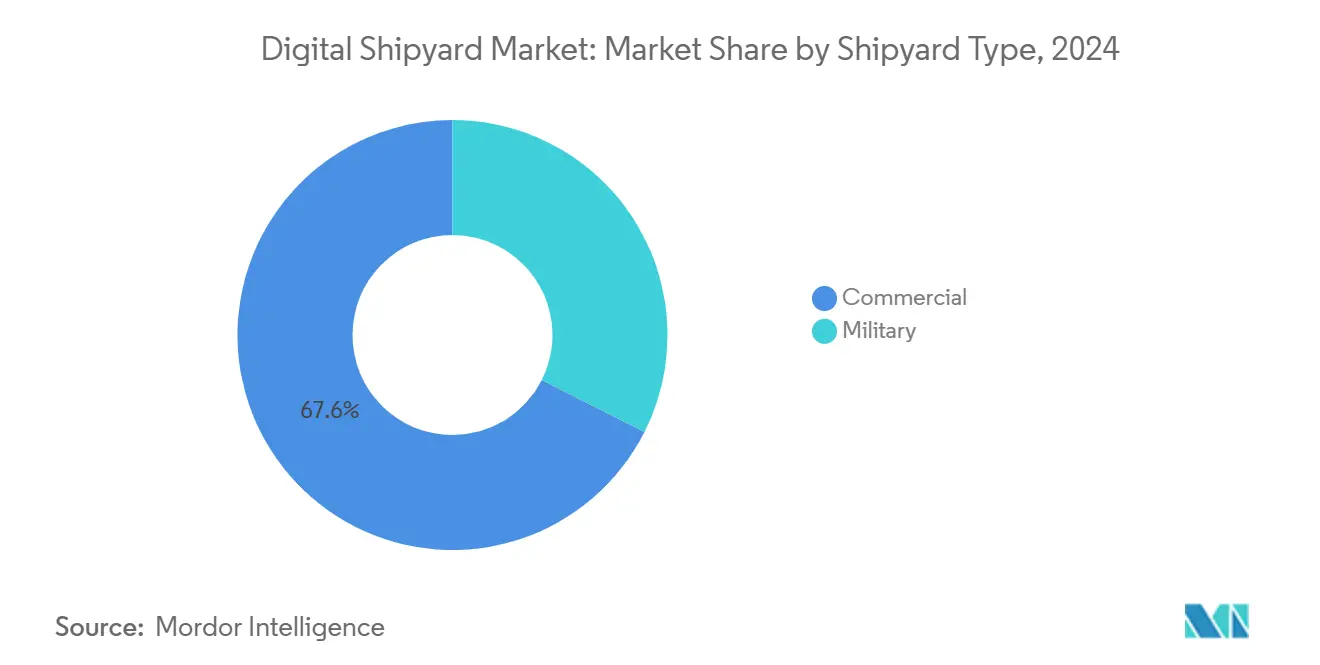
- By shipyard type, commercial yards held 67.56% of the digital shipyard market share in 2024, while military yards are projected to expand at an 18.91% CAGR through 2030.
- By technology, digital twin platforms captured 39.86% share of the digital shipyard market size in 2024, whereas blockchain and cyber-physical security solutions are forecasted to grow at a 19.24% CAGR to 2030.
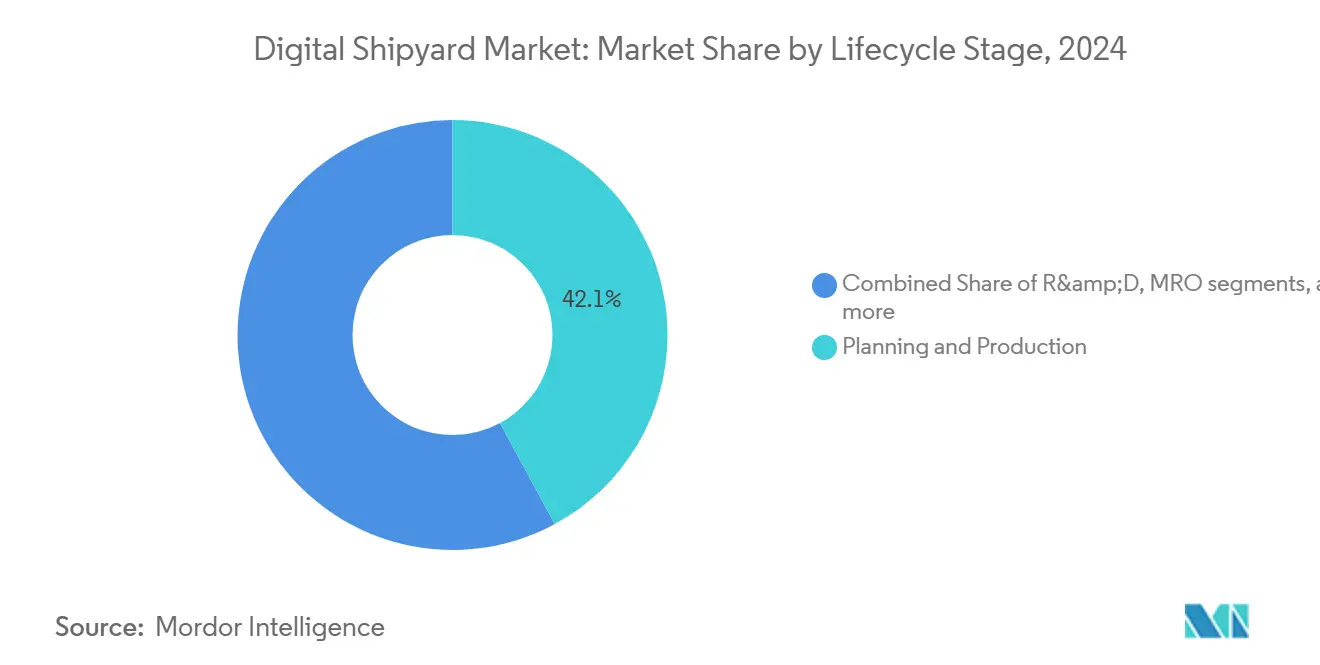
- By lifecycle stage, planning and production controlled 42.11% of the digital shipyard market size in 2024, but the training and simulation segment is advancing at a 20.43% CAGR during the same period.
- By end-user, private shipyard operators accounted for 48.28% of the digital shipyard market size in 2024, whereas defense ministries represent the fastest-growing group with an 18.27% CAGR through 2030.
- By geography, North America commanded a 39.29% share in 2024; Asia-Pacific is on track for the quickest expansion, with a 19.80% CAGR to 2030.
Global Digital Shipyard Market Trends and Insights
Drivers Impact Analysis*
| Driver | (~) Impact on CAGR Forecast | Geographic Relevance | Impact Timeline |
|---|---|---|---|
| Rapid fleet renewal cycles | +3.20% | Asia-Pacific and Europe | Medium term (2-4 years) |
| Shortage of skilled welders/aging workforce | +2.80% | North America and Europe; developed APAC | Short term (≤ 2 years) |
| Stringent IMO decarbonization mandates | +2.10% | Global; early pressure in EU | Long term (≥ 4 years) |
| Shipyard “digital twin tax-credits” in Korea and China | +1.40% | Korea and China | Medium term (2-4 years) |
| Surge in subsea-robot repair contracts | +1.10% | North America and Europe; expanding APAC | Medium term (2-4 years) |
| State-backed mega-yard capacity expansions in China and Southeast Asia | +1.80% | Asia-Pacific | Long term (≥ 4 years) |
| Source: Mordor Intelligence | |||
Rapid fleet renewal cycles
Owners now demand faster build schedules that meet stricter energy rules introduced under the EU FuelEU Maritime regulation, which targets up to an 80% greenhouse-gas intensity drop by 2050.[1]European Commission, “Decarbonising Maritime Transport – FuelEU Maritime,” ec.europa.eu Digital design suites, automated cutting lines, and real-time production analytics allow yards to iterate alternative-fuel configurations rapidly and validate designs without full-scale prototypes. The US Navy completed digital twins for all four public yards, cutting design-verification loops and proving that virtual modeling can slash time-to-keel by months. Classification bodies such as ABS now grant 3D model-based class approvals that shorten review cycles by up to 25%, further trimming schedules. As more financiers peg charter rates to decarbonization milestones, builders embracing digital validation stand to win backlog share quickly. Consequently, the digital shipyard market is increasingly evaluated on its ability to compress the concept-to-launch cycle while meeting net-zero trajectories.
Shortage of skilled welders/aging workforce
Retirements are outpacing new entrants, leaving US yards unfilled vacancies and prompting the Coast Guard to reschedule deliveries. Collaborative robots introduced at HD Hyundai’s Samho site target a 30% production-time cut by 2030, allowing newer staff to operate complex weld programs with minimal upskilling. Hanwha Ocean’s recruitment of mid-career women welders shows how demographic realities push inclusive staffing models supported by automation. US Navy–funded initiatives, such as the Michigan Maritime Manufacturing Initiative, blend VR training with hands-on practice to accelerate competency gains. As automation and AR support spread, the digital shipyard market refines labor constraints into catalysts for robot-human collaboration.
Stringent IMO decarbonization mandates
The 2024 tightening of the Carbon Intensity Indicator raised the commercial stakes for real-time emissions monitoring. Samsung Heavy received the first blockchain Statement of Fact for autonomous-ship data, proving immutable logs satisfy regulators and charterers. The EU Emissions Trading System now applies to oceangoing vessels, pushing shipyards to integrate sensor arrays and analytics at the build stage so owners can manage allowance costs. Fincantieri’s AI-driven digital twins aim to hit net-zero by 2035, turning compliance into a marketing tool. With green premiums emerging, builders who embed resilient digital infrastructure gain a pricing edge that fuels the digital shipyard market.
Shipyard digital-twin tax credits in Korea and China
Seoul’s USD 150 billion shipbuilding package earmarks capital for smart-yard conversions, linking fiscal relief to adoption metrics such as digital twin coverage. Beijing’s dominance of new-build orders reflects subsidized rollouts of simulation-driven workshops that scale output without proportional labor increases. Siemens PLM helped Hyundai create the first full digital-yard environment, showing how credit schemes de-risk high-capex transformations. Western navies now weigh supply-chain exposure risks as advanced capabilities cluster in Northeast Asia. The resulting geographic skew will shape sourcing decisions and sustain Asia-Pacific’s lead in the digital shipyard market.
Restraints Impact Analysis*
| Restraint | (~) Impact on CAGR Forecast | Geographic Relevance | Impact Timeline |
|---|---|---|---|
| Cyber-security vulnerabilities | −2.3% | Global; acute in defense | Short term (≤ 2 years) |
| High CAPEX for brownfield yard retrofits | −1.8% | North America and Europe | Medium term (2-4 years) |
| Shortage of class-approved 5G/ORAN networks quayside | −1.2% | Asia-Pacific focus; global spillover | Medium term (2-4 years) |
| Export-credit insurance gaps for “smart yard” equipment | −1.0% | Western navies and commercial owners | Long term (≥ 4 years) |
| Source: Mordor Intelligence | |||
Cyber-security vulnerabilities
Connected yards span OT, IT, and cloud layers, exposing new attack surfaces that can jeopardize safety and national security. Nearly 71% of maritime professionals acknowledge elevated cyber risk, yet incident tracking and workforce readiness lag behind threat velocity.[2]Li, Meixuan et al., “Maritime Cybersecurity Review,” arxiv.org Mandatory IACS cyber-resilience rules (UR E26/E27) took effect in July 2024, pushing builders to embed protective controls across design, build, and commissioning workflows. A 2025 GAO audit flagged gaps in Coast Guard oversight, eroding stakeholder confidence and slowing digital procurement cycles.[3]US Government Accountability Office, “Cybersecurity Risks to Maritime Transportation System,” gao.gov Given that 95% of US cargo moves by sea, disruptions could cascade throughout the economy, prompting conservative rollouts that temper the digital shipyard market’s near-term growth. Vendors offering end-to-end encrypted architectures and zero-trust frameworks are now critical partners for program offices aiming to unlock project funding.
High CAPEX for brownfield yard retrofits
Fincantieri spent USD 100 million modernizing Marinette, cutting rework by half but highlighting the steep entry ticket for legacy sites.[4]Maritime Executive, “Marinette Cuts Costs, Boosts Performance,” maritime-executive.com McKinsey notes that many US yards struggle to self-finance digital tooling, slowing national capacity expansion. European SMEs in the Mari4_YARD program found that integrating robotics and AR demanded extensive floor-plan revisions and operator retraining, often beyond original budgets. Private-equity interest offers an alternate path, yet raises questions about technology-transfer control and long-term asset stewardship. Until financing models mature, retrofit economics will constrain the digital shipyard market, especially in regions with older facilities.
*Our forecasts treat driver/restraint impacts as directional, not additive. The impact forecasts reflect baseline growth, mix effects, and variable interactions.
Segment Analysis
By Shipyard Type: Military Drives Digital Innovation
The military segment has a smaller revenue base but is expanding faster than commercial yards, posting an 18.91% CAGR as navies fund cyber-hardened production lines. Military programs demand rigorous digital-twin validation and additive manufacturing capabilities to meet austere deployment timelines. The US Navy’s completion of yard-wide twins illustrates how defense procurement accelerates adoption curves across simulation, AI scheduling, and automated NDT inspection, setting benchmarks later adopted by commercial builders. Commercial yards still dominate volumes, comprising 67.56% of 2024 global revenue, but they increasingly borrow defense-grade solutions as regulatory and client requirements converge. This cross-pollination strengthens the digital shipyard market as innovations migrate bidirectionally.
Strategic overlap is evident in BlueForge Alliance’s “Warp Speed for Warships,” where Palantir’s AI work-order engine optimizes nuclear-sub and merchant-ship block builds. As navy-driven standards spill into commercial RFQs, suppliers gain scale, supporting price drops that widen accessibility. The outcome is a virtuous cycle: defense funding de-risks technology, commercial scale trims unit cost, further propelling the digital shipyard market.


By Technology: Blockchain Emerges as Security Imperative
Digital twin platforms remained the backbone, holding 39.86% revenue. Yet, blockchain and cyber-physical security tools are climbing swiftly at 19.24% CAGR as yards seek tamper-proof data trails for autonomous navigation and emissions audits. Samsung Heavy’s blockchain validation of autonomous-ship telemetry underscores growing assurance demands; immutable ledgers now underpin classification documents and charter contracts. IIoT sensor swarms feed these ledgers, enabling anomaly detection across welding robots and paint booths. VR/AR training suites, like Navantia’s HoloLens deployment, cut onboarding time and slash error rates, supporting robust lifecycle analytics. Additive manufacturing milestones—Newport News’ 3D-printed manifold for CVN-80—signal a pivot toward onsite part production that reduces spares logistics and extends platform availability. Integrated stacks that fuse simulation, blockchain, and AM thus deliver compounded productivity, reinforcing the digital shipyard market’s superior ROI.
By Lifecycle Stage: Training Revolution Accelerates
Planning and production continue as spending anchors, absorbing 42.11% of outlays. Yet, the training and simulation segment is expanding at 20.43% CAGR, reflecting acute demographic pressures. HD Hyundai’s Michigan partnership illustrates how VR curricula elevate novices to journeyman-level productivity in months rather than years. Fincantieri’s Maestri del Mare pairs AR headsets with digital SOPs to preserve tacit knowledge, cutting mentor-dependent hours by double digits. As predictive-maintenance twins extend into service life, training loops widen to include fleet crews and yard technicians, creating new SaaS revenue paths inside the digital shipyard market.

By End-user: Defense Ministries Lead Innovation Adoption
Private operators generated 48.28% of 2024 revenue, fueled by liner groups such as CMA CGM investing USD 20 billion in US assets, including a Boston automation R&D hub. Still, defense ministries are the fastest risers at 18.27% CAGR as navies recapitalize fleets under contested-sea doctrines. C3 AI’s deployment at HII yards demonstrates how defense customers seed AI adoption that later diffuses to commercial yards seeking similar throughput gains. Government yards secure budget continuity and policy alignment, accelerating multi-year digital roadmaps; yet private yards are closing the gap by leveraging logistics optimization and alternative-fuel retrofits, keeping the digital shipyard market highly dynamic.
Geography Analysis
North America’s digital shipyard market size leadership stems from multi-billion-dollar naval programs that mandate data-centric production. Yard-wide twins, AI-assisted scheduling, and additive-manufactured spares underpin schedule risk reduction for Columbia-class submarines and Constellation-class frigates. The region further benefits from South Korean capital injections earmarked for smart-yard deployments, expanding the supplier base for robotics and cyber-tools. Canada’s Davie investment into US yards accelerates knowledge transfer, while Mexico’s inclusion in supply chains hints at broader regional integration under the USMCA. These collaborations fortify North America’s installed base, ensuring continued dominance in high-spec naval and specialized commercial vessels.
Asia-Pacific delivers the fastest CAGR, leveraging state subsidies and capacity expansions that are purpose-built for digital operations. China’s massive order backlog enables continuous improvement loops where machine-learning algorithms refine weld-sequence optimization daily. Korea’s blockchain-certified autonomous-ship data streams exemplify its pivot toward cyber-secured production ecosystems. Japan’s participation in Australia’s USD 10 billion frigate program extends digital transfer mechanisms across the region, complementing India’s mega-cluster initiative that earmarks INR 25,000 crore (USD 2.86 million) for smart-yard infrastructure. Singapore’s electric-harbor-craft mandate spawns a niche for digital charging networks and vessel-performance analytics, reinforcing Southeast Asia’s smart-yard momentum.
Europe’s growth path is disciplined by green regulation. FuelEU Maritime compels builders to embed sensor grids and AI control loops that verify lifecycle emissions, benefiting German automation integrators. Fincantieri’s alliance with Accenture to digitize ports and yards reveals how legacy firms are future-proofing assets through cloud-native platforms. Norwegian yards specialize in autonomous offshore service vessels, leveraging harsh-environment digital twins to capture premium contracts. United Kingdom investments in naval composites and digital-first design flows further enhance regional expertise. Although geopolitical frictions limit Russian technology access, continental collaboration sustains Europe’s role as a technology influencer within the digital shipyard market.

Competitive Landscape
Market concentration is moderate: Chinese-Korean conglomerates hold roughly 46% of global capacity, allowing pooled R&D budgets that fund yard-level AI orchestration and massive sensor deployments. Western firms therefore differentiate via complexity leadership, emphasizing modular reactor blocks, advanced composites, and classified cyber designs. Samsung Heavy and HD Hyundai integrate blockchain-secured networks across design, procurement, and production, enhancing traceability and compliance.
Fincantieri leverages 3D model approvals to shorten design loops, renewing mid-tier European yards' competitiveness. Disruptors such as Palantir and C3 AI supply AI-driven MES layers that overlay heterogeneous shop-floor machinery, allowing legacy yards to leapfrog to predictive scheduling without forklift upgrades. As autonomous-ship demand matures, niche builders with digital-first yards could erode incumbent share, keeping rivalry constructive and innovation velocity high within the digital shipyard market.
Digital Shipyard Industry Leaders
Dassault Systèmes S.E.
Siemens AG
AVEVA Group Limited
Hexagon AB
Wärtsilä Corporation
AVEVA Group Limited (Schneider Electric SE)
- *Disclaimer: Major Players sorted in no particular order

Recent Industry Developments
- June 2025: HII joined C3 AI to scale predictive analytics tools across Newport News and Ingalls, improving carrier module schedule adherence.
- June 2025: Mitsubishi Shipbuilding and Elomatic formed a pact to co-develop digital-ready green vessel designs.
- March 2025: CMA CGM committed USD 20 billion over four years to US maritime assets, including a Boston robotics R&D hub.
- February 2025: A US consortium announced a next-gen shipyard tailored for autonomous vessels, signaling dedicated infrastructure for unmanned platforms.


Global Digital Shipyard Market Report Scope
| Commercial |
| Military |
| Digital Twin Platforms |
| IIoT and Sensor Networks |
| AR/VR and Mixed Reality |
| Additive Manufacturing |
| Blockchain and Cyber-Physical Security |
| Research and Development (R&D) |
| Design and Engineering |
| Planning and Production |
| Maintenance, Repair, and Overhaul (MRO) |
| Training and Simulation |
| Private Shipyard Operators |
| Government/State-owned Yards |
| Defense Ministries |
| North America | United States | |
| Canada | ||
| Mexico | ||
| Europe | United Kingdom | |
| Germany | ||
| Norway | ||
| Italy | ||
| Russia | ||
| Rest of Europe | ||
| Asia-Pacific | China | |
| India | ||
| Japan | ||
| South Korea | ||
| Australia | ||
| Rest of Asia-Pacific | ||
| South America | Brazil | |
| Rest of South America | ||
| Middle East and Africa | Middle East | Turkey |
| Saudi Arabia | ||
| Rest of Middle East | ||
| Africa | South Africa | |
| Rest of Africa | ||
| By Shipyard Type | Commercial | ||
| Military | |||
| By Technology | Digital Twin Platforms | ||
| IIoT and Sensor Networks | |||
| AR/VR and Mixed Reality | |||
| Additive Manufacturing | |||
| Blockchain and Cyber-Physical Security | |||
| By Lifecycle Stage | Research and Development (R&D) | ||
| Design and Engineering | |||
| Planning and Production | |||
| Maintenance, Repair, and Overhaul (MRO) | |||
| Training and Simulation | |||
| By End-user | Private Shipyard Operators | ||
| Government/State-owned Yards | |||
| Defense Ministries | |||
| By Geography | North America | United States | |
| Canada | |||
| Mexico | |||
| Europe | United Kingdom | ||
| Germany | |||
| Norway | |||
| Italy | |||
| Russia | |||
| Rest of Europe | |||
| Asia-Pacific | China | ||
| India | |||
| Japan | |||
| South Korea | |||
| Australia | |||
| Rest of Asia-Pacific | |||
| South America | Brazil | ||
| Rest of South America | |||
| Middle East and Africa | Middle East | Turkey | |
| Saudi Arabia | |||
| Rest of Middle East | |||
| Africa | South Africa | ||
| Rest of Africa | |||


Key Questions Answered in the Report
How large is the digital shipyard market in 2025 and what CAGR is forecast through 2030?
The market stands at USD 2.06 billion in 2025 and is projected to grow at a 17.94% CAGR, reaching USD 4.7 billion by 2030.
Which region is growing fastest in smart shipyard adoption?
Asia-Pacific is expected to post a 19.80% CAGR through 2030, led by China and South Korea.
Which technology segment is expanding most rapidly?
Blockchain and cyber-physical security tools are forecasted to grow at a 19.24% CAGR as data-integrity demands rise.
Why are training and simulation budgets increasing so quickly?
VR/AR platforms help offset skilled-labor shortages by speeding up worker competency, driving a 20.43% CAGR in this lifecycle stage.
What is the biggest restraint to digital shipyard upgrades?
High CAPEX for retrofitting legacy yards remains a key barrier, especially in North America and Europe.
What is the main financial hurdle for older Western yards?
High upfront costs for integrating digital systems into legacy facilities remain a key barrier to modernization.
Page last updated on:


