Market Overview
| Study Period | 2020 - 2031 |
|---|---|
| Forecast Data Period | 2026 - 2031 |
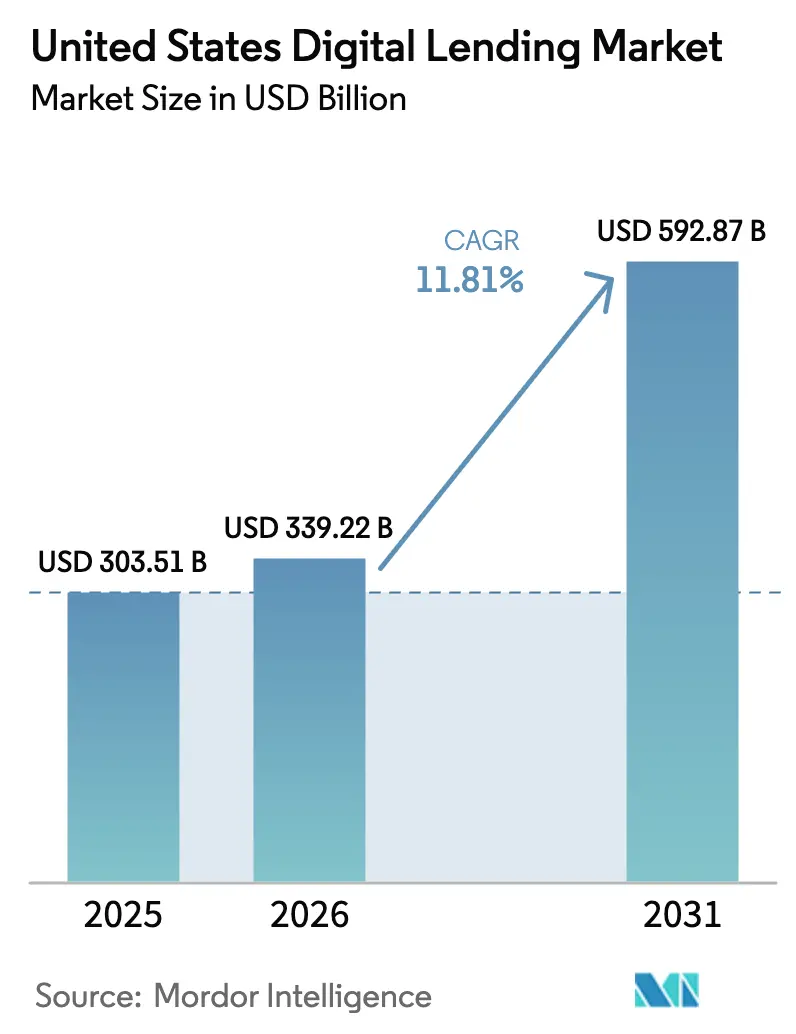
| Base Year Market Size (2025) | USD 303.51 Billion |
| Market Size (2026) | USD 339.22 Billion |
| Market Size (2031) | USD 592.87 Billion |
| Growth Rate (2026 - 2031) | 11.81% CAGR |
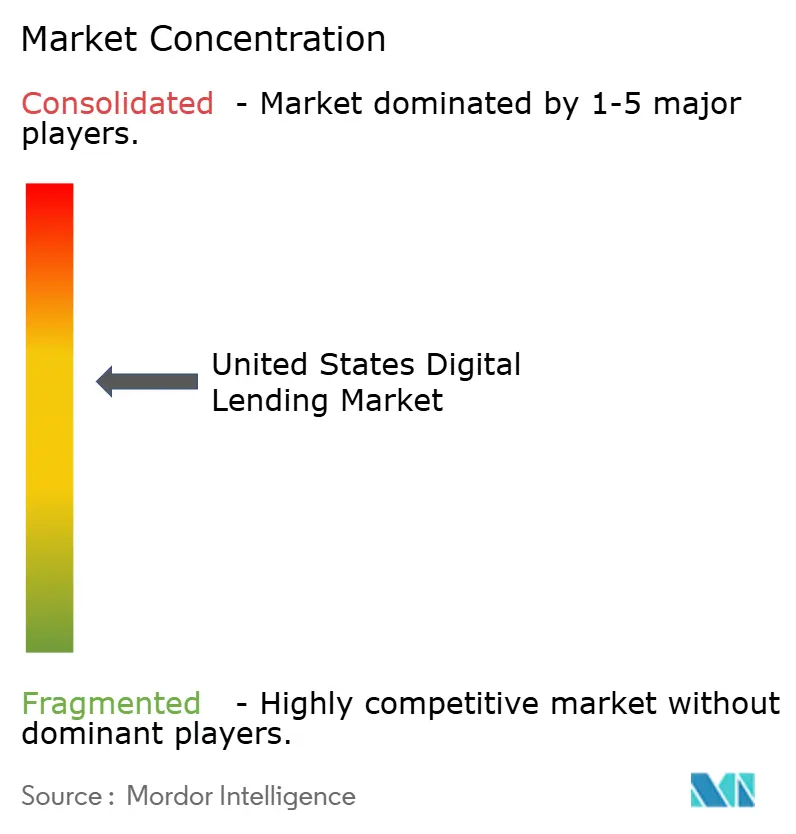
| Market Concentration | Medium |
Major Players *Disclaimer: Major Players sorted in no particular order Image © Mordor Intelligence. Reuse requires attribution under CC BY 4.0. | |
United States Digital Lending Market Analysis by Mordor Intelligence
The United States Digital Lending Market size was valued at USD 303.51 billion in 2025 and is estimated to grow from USD 339.22 billion in 2026 to reach USD 592.87 billion by 2031, at a CAGR of 11.81% during the forecast period (2026-2031). This trajectory reflects the convergence of instant-payment infrastructure, AI-powered underwriting and embedded lending that integrates credit directly inside vertical software platforms where borrowers already transact. The launch of the Federal Reserve’s FedNow Service in 2023 enabled same-day disbursements, pushing lenders to compete on speed rather than price. Marketplace, neobank and embedded-finance entrants now deploy alternative data to price risk, widening access for thin-file borrowers while simultaneously elevating fraud-management requirements. Regulatory fragmentation across states raises compliance costs and shapes lender expansion strategies, yet capital flows remain robust as investors chase high-yield consumer and SME assets. Competitive intensity is rising, with banks lowering funding costs through deposit franchises and fintechs differentiating on user experience, underwriting and distribution.
Key Report Takeaways
- By borrower type, consumer borrowers controlled 78.12% of 2025 originations of the US digital lending market, while business lending is forecast to expand at a 13.23% CAGR through 2031.
- By provider type, traditional banks held a 46.31% share in 2025, whereas embedded-finance platforms are advancing at a 12.56% CAGR to 2031.
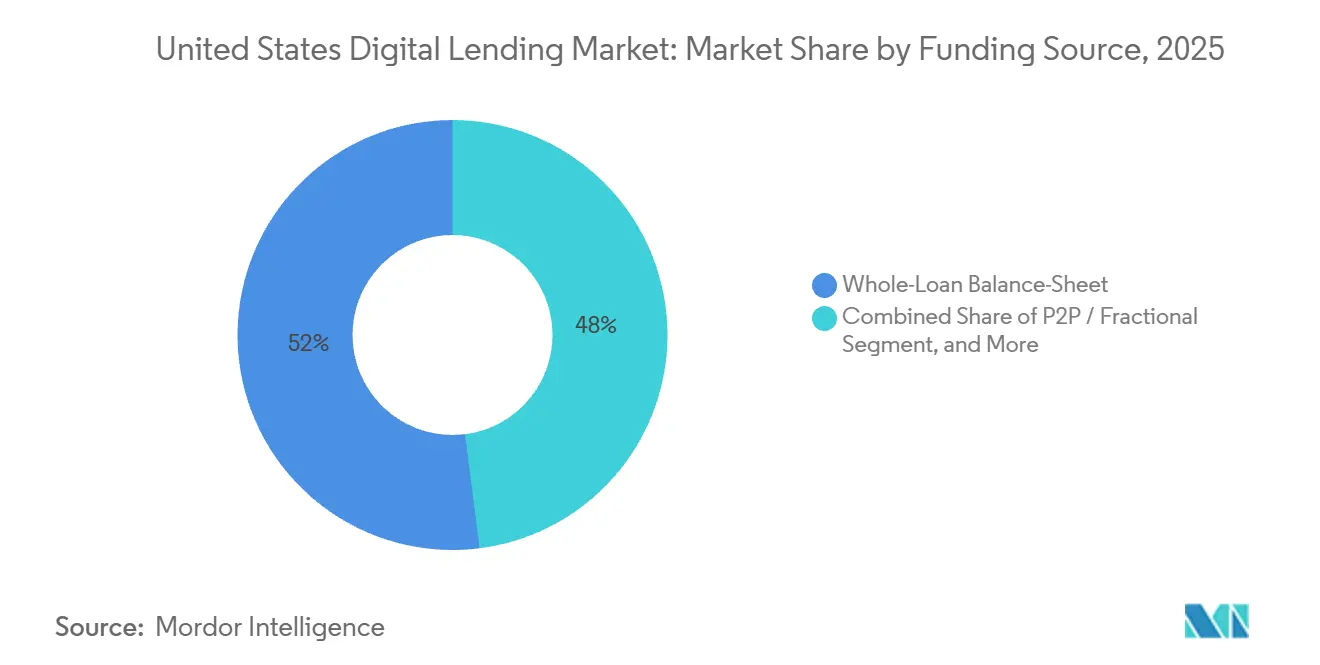
- By funding source, whole-loan balance-sheet funding accounted for 52.01% share of the US digital lending market in 2025, yet peer-to-peer and fractional models are growing at 13.41% annually.
- By loan purpose, personal installment loans accounted for 37.51% of 2025 originations, and medical financing is accelerating at a 14.62% CAGR through 2031.
Note: Market size and forecast figures in this report are generated using Mordor Intelligence’s proprietary estimation framework, updated with the latest available data and insights as of January 2026.
United States Digital Lending Market Trends and Insights
Drivers Impact Analysis*
| Driver | (~) % Impact on CAGR Forecast | Geographic Relevance | Impact Timeline |
|---|---|---|---|
| Uptick of Digitally-Savvy Borrowers | +2.1% | Global, with concentration in West and Northeast urban corridors | Medium term (2-4 years) |
| Growth in Disposable Income and Credit Demand | +1.8% | Southeast and Southwest, driven by population migration | Medium term (2-4 years) |
| Near-Instant, Mobile-First Origination Times | +2.3% | National, accelerated by FedNow rails in metropolitan areas | Short term (≤ 2 years) |
| AI-Driven Alternative-Data Credit Scoring | +2.0% | National, with early adoption by marketplace and embedded lenders | Medium term (2-4 years) |
| Embedded Lending inside Vertical SaaS Platforms | +1.9% | National, concentrated in e-commerce, healthcare, and SME software ecosystems | Long term (≥ 4 years) |
| FedNow Instant-Payment Rails Catalysing Same-Day Funding | +1.7% | National, with faster penetration in digitally mature metros | Short term (≤ 2 years) |
| Source: Mordor Intelligence | |||
Near-Instant Mobile-First Origination Times
Application-to-funding cycles fell from three to five days in 2020 to under 24 hours in 2026, redefining borrower expectations and forcing incumbents to modernize onboarding workflows. The FedNow rail processed more than 50 million transactions in its first year, eliminating ACH batch lags and underpinning same-day disbursements. Embedded point-of-sale financing exemplified by Affirm’s Amazon partnership delivers approvals in seconds and funding within hours, capturing borrowers at the moment of purchase. Lenders report a 22% rise in synthetic-identity attempts, prompting greater investment in real-time ID verification layers that insert controlled friction. Speed differentiation is now inseparable from robust fraud controls and dynamic credit-decisioning engines.
AI-Driven Alternative-Data Credit Scoring
Platforms harness cash-flow trends, utility payments and employment tenure to serve thin-file segments excluded by FICO-centric models. Upstart’s algorithm evaluates more than 1,600 variables and approved 173% more applicants than legacy scorecards in 2024 while posting comparable loss rates. Delinquencies rose to 5.8% in Q3 2025 as the mix skewed toward subprime tiers, illustrating the need for rapid model retraining as macro conditions shift. Federal regulators encourage responsible alternative-data use provided disparate-impact testing is applied, offering regulatory cover for continued adoption. This driver widens the total addressable borrower pool but demands rigorous bias mitigation and performance monitoring in the US digital lending market.
Embedded Lending inside Vertical SaaS Platforms
Shopify Capital originated more than USD 5 billion by 2024 through offers surfaced in the merchant dashboard, converting over 40% of approved merchants. Toast Capital extended USD 1 billion to restaurant operators by 2025, deducting repayments as a percentage of daily revenue, thus aligning debt service with cash-flow seasonality. Embedded-finance growth at 12.56% CAGR reflects merchants’ preference for frictionless capital integrated into existing software in the US digital lending market. Concentrated industry exposure, however, can amplify correlated defaults, and regulatory ambiguity persists around licensing when non-bank software firms originate credit.
Uptick of Digitally-Savvy Borrowers
U.S. smartphone penetration surpassed 90% among adults in 2025, enabling nationwide access to mobile lending apps. Urban millennials and Gen Z segments in California, New York and Washington, D.C. exhibit the highest adoption, driving front-loaded origination volume. Educational content, instant approvals and transparent repayment schedules resonate with these cohorts, supporting sustained demand for short-tenor installment products. As digital expectations permeate older demographics, lenders capitalize on cross-selling credit-builder cards, high-yield savings and robo-advisory services, enhancing lifetime customer value. The trend underpins geographic expansion and product diversification across the United States digital lending market.
Restraints Impact Analysis*
| Restraint | (~) % Impact on CAGR Forecast | Geographic Relevance | Impact Timeline |
|---|---|---|---|
| Cyber-security and data-privacy breaches | -1.7% | Global | Short term (≤ 2 years) |
| Uncertain federal / state “true-lender” rules and rate caps | -2.1% | National (state level) | Medium term (2-4 years) |
| Rising customer-acquisition cost for fintech lenders | -1.4% | National (metro areas) | Short term (≤ 2 years) |
| Shrinking pool of prime borrowers - adverse-selection risk | -1.8% | National | Medium term (2-4 years) |
| Source: Mordor Intelligence | |||
Cyber-Security and Data-Privacy Breaches
The 2024 Change Healthcare ransomware attack heightened scrutiny of third-party vendor risk. The New York Department of Financial Services mandated multi-factor authentication and real-time transaction monitoring for lenders in 2024. California’s Consumer Privacy Act similarly extends borrower data rights, forcing smaller fintechs to invest in encryption, tokenization and incident-response protocols. Reputational damage and remediation costs erode margins, while stricter controls marginally extend onboarding times, challenging the United States digital lending market’s speed thesis.
Uncertain Federal / State True-Lender Rules and Rate Caps
The Consumer Financial Protection Bureau’s 2024 interpretive rule stipulates that the entity that makes the majority of loans is the true lender, potentially subjecting fintech partners to state usury caps. Colorado and Illinois enforce 36% APR ceilings, prompting marketplace lenders to exit or redesign structures.[1]Colorado Department of Regulatory Agencies, “36% APR Cap Legislation,” colorado.gov Divergent state positions fragment product design and raise compliance spend, discouraging long-duration capital commitments. Investors demand higher spreads on securitizations linked to jurisdictions with legal uncertainty, trimming net issuance volumes in the United States digital lending market.
*Our forecasts treat driver/restraint impacts as directional, not additive. The impact forecasts reflect baseline growth, mix effects, and variable interactions.
Segment Analysis
By Borrower Type: Business Lending Outpaces Consumer Growth
The business-borrower segment captured 21.88% of 2025 volume yet is forecast to expand at 13.23% CAGR through 2031, outpacing consumer loans. Embedded merchant-cash-advance products offered by Square Loans and Toast Capital align repayments with revenue, reducing default volatility. Bluevine and OnDeck leverage real-time bank-account data to approve working-capital loans within hours, satisfying SMEs that struggled to access pandemic-era relief programs. Consumer lending remains dominant but faces rising delinquency rates that reached 3.2% for credit cards in Q2 2025, tempering expansion.
A broadened addressable SME base, favorable unit economics and lower customer-acquisition costs inside payment ecosystems extend upside for business lenders. Risk is concentrated in cyclical verticals such as food service and retail, underscoring the importance of cash-flow-linked repayment structures. Consumer lenders hedge by cross-selling credit-builder cards and high-yield savings to boost retention and mitigate margin compression. Overall, diversification keeps the United States digital lending market resilient across economic cycles.


By Provider Type: Embedded Platforms Challenge Traditional Banks
Traditional banks retained 46.31% share in 2025 through low-cost deposit funding and established trust. Fintechs such as SoFi and LendingClub secured bank charters to replicate this advantage, cutting funding costs to 4.2% versus 6.5% under marketplace models. Embedded-finance providers are scaling revenues at 12.56% CAGR by distributing credit seamlessly within software workflows, achieving acceptance rates above 40% among merchants. Credit unions modernize via mobile-first origination that reduces approval times from days to minutes.[3]Navy Federal Credit Union, “Mobile-First Loans,” navyfederal.org
Regulatory scrutiny of third-party risk elevated after 2023 OCC consent orders, incentivizing deeper diligence on fintech partnerships. Banks weighing build-versus-partner decisions confront high technology investment and cultural friction, whereas software platforms face potential reclassification as lenders under true-lender doctrine. The competitive balance in the United States digital lending market will hinge on cost of capital, user experience and compliance sophistication.
By Funding Source: P2P and Fractional Models Gain Traction
Whole-loan balance-sheet funding captured 52.01% of 2025 originations, reflecting lenders’ desire to retain net interest income. Peer-to-peer and fractional models, however, are growing at 13.41% as institutions pursue yield. Prosper reported institutional buyers accounting for 85% of loan purchases in Q1 2025, up from 80% in 2024. Upstart securitized USD 10 billion in loans between 2021 and 2024, demonstrating investor appetite even for subprime-leaning pools.
Rising treasury yields in 2022-2023 depressed relative spreads, briefly slowing P2P inflows, yet demand rebounded in 2024-2025 as rate-cut expectations mounted.[2]Federal Reserve Board, “Consumer Credit Delinquency Rates,” federalreserve.gov Balance-sheet concentration heightens credit-loss exposure when unemployment rises, so lenders increasingly blend securitization and fractional funding to optimize risk transfer. This mix supports liquidity and underpins growth in the United States digital lending market size for each funding archetype.

By Loan Purpose: Medical Financing Surges Amid Rising Healthcare Costs
Personal installment loans accounted for 37.51% of 2025 originations. Medical financing is the fastest-growing purpose category, with a 14.62% CAGR, driven by out-of-pocket cost inflation. CareCredit partnered with 250,000 providers to originate USD 8 billion in 2024, embedding financing at the point of care. Affirm expanded into elective surgery financing through hospital integrations in 2024. Personal installment loans still hold the largest share of volume but are moderating as prime borrowers refinance into lower-cost home-equity lines and subprime cohorts hit affordability ceilings.
Student loans and auto refinancing benefit from rate arbitrage and asset-price appreciation, yet growth is slower than medical financing. Elevated medical deductibles averaging USD 1,735 in 2024 sharpen demand for payment plans. This structural shift supports the sustained expansion of the United States' digital lending market share for healthcare-linked products through 2031.
Geography Analysis
California, Washington, and Colorado anchor origination volume due to high incomes, fintech talent, and proximity to venture capital. However, maturing penetration slows growth, shifting momentum to the Southeast and Southwest, where population inflows and 6.1% disposable income gains in 2025 outpace the 4.2% national average. Florida, Texas, and Arizona attracted 1.2 million net domestic migrants between 2020-2024, spurring demand for auto, home-improvement, and SME credit.
Regulatory caps in Colorado and Illinois prompted several lenders to exit or restructure, fragmenting the addressable market. The Midwest gains traction through embedded equipment financing inside precision-ag software, exemplified by John Deere Financial’s in-platform approvals. The Southwest’s energy and cross-border trade activity pushed Texas to 15% of national small-business lending in 2024. Cybersecurity mandates in New York and California add compliance costs but elevate trust.
Regional delinquency divergence persists: the Southeast and Southwest face higher default rates tied to subprime exposure, whereas the Northeast and West maintain lower delinquencies anchored by prime borrowers. Geographic portfolio diversification remains a critical risk-management lever for participants in the United States digital lending market.
Competitive Landscape
The market is moderately fragmented, with banks, marketplace lenders, neobanks, and embedded finance platforms serving overlapping segments. Fintechs such as LendingClub and SoFi gained deposit franchises, lowering funding costs and mitigating reliance on external securitization.
Upstart differentiates through AI-driven underwriting, but tightened credit boxes in late 2025 as delinquencies climbed. Embedded providers like Shopify Capital and Stripe Capital convert captive merchant data into high-yield lending, sustaining over 40% offer acceptance rates.
White space remains in elective medical, agricultural, and SaaS revenue-based financing. Pipe disbursed USD 1 billion to SaaS firms by 2024, repaid via a share of monthly recurring revenue. Compliance rigor is a differentiator; platforms that excel in vendor oversight secure better securitization pricing and institutional backing, while laggards face enforcement actions and reputational drag. Overall, customer experience, cost of capital, and regulatory agility define competitive advantage across the United States digital lending market.
United States Digital Lending Industry Leaders
Affirm, Inc.
American Express/Kabbage
Avant, LLC
Biz2Credit Inc.
Bluevine Inc.
- *Disclaimer: Major Players sorted in no particular order

Recent Industry Developments
- December 2025: SoFi originated USD 5.2 billion in personal loans in Q4 2025, a 23% year-over-year rise, expanding net interest margin to 5.8%.
- November 2025: Affirm partnered with Walmart to embed buy-now-pay-later across its e-commerce platform for more than 100 million monthly users.
- October 2025: Upstart processed 1.8 million loan applications in Q3 2025, approving 68% but saw 60-plus-day delinquencies climb to 5.8%.
- September 2025: LendingClub originated USD 2.1 billion in Q3 2025, lowering funding cost to 4.2% after its bank-charter pivot.


Research Methodology Framework and Report Scope
Market Definitions and Key Coverage
Mordor Intelligence defines the United States digital lending market as the total value of loans that are originated, underwritten, disbursed, and serviced entirely through web or mobile interfaces, whether the provider is a bank, credit union, fintech balance-sheet lender, peer-to-peer marketplace, or embedded point-of-sale platform. Activity tied only to software licence fees or back-office loan-processing services is outside this boundary.
Scope Exclusions: Pure "loan-origination-software" revenue, crypto-denominated loans, and intragroup treasury transfers are excluded.
Segmentation Overview
- By Borrower Type
- Consumer
- Business (SME / Commercial)
- By Provider Type
- Traditional Banks
- Credit Unions
- Marketplace / Balance-Sheet FinTechs
- Embedded-Finance / Platform Lenders
- By Funding Source
- Whole-Loan Balance-Sheet
- Securitisation
- P2P / Fractional
- By Loan Purpose
- Personal Instalment
- Student Refinance
- Auto Refinance
- Medical Financing
- Business Working Capital
- Business Expansion
Detailed Research Methodology and Data Validation
Primary Research
To validate desk findings, Mordor analysts conduct semi-structured interviews with executives at national banks, balance-sheet fintechs, credit-union service organizations, and securitization desks across the Northeast, Midwest, and Pacific hubs. Borrower-side surveys and lender advisory councils help us stress-test assumptions on channel mix, pricing spreads, and approval times.
Desk Research
Our analysts begin by assembling supply-side data from U.S. call reports, FFIEC tables, and Consumer Financial Protection Bureau filings, supplementing these with Federal Reserve consumer-credit series and FDIC household banking surveys. Trade associations such as the Online Lenders Alliance and the Structured Finance Association provide granular origination, delinquency, and securitization disclosures. Public 10-Ks from leading listed lenders, state regulator dashboards, and patent libraries (via Questel for AI-scoring patents) further refine cost-of-risk and technology-adoption metrics. This list is illustrative; many additional public and proprietary sources inform the evidence base.
Market-Sizing & Forecasting
We adopt a top-down reconstruction that starts with Federal Reserve loan-stock and flow data, then adjusts for digital-only penetration using borrower-level adoption rates surfaced in primary research. Selective bottom-up spot checks, for example, aggregating 2024 consumer-loan securitizations or sampled average-ticket-size × volume for SME platforms, are layered in to reconcile totals.
Key variables shaping the model include:
1. Mobile-first origination share of total unsecured credit,
2. Embedded-finance loan volume inside retail checkouts,
3. Fintech securitization issuance,
4. Average coupon spreads over Prime,
5. Real-time payment rail uptake.
A multivariate regression links these drivers to digital-origination growth, while ARIMA smoothing handles seasonality tied to tax-refund and holiday spending.
Where bottom-up gaps remain (e.g. private-credit warehouse draws), ratios derived from primary interviews bridge the data.
Data Validation & Update Cycle
Outputs pass a three-layer review: analyst, lead author, and senior domain expert. Variances above preset thresholds trigger re-contact of at least one market participant. Models refresh annually; material regulatory or funding-cost shocks prompt interim revisions, ensuring clients always receive the freshest view.
Why Mordor's US Digital Lending Baseline Stands Apart
Published values frequently diverge because each firm picks different units, revenue bases, and loan stages before annualizing.
Key gap drivers include: rivals that report platform revenue only, others that cite alternative-lending niches such as P2P, and some that freeze FX or discount rates from prior years, whereas our study rolls forward Fed rate moves and securitization haircuts before triangulating.
Benchmark comparison
| Market Size | Anonymized source | Primary gap driver |
|---|---|---|
| USD 303.07 B (2025) | Mordor Intelligence | - |
| USD 284.52 B (2024) | Regional Consultancy A | Uses broader "alternative lending" tag yet omits credit-union volumes and adjusts neither for charge-offs nor refinancing churn |
| USD 2.86 B (2024) | Trade Journal B | Captures only software-platform revenue, excluding underlying loan principal and interest amounts |
In short, our transparent scope selection, dual-track modeling, and annual source refresh give decision-makers a dependable, reality-checked baseline that balances breadth with traceable data paths.


Key Questions Answered in the Report
How fast is the United States digital lending market expected to grow through 2031?
The market is projected to expand from USD 339.22 billion in 2026 to USD 592.87 billion by 2031 at an 11.81% CAGR.
Which borrower segment is growing the quickest?
Business lending to small and medium enterprises is forecast to rise at 13.23% annually, beating consumer loan growth.
What role does FedNow play in digital lending?
FedNow’s real-time settlement rail enables same-day funding, reducing application-to-disbursement cycles to under 24 hours and enhancing borrower experience.
Why are embedded-finance platforms gaining share?
They integrate credit offers directly into e-commerce, healthcare and SME software, driving higher acceptance rates and 12.56% CAGR growth.
What is the biggest restraint facing lenders?
Legal uncertainty over true-lender doctrine and state rate caps, which can restrict APRs and raise compliance costs, subtracts about 2.1 percentage points from forecast CAGR.
Which loan-purpose category is growing fastest?
Medical financing leads with a 14.62% CAGR, fueled by rising out-of-pocket healthcare costs and point-of-care lending partnerships.
Page last updated on:


