Global Dental Turbine Market Size and Share
Market Overview
| Study Period | 2020 - 2031 |
|---|---|
| Market Size (2026) | USD 239.79 Million |
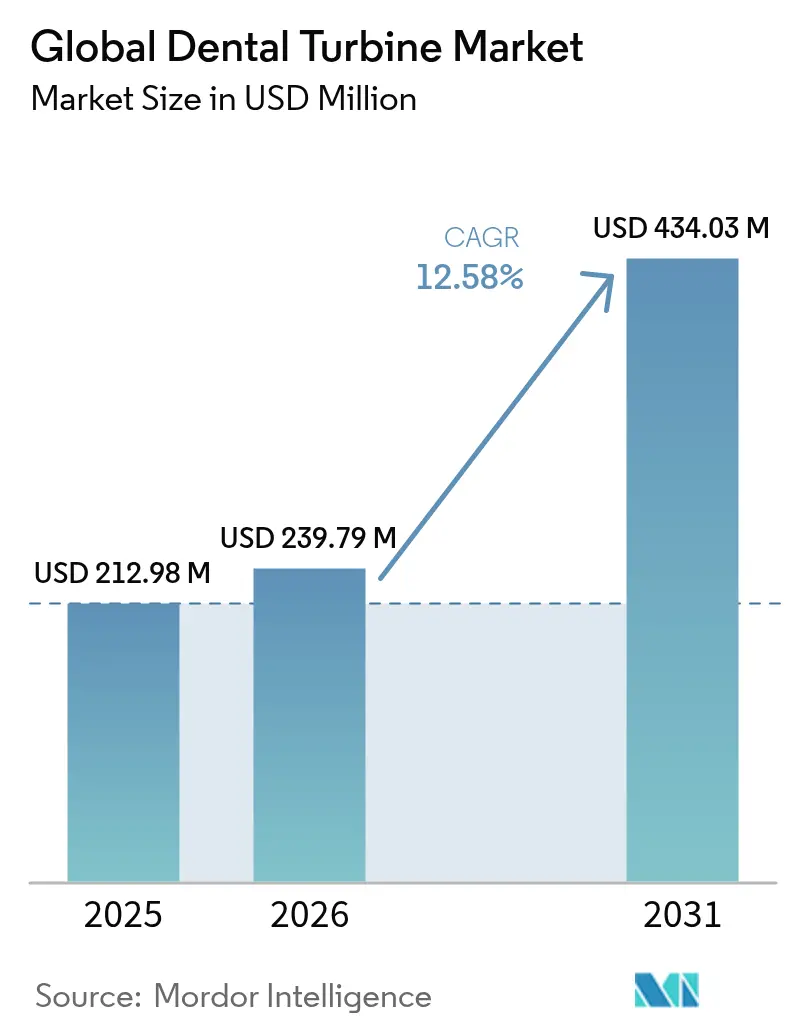
| Market Size (2031) | USD 434.03 Million |
| Growth Rate (2026 - 2031) | 12.58% CAGR |
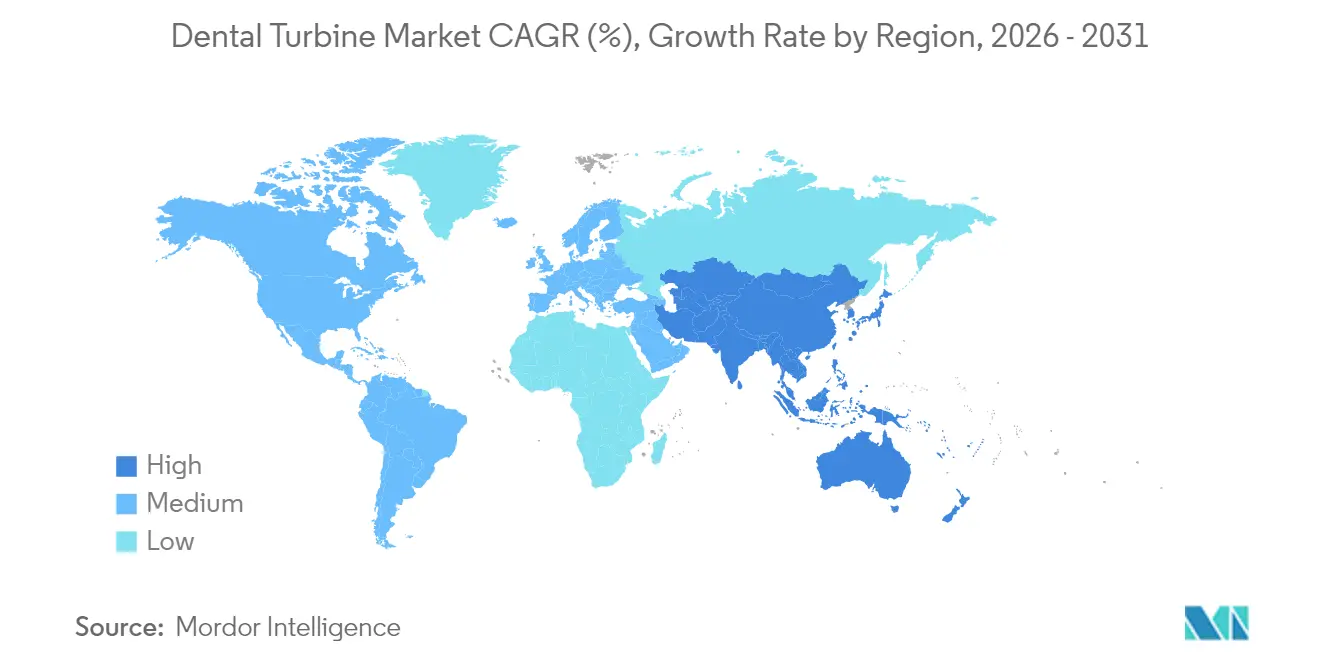
| Fastest Growing Market | Asia-Pacific |
| Largest Market | North America |
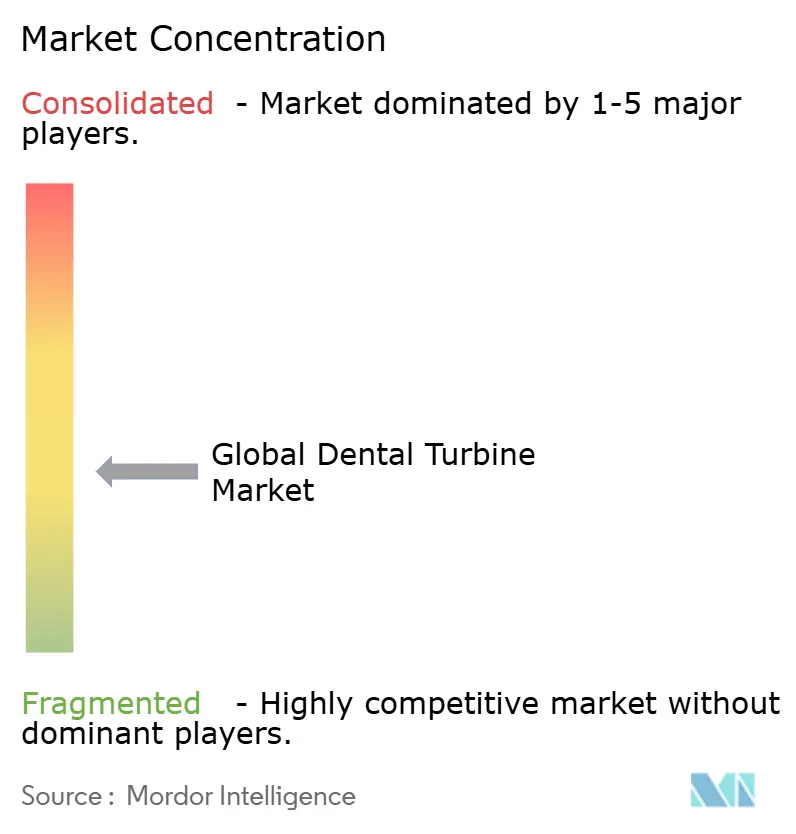
| Market Concentration | Medium |
Major Players *Disclaimer: Major Players sorted in no particular order Image © Mordor Intelligence. Reuse requires attribution under CC BY 4.0. | |
Global Dental Turbine Market Analysis by Mordor Intelligence
The Dental turbine market size was valued at USD 212.98 million in 2025 and estimated to grow from USD 239.79 million in 2026 to reach USD 434.03 million by 2031, at a CAGR of 12.58% during the forecast period (2026-2031). Demand accelerates because infection-control upgrades became a permanent operating priority after the COVID-19 emergency, pushing clinics to adopt turbines that withstand repeated heat sterilization mandated by the Centers for Disease Control and Prevention. Uptake is further supported by digital dentistry investments that link turbines with chairside CAD/CAM systems, while subscription-based procurement models ease capital constraints for small practices. Electric and hybrid handpieces gain traction as empirical studies confirm their superior aerosol mitigation performance compared with air-driven tools. Competitive dynamics favor manufacturers that pair precision engineering with cloud-based maintenance analytics, creating added revenue from service contracts.
Key Report Takeaways
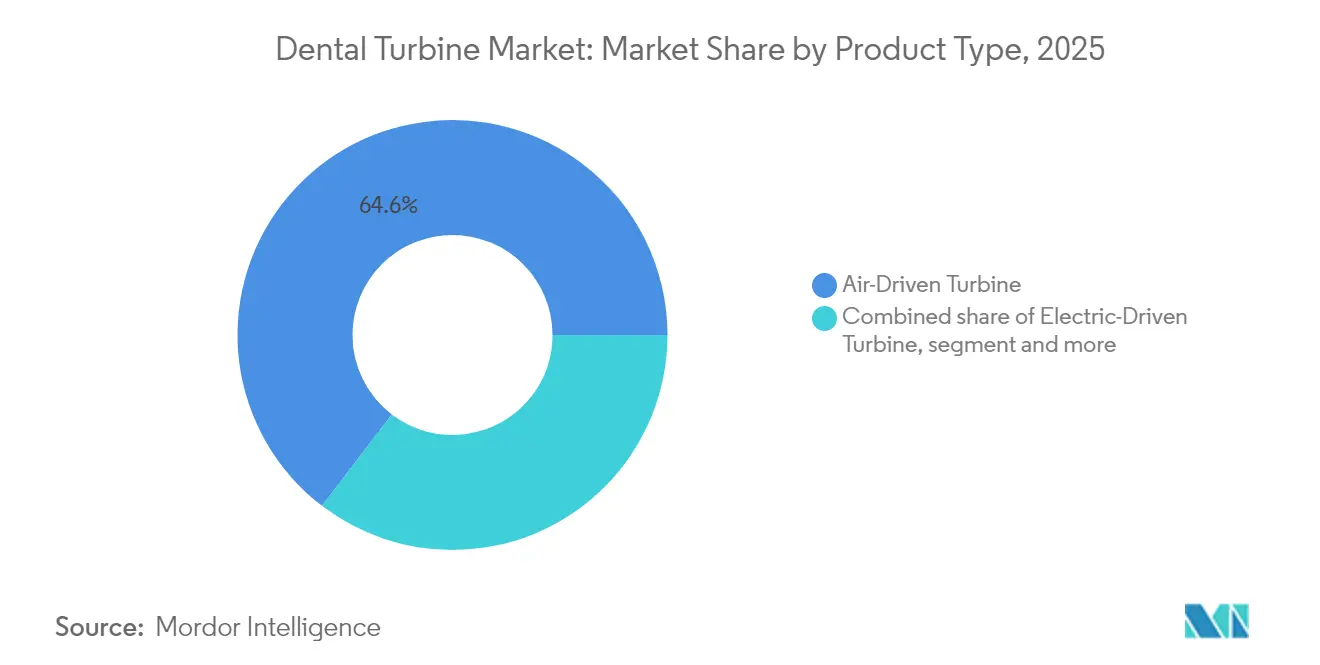
- By product type, air-driven turbines led with 64.62% of Dental turbine market share in 2025, whereas electric-driven units are on track for a 15.27% CAGR through 2031.
- By speed category, high-speed models dominated with 58.10% revenue share in 2025; low-speed variants are projected to expand at a 15.02% CAGR through 2031.
- By material, stainless-steel housings accounted for 62.45% of the Dental turbine market size in 2025, while titanium-alloy options are forecast to rise at 14.72% CAGR to 2031.
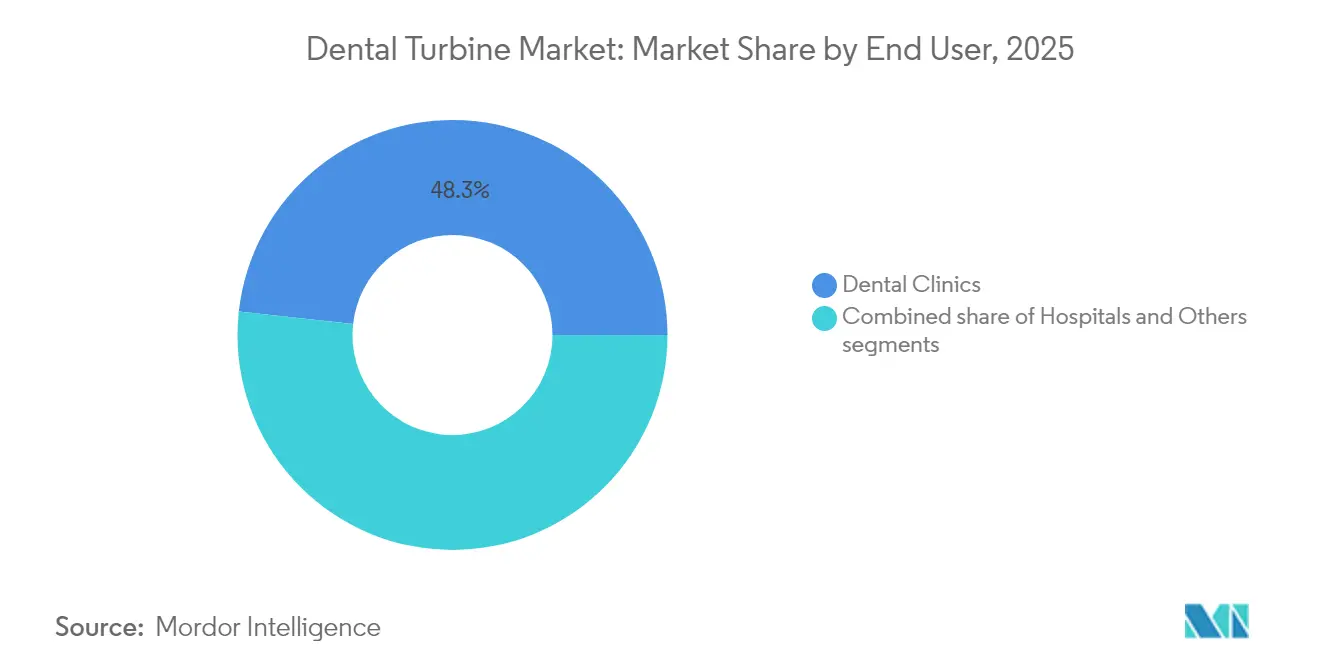
- By end user, dental clinics held 48.25% share of the Dental turbine market size in 2025, and the “Others” segment is growing at 15.68% CAGR to 2031.
- By distribution channel, traditional dealers retained 42.10% revenue share in 2025; online channels are advancing at a 15.95% CAGR through 2031.
- By region, North America captured 39.30% of Dental turbine market share in 2025, while Asia-Pacific records the highest projected CAGR at 16.05% through 2031.
Note: Market size and forecast figures in this report are generated using Mordor Intelligence’s proprietary estimation framework, updated with the latest available data and insights as of 2026.
Global Dental Turbine Market Trends and Insights
Drivers Impact Analysis*
| Driver | (~) % Impact on CAGR Forecast | Geographic Relevance | Impact Timeline |
|---|---|---|---|
| Rising demand for cosmetic & minimally-invasive procedures | +2.1% | Global, with concentration in North America & Europe | Medium term (2-4 years) |
| Growing global burden of dental caries & periodontal disease | +3.2% | Global, with highest impact in emerging markets | Long term (≥ 4 years) |
| Rapid adoption of electric & hybrid turbines for aerosol mitigation | +2.8% | Global, accelerated in developed markets | Short term (≤ 2 years) |
| Integration with chairside CAD/CAM & digital workflows | +1.9% | North America & Europe core, expanding to APAC | Medium term (2-4 years) |
| Subscription-based "handpiece-as-a-service" procurement models | +1.5% | Global, with early adoption in developed markets | Medium term (2-4 years) |
| Emerging-market insurance expansion for restorative dentistry | +1.2% | APAC core, expanding to Latin America & MEA | Long term (≥ 4 years) |
| Source: Mordor Intelligence | |||
Rising Demand for Cosmetic & Minimally-Invasive Procedures
Practices increasingly emphasize esthetic outcomes, driving a requirement for turbines that achieve smooth margins with low vibration. A 2024 survey reported that 81% of dentists view artificial intelligence as beneficial for cosmetic treatment planning, reinforcing demand for high-torque, precision instruments. Manufacturers respond with ergonomic designs such as KaVo’s EXPERTtorque E680 series, which provides 30 N bur retention and low noise to improve patient comfort. The shift is most visible in North America and Europe, where discretionary spending on elective dentistry remains high. Enhanced torque control supports minimally invasive approaches that preserve tooth structure, making the turbines integral to premium service offerings. Quieter operation also differentiates providers that market spa-like clinical environments.
Growing Global Burden of Dental Caries & Periodontal Disease
The World Health Organization links chronic oral infections with systemic conditions such as Alzheimer’s disease, prompting governments to prioritize restorative care that relies on high-performance turbines. Rising sugar consumption in urban Asia boosts untreated caries among youth, increasing procedure volumes in high-volume practices. Manufacturers extend warranty periods and reinforce key components so turbines withstand intensive daily cycles. Extended service intervals lower downtime for clinics confronting heavy caseloads, while durable bearings maintain cutting efficiency across repeated sterilization. Evidence of periodontal disease’s systemic impact elevates turbines from episodic tools to core infrastructure in public-health strategies aimed at reducing long-term treatment costs.
Rapid Adoption of Electric & Hybrid Turbines for Aerosol Mitigation
Peer-reviewed 2025 trials show that combining electric handpieces with high-volume evacuation reduces microbial aerosol concentration more effectively than traditional air-driven setups. Regulators and malpractice insurers promote technology that cuts airborne contamination, accelerating electric uptake in Europe and North America. Hybrid systems help clinics transition by offering air-line compatibility while adding direct-drive control that limits aerosol release. Evidence that high-speed rotation generates persistent micro-droplets has reoriented purchasing criteria toward infection-control performance. Manufacturer roadmaps prioritize sealed head designs and internal anti-retraction valves that maintain sterility under repeated sterilization.
Integration with Chairside CAD/CAM & Digital Workflows
In-office milling units costing USD 100,000 to USD 150,000 depend on precisely prepared margins to deliver accurate crowns in one visit. Turbines therefore require sensors that monitor torque and bur run-out in real time, feeding data into the digital workflow. Predictive maintenance alerts reduce unscheduled downtime, supporting the high patient-throughput model of digital dentistry. Early adopters are large group practices in the United States that standardize equipment across multiple sites, creating scale advantages for turbine makers with integrated software support. The resulting ecosystem locks clients into proprietary platforms, increasing switching costs and stabilizing revenue streams.
Restraints Impact Analysis*
| Restraint | (~) % Impact on CAGR Forecast | Geographic Relevance | Impact Timeline |
|---|---|---|---|
| High capital & servicing costs of premium turbines | -1.4% | Global, with highest impact in emerging markets | Short term (≤ 2 years) |
| Viable substitutes (electric micromotors, laser dentistry) | -0.8% | Developed markets with advanced technology adoption | Medium term (2-4 years) |
| Noise-related occupational-health regulations | -1.1% | Europe & North America core, expanding globally | Medium term (2-4 years) |
| Stringent re-processing / sterilization turnaround times | -0.9% | Global, with highest compliance pressure in developed markets | Short term (≤ 2 years) |
| Source: Mordor Intelligence | |||
High Capital & Servicing Costs of Premium Turbines
Electric handpieces often exceed USD 5,000, stretching budgets for solo practices in Latin America and Southeast Asia. Total cost of ownership rises because improper lubrication and autoclave cycles shorten turbine life, with manufacturers attributing over 50% of failures to inadequate maintenance. Clinics lacking automated hygiene stations face additional labor costs and risk service-interrupting damage. Subscription leasing partially offsets upfront expense by bundling hardware, maintenance, and replacements into predictable fees, yet adoption remains limited to advanced markets.
Viable Substitutes (Electric Micromotors, Laser Dentistry)
Hard-tissue lasers eliminate mechanical contact and virtually all aerosols, challenging turbines in cavity preparations. Electric micromotors offer comparable cutting power at lower operating noise, appealing to practices focused on occupational-health compliance. Although substitute technologies carry higher initial costs, affluent patients increasingly request them. Turbine manufacturers counter through hybrid designs that integrate micromotor torque management while preserving familiar air-line connections, thereby broadening their value proposition.
*Our forecasts treat driver/restraint impacts as directional, not additive. The impact forecasts reflect baseline growth, mix effects, and variable interactions.
Segment Analysis
By Product Type: Electric Models Gain Infection Control Edge
Electric-driven units accounted for a smaller base but are on pace to expand at 15.27% CAGR through 2031, narrowing the gap with air-driven systems that held 64.62% Dental turbine market share in 2025. Clinics prioritize aerosol mitigation, and peer-reviewed data confirms plasma purification paired with electric turbines lowers airborne pathogen counts. Electric handpieces provide digitally controlled torque that prevents stalling during heavy cuts, enhancing chairside productivity.
Growth also reflects alignment with artificial-intelligence-enabled workflows embraced by 81% of surveyed dentists. Dental service organizations negotiate bulk contracts, accelerating volume shifts toward electric models. Hybrid turbines bridge the transition by using existing compressed-air infrastructure while embedding electric micro-motors to cut aerosol volume. As group practices standardize on closed-loop sterilization, equipment spec sheets increasingly favor sealed bearings and anti-retraction valves, reinforcing electric advantages.


By Turbine Speed: High-Speed Dominance Faces Precision Challenges
High-speed models commanded 58.10% revenue in 2025, yet clinicians must manage pulp temperature rise at rotations above 200,000 rpm. Manufacturers incorporate ceramic ball bearings and advanced coolant ports to protect dentine near the pulp chamber, sustaining preference for high-speed options while addressing safety. Low-speed units remain indispensable for endodontics and finishing tasks, but their growth is tied to niche application volume rather than broad market shifts.
Precision dentistry trends favor variable-speed controls that allow practitioners to toggle between rough-cut and fine-finish in a single unit. KaVo’s Direct Stop Technology halts the bur within one second, minimizing over-prep in minimally invasive cases. Future upgrades may integrate haptic feedback that alerts when predefined depth settings are reached, embedding speed as a controllable parameter rather than a fixed specification.
By Material: Stainless-Steel Reliability Meets Titanium Innovation
Stainless steel dominated with 62.45% of Dental turbine market size in 2025 because it withstands high-temperature autoclave cycles without deformation.Titanium-alloy housings, however, cut instrument weight by up to 25%, reducing hand-arm vibration and operator fatigue, and they are forecast to grow at 14.72% CAGR. Lighter handpieces align with occupational-health directives that limit exposure to repetitive stress injuries, especially among clinicians who perform long restorative sessions.
Titanium’s corrosion resistance also reduces micro-pitting that would otherwise harbor pathogens, supporting compliance with strict sterilization protocols. The shift to premium alloys drives complementary demand for compatible burs and lubricant formulations, extending value streams for suppliers. Cost remains a hurdle, so suppliers package titanium models with extended warranty and service bundles that justify price premiums through reduced long-term maintenance.
By End User: Specialty Centers Drive Innovation Adoption
Dental clinics retained 48.25% revenue share in 2025, yet specialty centers and mobile units are expanding at 15.68% CAGR as new care models emerge. Specialty providers adopt electric turbines early because infection control and procedural precision are crucial differentiators in implantology and cosmetic dentistry. Mobile clinics leverage lightweight, battery-compatible turbines to deliver care in schools and corporate campuses, widening addressable patient pools.
Hospitals purchase under centralized tender processes that emphasize cost over advanced specifications, tempering their growth rate. Conversely, dental service organizations operating across multiple states in the United States push unified vendor contracts, creating scale for premium turbine deployment. As national chains acquire solo practices, procurement shifts from personal preference to standardized technology bundles, accelerating innovation diffusion.
By Distribution Channel: Digital Transformation Accelerates Online Growth
Dealer networks captured 42.10% of 2025 revenue because they provide in-person handpiece servicing and loaner programs that clinics still value. Online platforms are projected to grow at 15.95% CAGR as e-procurement systems integrate with practice-management software that automates reorder triggers. Price transparency and direct manufacturer promotions on digital marketplaces appeal to cost-conscious small practices in Latin America and India.
Subscription models offered via cloud dashboards blur lines between sales and service by bundling turbines, sterilization cassettes, burs, and predictive maintenance alerts for a monthly fee. Marketplace data analytics inform manufacturers about real-time usage trends, enabling demand-driven production planning. Regulatory frameworks increasingly permit electronic documentation of device traceability, further supporting digital channel expansion.
Geography Analysis
North America maintained 39.30% Dental turbine market share in 2025, underpinned by FDA 510(k) regulations that enforce performance standards and encourage adoption of premium handpieces.Insurance reimbursement for advanced restorative procedures supports capital investment in electric turbines. Canada benefits from cross-border trade and dental tourism that funnels US-approved devices into its clinics with minimal additional certification.
Asia-Pacific posts the highest CAGR at 16.05% through 2031 because India and China expand dental insurance to middle-income segments. Urban middle-class patients demand esthetic restorations delivered quickly, prompting clinics to install high-speed, lightweight turbines to maximize chair turnover. Domestic manufacturers in China offer cost-competitive stainless-steel models, while international brands target premium niches through authorized e-commerce channels.
Europe enjoys steady replacement cycles because equipment aging past mandatory sterilization test thresholds requires upgrading. Harmonized CE marking enables seamless product movement across the bloc, but post-Brexit rules add customs documentation for UK shipments. Manufacturers with EU-based production avoid supply-chain friction and can deliver replacement parts within 48 hours, maintaining customer loyalty in time-sensitive practices.

Competitive Landscape
The Dental turbine market is moderately fragmented. FDA submission complexity and sterilization testing costs deter new entrants, but niche players exploit gaps by offering subscription handpiece-as-a-service plans. October 2024 saw HuFriedyGroup acquire SS White Dental to gain bur technology that complements turbine lines, signaling convergence within the value chain.
Market leaders emphasize material science and digital connectivity rather than price. KaVo upgraded its EXPERTtorque series with ceramic bearings and IoT drift monitoring that alerts users before failure. NSK added titanium casings across its Ti-Max Z series, dropping handpiece weight to 72 g and positioning for ergonomic leadership. Emerging Chinese vendors aim at stainless-steel high-speed units priced 20% below European benchmarks, marking competitive pressure in entry-level segments.
Strategic alliances with distribution platforms increase product visibility in online channels. Dentsply Sirona integrates turbine performance data into its CEREC chairside system, binding consumable sales with hardware replacement cycles. Subscription financing models tested in the United States migrate to Western Europe as credit-rating platforms mature. Competitive positioning now hinges on total-cost-of-ownership value rather than upfront price alone.
Global Dental Turbine Industry Leaders
Dentsply Sirona, Inc
Nakanishi Inc
W&H Group
B.A. International
Bien Air
- *Disclaimer: Major Players sorted in no particular order

Recent Industry Developments
- October 2024: HuFriedyGroup completed its acquisition of SS White Dental, broadening its turbine accessory portfolio and global distribution footprint.
- October 2024: Patient Square Capital purchased Patterson Companies for USD 4.1 billion, intensifying consolidation in dental equipment distribution.
- September 2024: Dentsply Sirona released an upgraded T-series turbine with integrated CAD/CAM connectivity.
- January 2024: FDA issued updated performance criteria for air-powered dental handpieces, influencing future turbine design submissions.


Research Methodology Framework and Report Scope
Market Definitions and Key Coverage
Our study defines the dental turbine market as revenue generated from brand-new, chair-side high and low-speed handpieces that rely on compressed air, electricity, or hybrid drives to power rotary burs used for cutting, polishing, and endodontic access in clinical operatory settings. According to Mordor Intelligence, this pool was valued at USD 212.98 million in 2025.
Scope exclusion: laboratory bench motors, implant surgical drills, and consumables such as burs or bearings are not counted.
Segmentation Overview
- By Product Type
- Air-Driven Turbine
- Electric-Driven Turbine
- Hybrid Air-Electric Turbine
- By Turbine Speed
- High-Speed
- Low-Speed
- By Material
- Stainless-Steel Housing
- Titanium-Alloy Housing
- Others
- By End User
- Hospitals
- Dental Clinics
- Others
- By Distribution Channel
- Direct Sales
- Dental Dealers / Distributors
- Online Platforms
- By Geography
- North America
- United States
- Canada
- Mexico
- Europe
- Germany
- United Kingdom
- France
- Italy
- Spain
- Rest of Europe
- Asia-Pacific
- China
- Japan
- India
- Australia
- South Korea
- Rest of Asia-Pacific
- Middle East and Africa
- GCC
- South Africa
- Rest of Middle East and Africa
- South America
- Brazil
- Argentina
- Rest of South America
- North America
Detailed Research Methodology and Data Validation
Primary Research
Mordor analysts interviewed practicing dentists, biomedical engineers, dealer managers, and infection-control officers across North America, Europe, and key Asia-Pacific clinics. These conversations tested secondary findings, clarified average selling prices, aerosol mitigation retrofits, and realistic replacement cycles, giving us fresh insight that desk research alone could not supply.
Desk Research
We began with public datasets that illuminate procedure volumes and equipment demand, such as WHO oral-disease prevalence tables, CDC National Ambulatory Medical Care Survey, Eurostat outpatient dental visits, and customs shipment codes for HS 901849. Trade bodies, including the American Dental Association and FDI World Dental Federation, and reputed journals like the International Journal of Prosthodontics offered adoption benchmarks for electric versus air turbines. Financial filings from leading handpiece OEMs, plus paid interfaces in D&B Hoovers and Dow Jones Factiva, helped us spot pricing corridors and regional mix shifts. The sources listed are illustrative; many additional publications and databases were consulted for validation and context.
Market-Sizing & Forecasting
We applied a top-down model anchored on restorative and endodontic procedure counts, turbine penetration rates, and average selling prices. We then cross-checked totals with selective bottom-up roll-ups from distributor sales and sampled tender awards. Variables such as chairside visits per capita, elective cosmetic procedure growth, regulatory aerosol guidelines, and the electric-drive share trajectory feed our multivariate regression forecast. Where distributor data were patchy, regional ASP medians were imputed through expert corroboration before final triangulation.
Data Validation & Update Cycle
Each draft model undergoes variance scans against independent shipment trends and OEM earnings. Senior reviewers vet anomaly flags, and we reconfirm key assumptions with respondents when large deltas emerge. Reports refresh yearly, with mid-cycle updates triggered by policy or technology shifts. Before release, an analyst performs a last reality check so clients receive the latest view.
Why Mordor's Dental Turbine Baseline Commands Reliability
Published figures often diverge because publishers choose different product scopes, unit-price assumptions, and refresh cadences. We acknowledge these gaps upfront and preview them below.
Key gap drivers include: some studies bundle lab turbines or broader handpiece families, others use list prices without regional discounts, and a few project growth from a limited survey year without annual expert reviews, while Mordor's page is refreshed every twelve months and double-checks scope with frontline users.
Benchmark comparison
| Market Size | Anonymized source | Primary gap driver |
|---|---|---|
| USD 212.98 M (2025) | Mordor Intelligence | - |
| USD 211.3 M (2023) | Global Consultancy A | older base year and no primary validation of ASP roll-downs |
| USD 125.9 M (2024) | Research Firm B | excludes electric and hybrid drives; relies on import data only |
| USD 150.5 M (2025) | Trade Journal C | bundles select emerging markets, omits North American refurb segment |
The comparison shows that when scope trimming or limited data sources are applied, totals swing widely. Mordor Intelligence's disciplined mix of broad geography, up-to-date procedure metrics, and dual validation steps delivers a balanced, transparent baseline that decision-makers can trace and replicate.


Key Questions Answered in the Report
What is the current value of the Dental turbine market?
The Dental turbine market stands at USD 239.79 million in 2026.
Which product type is growing the fastest?
Electric-driven turbines are advancing at a 15.27% CAGR through 2031 due to superior aerosol mitigation.
Why is Asia-Pacific the fastest-growing region?
Insurance expansion, rising disposable income, and local manufacturing push the region to a 16.05% CAGR.
How do electric turbines improve infection control?
They generate fewer aerosols, incorporate sealed head designs, and pair with high-volume evacuators to cut airborne pathogens.
Page last updated on:


