
Market Overview
| Study Period | 2020 - 2031 |
|---|---|
| Forecast Data Period | 2026 - 2031 |
| Historical Data Period | 2020 - 2024 |
| Base Year Market Size (2025) | USD 462.57 Million |
| Market Size (2026) | USD 490.02 Million |
| Market Size (2031) | USD 653.58 Million |
| Growth Rate (2026 - 2031) | 5.93 % |
Major Players
*Disclaimer: Major Players sorted in no particular order Image © Mordor Intelligence. Reuse requires attribution under CC BY 4.0. |
|
Canada Dental Devices Market Analysis by Mordor Intelligence
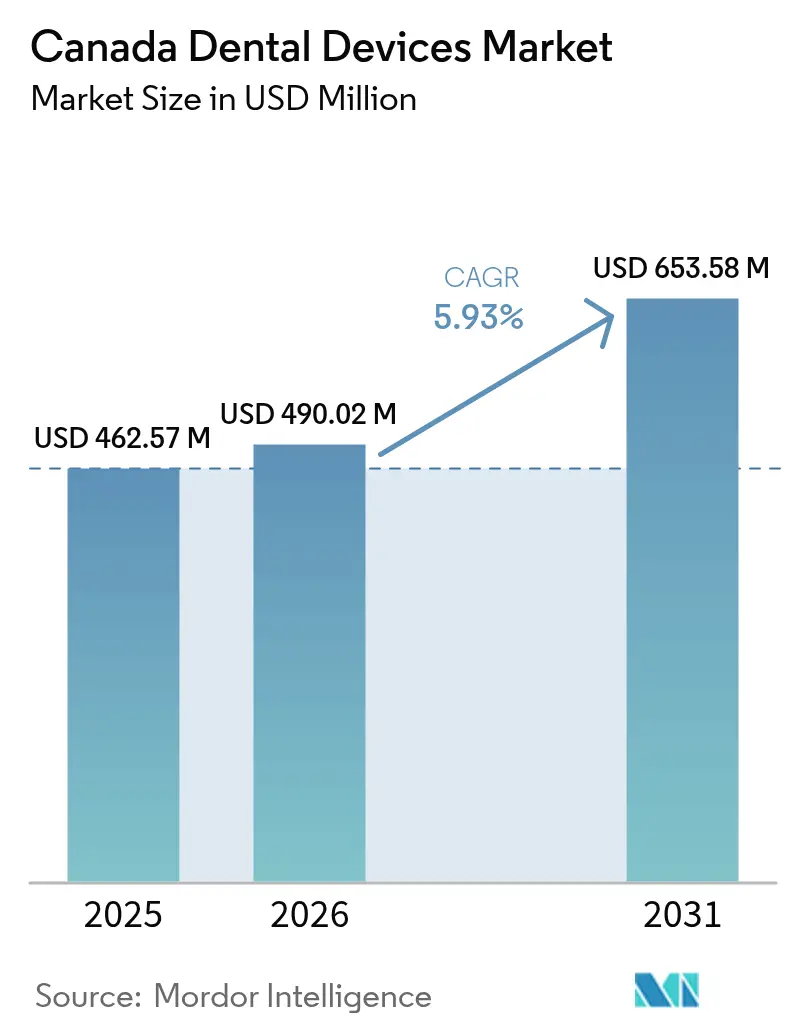
The Canada Dental Devices Market size is expected to grow from USD 462.57 million in 2025 to USD 490.02 million in 2026 and is forecast to reach USD 653.58 million by 2031 at 5.93% CAGR over 2026-2031.
Sustained CDCP funding is channeling spending into digital imaging, ergonomic chairs, and AI-ready software, shortening replacement cycles. Dentalcorp and other chains are standardizing on integrated platforms, squeezing single-product vendors while rewarding full-suite suppliers. The CDCP’s phased roll-out stabilizes order flow, prompting manufacturers to stock more mid-tier systems that fit federal fee caps. Falling residual values for analog units are pushing clinics toward leasing and subscription models that bundle service. Growing senior populations require complex care, lifting demand for restorative tools and driving repeat visits [1]Statistics Canada - "Factors associated with the use of oral health care services among seniors in Canada." June 19, 2024. . Safety Code 30 calibration rules enhance the importance of maintenance contracts, expanding service-based revenue. Clinics now negotiate bundled service upfront to minimize downtime risk, making after-sales support as pivotal as hardware specs.
Key Report Takeaways
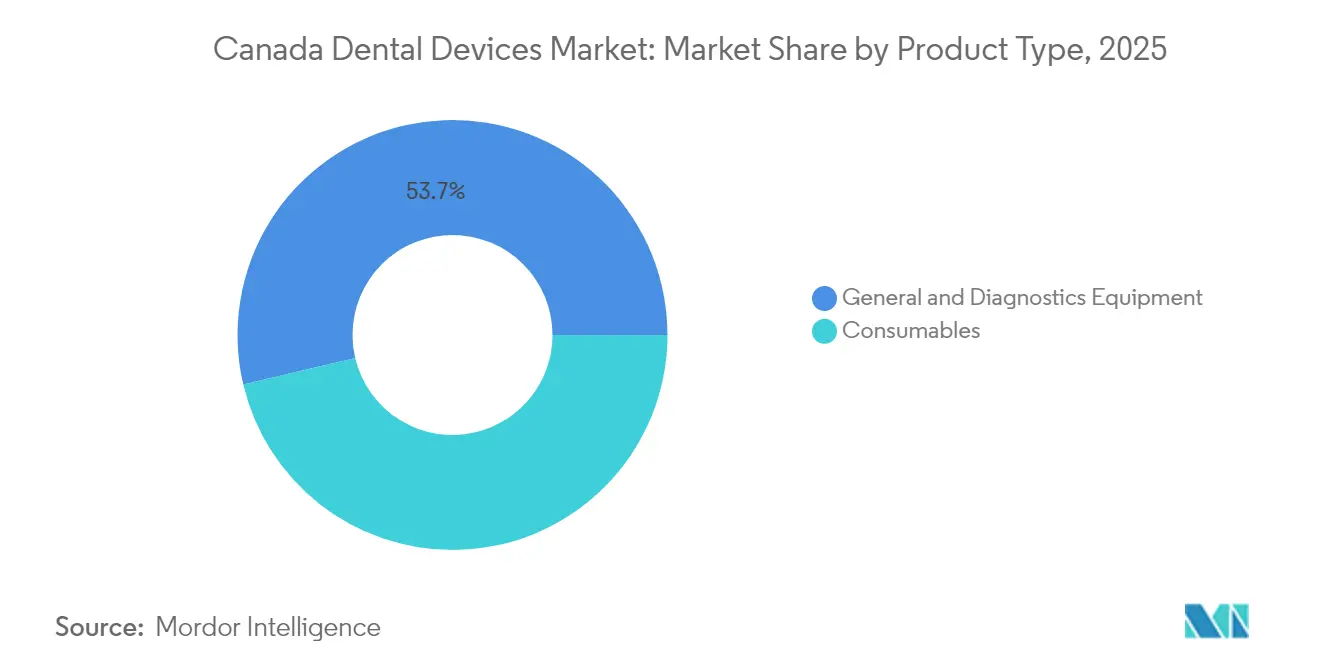
- By product type, dental devices captured 53.70% of the Canadian dental devices market share in 2025, whereas dental consumables are forecast to expand at the fastest rate of 6.45% CAGR through 2031.
- By treatment type, prosthodontic procedures held 42.85% of the Canadian dental devices market share in 2025, whereas peridontic treatments are forecast to expand at the fastest rate of 6.87% CAGR through 2031.
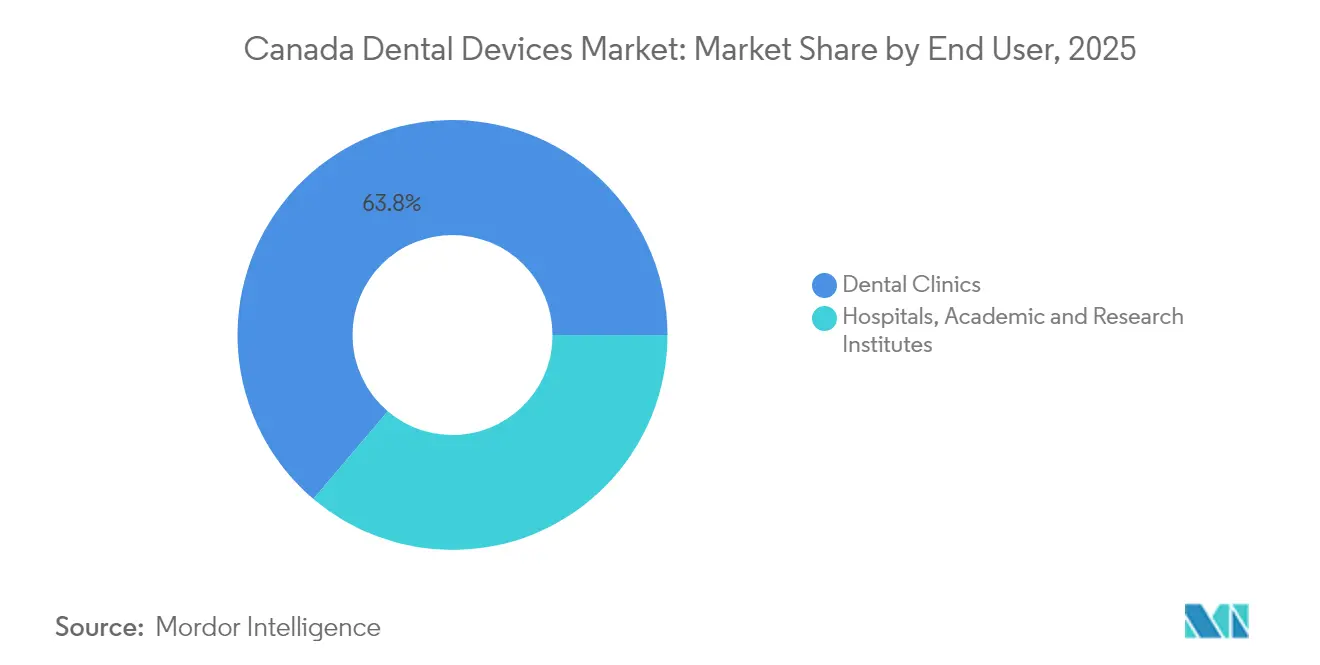
- By end user, dental clinics captured 63.80% of the Canadian dental devices market share in 2025, whereas academic and research institutes are forecast to expand at the fastest rate of 6.62% CAGR through 2031
Note: Market size and forecast figures in this report are generated using Mordor Intelligence’s proprietary estimation framework, updated with the latest available data and insights as of 2026.
Canada Dental Devices Market Trends and Insights
Drivers Impact Analysis*
| Driver | (~) % Impact on CAGR Forecast | Geographic Relevance | Impact Timeline |
|---|---|---|---|
| Ageing Population Increasing Dental Care Expenditure | +1.2% | National, with concentration in Ontario, Quebec, and British Columbia | Long term (≥5 yrs) |
| Government Dental-Care Plan Expansion Boosting Device Uptake | +2.0% | National, with higher impact in provinces with lower private insurance coverage | Medium term (≈3-4 yrs) |
| Rising Demand for Cosmetic Dentistry in Urban Centers | +0.8% | Urban centers in Ontario, British Columbia, Alberta, and Quebec | Medium term (≈3-4 yrs) |
| Growth of Group Dental Practices & Corporate Chains Driving Procurement | +0.7% | National, with concentration in urban and suburban areas | Medium term (≈3-4 yrs) |
| Influx of Foreign-Trained Dentists Increasing Procedure Volumes | +0.3% | Rural and underserved provinces, particularly in Atlantic Canada and Northern territories | Short term (≤2 yrs) |
| Adoption of Digital Dentistry Workflows by Canadian Clinics | +0.9% | National, with higher adoption in urban centers and academic institutions | Medium term (≈3-4 yrs) |
| Source: Mordor Intelligence | |||
Ageing Population Increasing Dental Care Expenditure Across Canada
A 2024 Statistics Canada survey shows that 72.5 % of seniors secured a dental visit in the previous year, an uptick driven by insurance coverage under the CDCP. Clinics are ordering low-entry chairs with reinforced armrests because mobility limitations have moved from niche to mainstream design criteria. Practices that target older adults pair these chairs with cone-beam CT scanners, recognizing that geriatric cases often need comprehensive diagnostics. Devices vendors now promote extended warranties, reflecting clinic caution over repair-related downtime.
Government Dental-Care Plan Expansion Boosting Device Uptake
The CDCP allocates USD 13 billion across five years and already covers more than two million seniors [2]Statistics Canada - "Factors associated with the use of oral health care services among seniors in Canada." June 19, 2024. Enrollment momentum is triggering replacement of analog panoramic units with digital hybrids that handle higher throughput. Distributors are stocking mid-tier scanners calibrated to fit CDCP fee caps, a tactic that accelerates inventory turnover. Clinics adding multi-disciplinary operatories to serve children and disabled adults are installing universal delivery systems that accept quick-swap hand-pieces, indirectly boosting modular cabinetry sales.
Rising Demand for Cosmetic Dentistry in Urban Centers
Metropolitan practices in Toronto, Vancouver, and Montréal report growing wait lists for whitening and soft-tissue contouring, prompting rapid uptake of diode and Er:YAG lasers dj.mdpi.com. Although cosmetic procedures remain outside CDCP reimbursement, higher urban disposable incomes sustain demand and encourage clinics to differentiate via technology. Social-media marketing centered on laser capability is raising patient expectations even for routine visits, nudging mid-sized practices toward tech refreshes. Leasing contracts with upgrade clauses offer a convenient route to keep devices “showroom new” without tying up capital.
Growth of Group Dental Practices & Corporate Chains Driving Procurement
Dentalcorp’s network now exceeds 550 sites, granting it bulk-purchase leverage that shapes supplier strategies. Chains impose standardized equipment lists that favor full-portfolio vendors capable of guaranteed national supply. Rapid onboarding of acquisitions forces corporate buyers to select plug-and-play radiography bundles, accelerating turnkey package shipments. Independent clinics subsequently face longer lead times when chain orders consume early production runs, so smaller offices are scheduling purchases further in advance.
Restraints Impact Analysis*
| Restraint | (~) % Impact on CAGR Forecast | Geographic Relevance | Impact Timeline |
|---|---|---|---|
| High Capital Cost of Advanced Imaging and CAD/CAM Equipment | -0.8% | Rural areas and independent practices nationwide | Medium term (≈3-4 yrs) |
| Limited Reimbursement for Implant & Aesthetic Procedures | -0.5% | National, with higher impact in lower-income regions | Long term (≥5 yrs) |
| Supply-Chain Exposure to U.S. Border Delays and Currency Fluctuations | -0.6% | National, with higher impact on practices dependent on just-in-time inventory | Short term (≤2 yrs) |
| Fragmented Regulatory Pathway for 3-D-Printed Custom Devices | -0.3% | National, with higher impact on innovative practices and laboratories | Long term (≥5 yrs) |
| Source: Mordor Intelligence | |||
High Capital Cost of Advanced Imaging and CAD/CAM Equipment for Small Clinics
A cone-beam CT unit can run near USD 90 000, well above annual gross revenues at many rural offices. CDCP reimbursement averages roughly two-thirds of provincial fee guides, compressing margins on covered services. Subscription models that bundle hardware, software, and service for one monthly fee are gaining favor among sole proprietors who need technology but lack cash reserves. Community health centers have begun sharing mobile imaging vans, hinting at a peer-to-peer rental micro-market emerging in remote regions.
Limited Reimbursement for Implant & Aesthetic Procedures
Implant therapy and purely cosmetic work remain outside CDCP coverage servicecanada.gc.ca. Vendors position implant motors and aesthetic lasers as reputation builders rather than immediate revenue drivers, and device shipments correlate more with neighborhood income levels than with patient counts. Middle-income clinics postpone such investments, widening the technology gap between urban cores and smaller municipalities.
*Our forecasts treat driver/restraint impacts as directional, not additive. The impact forecasts reflect baseline growth, mix effects, and variable interactions.
Segment Analysis
By Product Type: Consumables Outpace Devices Growth
The consumables segment holds a 46.30 % Canadian dental devices market share in 2025 and is forecast to expand with a 6.45 % CAGR through 2031, buoyed by CDCP-driven growth in scaling, fluoride varnish, and pediatric sealant applications. Clinics enrolling in the program gravitate toward single-use items that carry short lead times, reflecting cautious capital allocation while reimbursement policies stabilize. Suppliers bundling infection-control guides with shipments experience higher reorder rates, signaling that educational value now sways brand loyalty. Digital logistics dashboards tracking batch-level expiration dates are becoming a standard request in distributor contracts.
Digital radiography and chair-side CAD/CAM collectively command the largest devices market size share, though growth moderates to roughly 4.8 % as first-cycle adopters conclude upgrades. Manufacturers stress low-dose performance to satisfy Safety Code 30, indicating patient radiation awareness shapes marketing narratives. AI overlays drive secondary sensor sales because legacy detectors lack integration ports, encouraging clinics to refresh sooner than depreciation schedules dictate. Chair makers adding USB-C hubs into armrests reveal that data connectivity is no longer a premium extra but a baseline expectation.



By Treatment: Periodontic Procedures Drive devices Innovation
Periodontic procedures post a 6.87 % forecast CAGR, faster than any other treatment category, reflecting heightened awareness of links between gum inflammation and cardiovascular health. Clinics scaling periodontal offerings routinely purchase ultrasonic scalers with disposable tips, boosting recurring consumable demand alongside hardware sales. Soft-tissue lasers enhance patient comfort and cut chair time, enabling higher daily throughput in urban settings where appointment backlogs are common. Growing emphasis on minimally invasive therapy suggests future demand for low-heat laser modalities.
Prosthodontics captures 42.85 % Canadian dental devices market size in 2025, propelled by aging patients opting for implant-supported dentures. Digital impression scanners eliminate messy molds and shorten crown fabrication cycles, prompting dental labs to invest in compatible milling units that lift upstream capital spend. Orthodontic providers shift toward clear aligners, nudging clinics to purchase 3-D printers for in-house model production, an adjacent opportunity for resin suppliers. Endodontic volumes rise with the widespread use of torque-controlled rotary files, but lower capital intensity keeps its revenue contribution behind imaging.
By End User: Academic Institutions Emerge as Growth Leaders
Dental clinics represent 63.80 % Canadian dental devices market share in 2025 and continue to expand at a steady 5.75 % CAGR as CDCP enrollment swells appointment books. Newly added operatories often feature compact multi-function delivery units that conserve floor space and accommodate quick-swap hand-pieces, illustrating how utilization pressure shapes room design. Independent offices in cost-sensitive regions rely on refurbished chairs, signaling a secondary-market dynamic that could moderate fresh unit sales if supply outpaces demand. High-definition intraoral cameras bundled with cloud storage are creeping toward baseline specification, raising data-privacy compliance questions for solo practices.
Academic and research institutes are projected to grow at a 6.62 % CAGR, fueled by provincial funding designed to widen the dentist pipeline. Renovated simulation labs install ambidextrous chairs and digital scanners so graduates enter the workforce fluent with common technologies, fostering latent brand loyalty for devices makers. Collaborative research projects on early caries detection—such as the photothermal radiometry-based “Canary” system—attract industry sponsorship, feeding a feedback loop between academia and vendors. Dental hospitals, though smaller in number, align procurement with multidisciplinary care, ordering surgical microscopes and cone-beam CT units together to support complex maxillofacial interventions.
Geography Analysis
Ontario, Quebec, and British Columbia account for over half of Canadian dental devices sales, buoyed by dense populations, multiple dental schools, and well-funded venture ecosystems that speed adoption of AI-enhanced imaging. Vendors routinely pilot new products in Greater Toronto, where high patient throughput provides rapid feedback, and successful launches ripple nationwide within two fiscal cycles. This urban focus sets technology benchmarks that rural clinics feel compelled to match, steadily raising the national baseline for chairside devices.
The rest of Canada shows divergent patterns. Alberta, Saskatchewan, and Manitoba are expanding their share as stronger household finances and rural subsidy programs lift laser and basic imaging purchases, though lower dentist density keeps replacement cycles longer outside major cities. Atlantic provinces and Northern territories feel the greatest CDCP boost; low private-insurance penetration and a USD 250 million Oral Health Access Fund drive demand for rugged, portable diagnostics suited to harsh climates. Tele-dentistry pilots and seasonal tourist influxes further fuel interest in compact, battery-powered imaging kits and short-term devices rentals
Regulatory Landscape
Health Canada regulates dental devices under the Food and Drugs Act and the Medical Devices Regulations (SOR/98-282), using a risk-based classification system (Class I to IV). Many dental instruments fall under Class I, where importers, manufacturers, and distributors typically operate via a Medical Device Establishment Licence (MDEL), while higher-risk products require a Medical Device Licence (MDL). This split affects both time-to-market and ongoing compliance costs.
The oversight focus is moving toward lifecycle controls and digital submission processes. As of January 1, 2026, Health Canada expanded its authority to impose terms and conditions on market authorizations for Class II to IV devices, increasing the need for post-market surveillance readiness for imaging, software, and other higher-risk dental technologies. Separately, Health Canada finalized amendments in June 2026 that remove the requirement for MDEL holders to import exclusively from foreign distributors that also hold an MDEL, which simplifies cross-border sourcing structures for Canadian dental supply chains.
Competitive Landscape
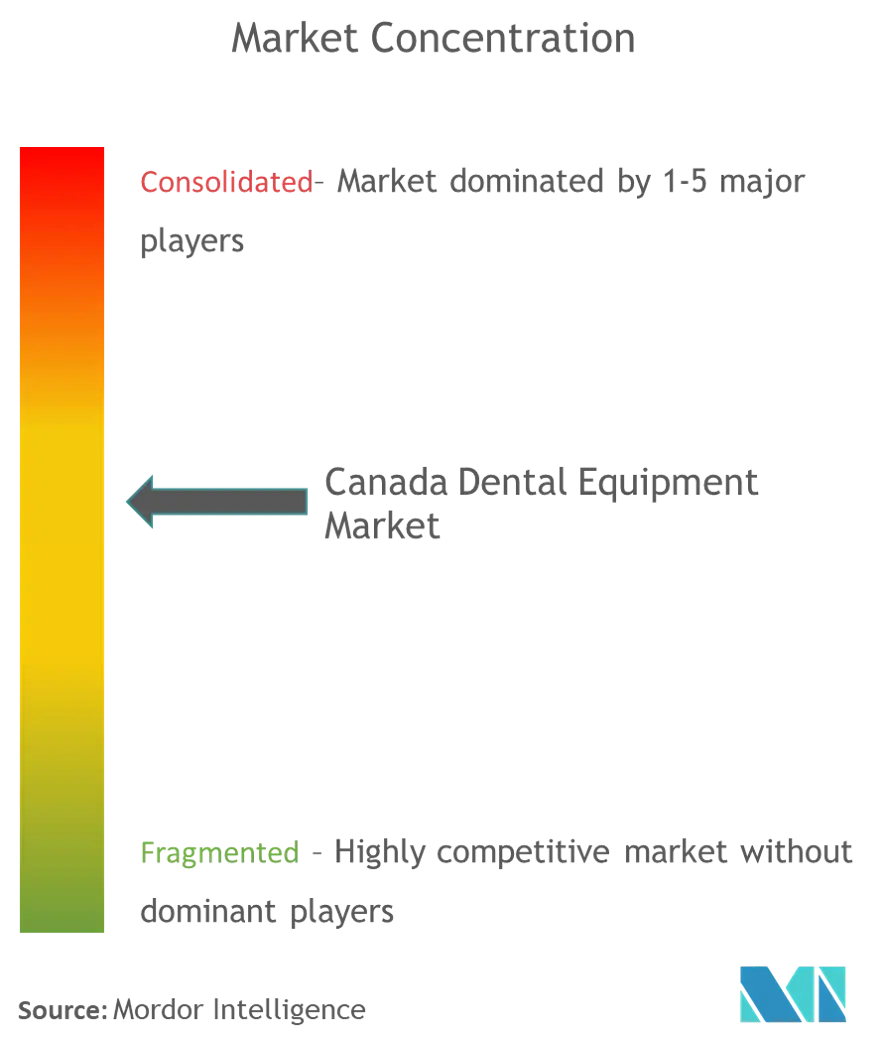
The Canadian dental devices industry is moderately concentrated, with global leaders such as Dentsply Sirona and Envista competing alongside agile domestic specialists. Corporate chains—including Dentalcorp—secure nationwide, bilingual service contracts that lock in preferred vendors for multi-year cycles, raising entry barriers for smaller manufacturers and lowering per-unit costs through bulk orders. These agreements increasingly bundle on-site training and maintenance, reinforcing the value of integrated, full-suite portfolios over stand-alone products.
Competition is also intensifying around AI-enabled software layers that bolt onto existing sensors; start-ups leverage rapid development cycles to out-innovate the five-year hardware refresh rhythm, pressuring legacy firms to open APIs or pursue acquisitions to stay relevant. Health Canada’s 2024 Medical Devices Regulation update ratcheted up documentation requirements, favoring suppliers able to absorb compliance costs across multiple markets. Interoperability with provincial e-health portals has emerged as a decisive buying criterion, shifting some bargaining power toward software vendors that guarantee seamless data flow. Niche opportunities remain in lightweight pediatric chairs and high-load geriatric models aligned with CDCP priorities, but few companies yet offer dual-platform lines.
Canada Dental Devices Industry Leaders
-
3M
-
Dentsply Sirona
-
Carestream Health
-
A-Dec Inc.
-
Patterson Companies Inc.
- *Disclaimer: Major Players sorted in no particular order

Market Opportunities and Future Outlook
CDCP-driven utilization, along with recent federal administration updates, is shifting procurement toward throughput-oriented and compliance-ready equipment. That creates room for vendors that package mid-tier imaging, delivery units, and maintenance into predictable service models. The CDCP allocates USD 13 billion over five years, and the program has expanded covered patient volumes, which has reinforced replacement cycles for digital radiography, ergonomic chairs, and integrated workflow software designed to support higher appointment density under fee caps.
On the supply side, Health Canada is standardizing digital regulatory operations and raising requirements for evidence and post-market controls. This opens near-term opportunities for manufacturers and distributors with mature quality systems and Canada-ready documentation. Mandatory use of the Regulatory Enrolment Process (REP) and the Common Electronic Submission Gateway (CESG) for most medical device regulatory transactions took effect April 1, 2026, and Health Canada also released new and revised guidance in March/April 2026 covering post-market surveillance and AI-enabled devices, including Predetermined Change Control Plan (PCCP) concepts. For dental technology suppliers, these steps support demand for compliant AI-ready imaging and analytics layers, while favoring Canadian distributors that can operationalize electronic submissions, track device changes, and maintain auditable service and complaint-handling processes at scale.
Recent Industry Developments
- June 2026: Dentsply Sirona partnered with the Canadian Dental Association (CDA) on the Student Clinician Research Program. The collaboration reinforces vendor presence in Canadian dental schools and helps seed familiarity with specific clinical workflows and materials among new graduates.
- July 2025: Solventum provided a CAD 121,900 product grant to Dalhousie University Faculty of Dentistry to support student training and patient care. Product access in teaching clinics can influence standardization choices and long-run purchasing preferences as students transition into practice.
- December 2024: 3M issued a recall in Canada for Transbond Plus Self Etching Primer tied to component mixing issues within L-pop compartments. The action increased near-term supply and substitution planning needs for orthodontic bonding materials and underscored the importance of active recall monitoring in distributor and clinic inventory systems.


Research Methodology Framework and Report Scope
Market Definition and Coverage
For this methodology, the Canada dental devices market includes revenue from dental equipment and diagnostic devices, along with dental consumables used in prevention, diagnosis, and treatment delivered by dental care settings in Canada.
Scope exclusions: We exclude non-dental medical devices and general hospital capital equipment that is not primarily used for dental procedures.
Segmentation Overview
-
By Product
-
General and Diagnostics Equipment
-
Dental Laser
- Soft Tissue Lasers
- Hard Tissue Lasers
-
Radiology Equipment
- Extra Oral Radiology Equipment
- Intra-oral Radiology Equipment
- Dental Chair and Equipment
- Other General and Diagnostic equipment
-
Dental Laser
-
Dental Consumables
- Dental Biomaterial
- Dental Implants
- Crowns and Bridges
- Other Dental Consumables
- Other Dental Devices
-
General and Diagnostics Equipment
-
By Treatment
- Orthodontic
- Endodontic
- Peridontic
- Prosthodontic
-
By End User
- Dental Hospitals
- Dental Clinics
- Academic & Research Institutes
Data Sources, Market Sizing, and Validation
Desk Research
Desk research is used to set the structure of the market model and to anchor assumptions that must stay realistic year over year. We begin with public health and demographic signals that link to dental utilization, then we map these to device adoption and replacement behavior across clinics and labs.
Key sources include Health Canada device and safety updates, Statistics Canada population and income indicators, the Canadian Institute for Health Information for broader care delivery context, the Canadian Dental Association for practice and utilization viewpoints, and the Canadian Agency for Drugs and Technologies in Health for evidence reviews where relevant. We also review company filings, investor presentations, reputable press, and trade publications, and we use a paid subscription for company financials and news context. Patent databases and import-export shipment level data are added where they help validate product flow. These examples are not exhaustive, and other public and paid sources were also used for data collection, validation, and clarification.
Primary Interviews and Surveys
Primary interviews and surveys are used to pressure test what was built from desk signals, especially around pricing, purchasing cycles, and how products are counted as a device versus a consumable in real procurement. We spoke with a mix of manufacturers, distributors, dental clinic operators, lab owners, and category specialists across Canada, so missing splits could be filled and assumptions triangulated across the channel.
Distribution of primary research fieldwork respondents
| Company type | Respondent position |
|---|---|
| Top tier: 27% | CXOs: 12% |
| Mid tier: 58% | Functional/Unit leaders: 30% |
| Smaller Players: 15% | Managers: 58% |
Market-Sizing & Forecasting
The market sizing model starts with a top-down demand pool, rebuilt using Canada dental utilization and procedure mix, then converted into equipment and consumables demand using adoption and replacement logic. Totals are corroborated using selective bottom-up checks, such as a roll-up of sampled supplier revenue, channel-mix checks, and volume-by-ASP approximations for common categories.
Model inputs include the number of active dental practices and chairs, patient visit frequency and procedure mix, penetration of digital dentistry tools, replacement cycles for imaging and operatory equipment, and the share of procedures that use implants, restorative materials, or infection control consumables. Pricing is handled through an ASP ladder that separates capital equipment from single-use items, then adjusts for product mix changes rather than applying one flat inflation factor.
For forecasting, scenario analysis is used with a short list of drivers agreed during interviews, supported by simple time series smoothing on stable indicators where year-to-year volatility is low. When bottom-up data is incomplete for a niche category, gaps are handled through proxy ratios tied to procedure volumes, and then re-validated with interview feedback before finalizing the totals.
Data Validation & Update Cycle
Outputs are checked against independent signals, including import patterns for major device types, practice activity indicators, and observed pricing movement in commonly purchased categories. Where large variance shows up, assumptions are reopened, outliers are investigated, and follow-up calls are triggered to confirm whether it is a real market shift or a modeling artifact.
Before sign-off, the model is reviewed in multiple steps, starting with analyst cross-checks and followed by internal peer review focused on scope consistency and arithmetic integrity. The report is refreshed annually, and interim updates are made when material events occur, such as policy changes, major reimbursement shifts, or sharp currency moves affecting ASPs. Right before delivery, a final pass is completed so the figures reflect the latest validated inputs.
Mordor Intelligence's Canada Dental Devices Market Size Versus Other Published Estimates
Different publishers can land on different market sizes for Canada dental devices, even when they describe similar product groups, because the counting rules are not identical. The biggest swings usually come from whether consumables are included, which year is treated as the base, and how pricing is updated when currencies and product mix change.
Refresh cadence and currency timing also matter because ASPs for imported equipment can shift within the year, and the device-to-consumable split can change the total quickly. In this study, quarterly price checks and variance flags were applied before numbers were locked, which is why Mordor Intelligence shows a smaller 2025 value aligned to a devices-only boundary rather than a broader consumables plus equipment bundle.
Benchmark comparison
| Source | Market Size | Gaps in Research Methodology |
|---|---|---|
| Mordor Intelligence | USD 462.57 M (2025) | |
| Global Consultancy A | USD 635.40 M (2023) | Uses an equipment-only scope with a different base year, which can inflate the apparent level when compared to a later-year devices definition that separates consumables and resets ASPs with recent currency movement. |
| Industry Research Publisher B | USD 1.56 B (2025) | Bundles dental consumables together with equipment, so high-throughput items like restorative and infection control categories expand the market beyond devices and make the total not directly comparable. |
The spread across the three numbers is mainly explained by scope boundaries and timing choices, not by a disagreement on underlying demand. When the same year and the same device-versus-consumable rules are applied, the range narrows, and the remaining variance typically comes from how ASP progression and imports sensitivity are handled.


Key Questions Answered in the Report
What is the projected CAGR for the Canadian dental devices market between 2026 and 2031?
The industry is expected to expand at 5.93 % CAGR, lifted by CDCP funding and an aging population.
Which is the current market size of the Canada dental devices market?
The Canada dental devices market size is USD 490.02 million in 2026 and is projected to reach USD 653.58 million by 2031.
How does the Canadian Dental Care Plan influence devices purchasing?
The CDCP broadens insurance coverage, prompting clinics to invest in imaging, ergonomic chairs, and digital workflows to handle rising patient loads.
Why is periodontic devices seeing rapid growth?
Clinical focus on links between gum health and systemic disease fuels demand for ultrasonic scalers and soft-tissue lasers.
Which provinces dominate Canadian dental devices market size?
Ontario, Quebec, and British Columbia collectively hold the largest share, buoyed by dense populations and multiple dental schools.
What financing models help small clinics adopt advanced technology?
Subscription and leasing models that bundle hardware, software, and maintenance into predictable monthly fees are becoming widely adopted among independent practices.
Page last updated on:





