
Periodontal Market Size and Share
Market Overview
| Study Period | 2020 - 2031 |
|---|---|
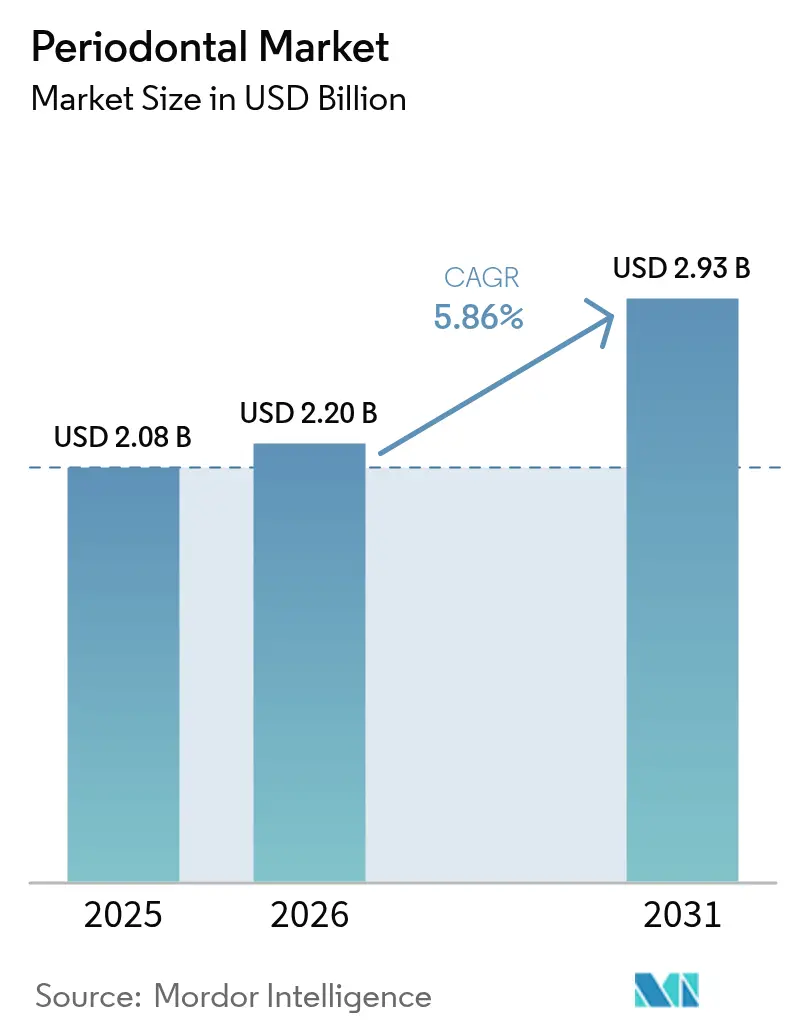
| Market Size (2026) | USD 2.2 Billion |
| Market Size (2031) | USD 2.93 Billion |
| Growth Rate (2026 - 2031) | 5.86 % |
| Fastest Growing Market | Asia-Pacific |
| Largest Market | North America |
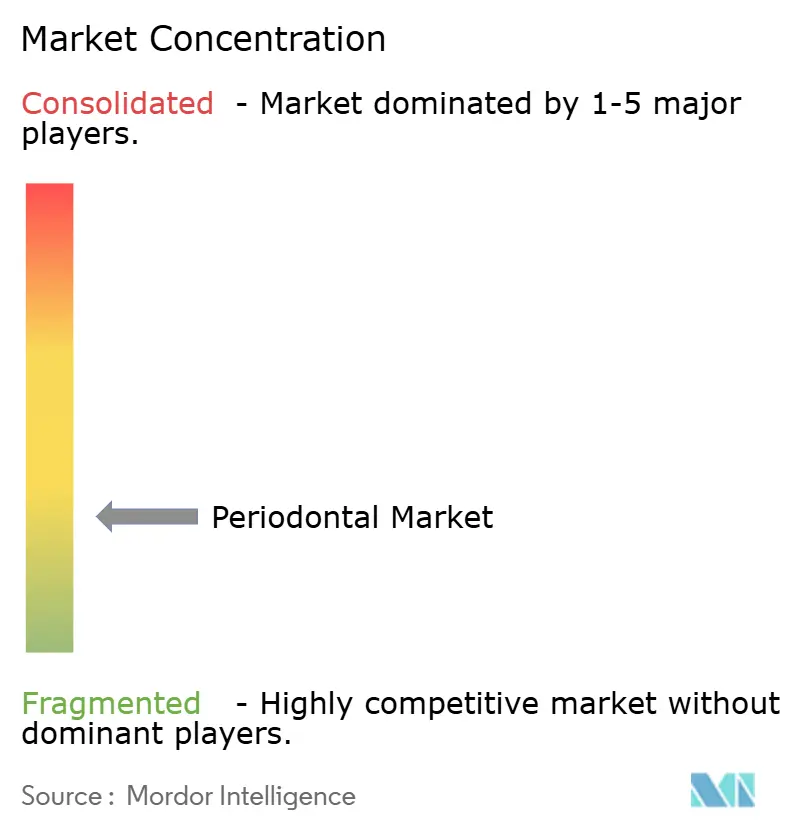
| Market Concentration | Low |
Major Players *Disclaimer: Major Players sorted in no particular order Image © Mordor Intelligence. Reuse requires attribution under CC BY 4.0. | |
Periodontal Market Analysis by Mordor Intelligence
The periodontal market size is expected to grow from USD 2.08 billion in 2025 to USD 2.2 billion in 2026 and is forecast to reach USD 2.93 billion by 2031 at 5.86% CAGR over 2026-2031. Advancing regenerative devices, rising dental‐insurance penetration, and a pronounced shift toward minimally invasive care are accelerating demand. An aging global population—with severe periodontitis cases projected to climb from 1 billion in 2021 to 1.56 billion by 2050—anchors long-term procedure volumes. The periodontal market is also benefitting from cosmetic dentistry’s social-media-driven boom, stronger links between oral and systemic health in reimbursement policy, and continuous product launches that shorten chair time. Conversely, high treatment costs in emerging economies and shortages of specialized clinicians in rural areas restrain growth momentum.
Key Report Takeaways
- By product category, equipment led with 55.05% of periodontal market share in 2025, while consumables are projected to post the fastest 6.05% CAGR to 2031.
- By disease, gingivitis accounted for 46.40% share of the periodontal market size in 2025, whereas aggressive periodontitis is projected to expand at 6.42% CAGR through 2031.
- By treatment, non-surgical approaches held 60.75% share in 2025; surgical therapies are set to rise at a 6.83% CAGR as regenerative materials mature.
- By end user, dental clinics commanded 53.10% of revenue in 2025 and are forecast to grow at 7.21% CAGR to 2031.
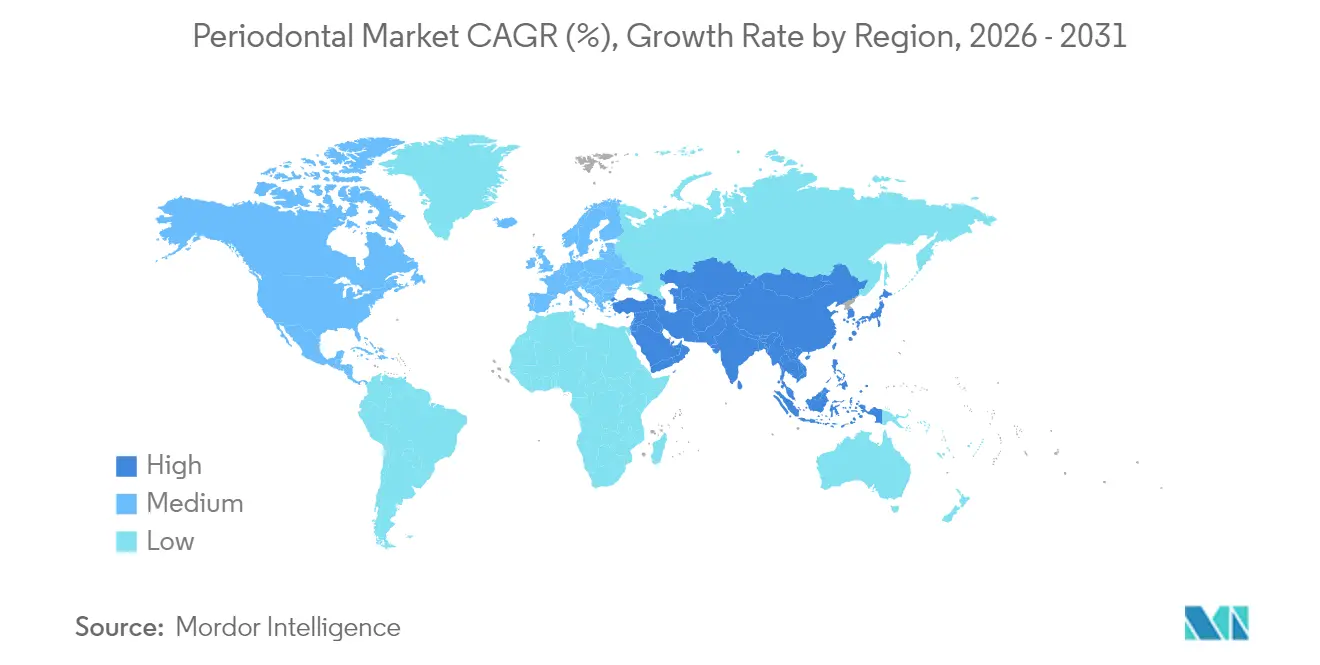
- By geography, North America retained 41.70% revenue share in 2025; Asia-Pacific is expected to be the fastest-growing region at 7.66% CAGR through 2031.
Note: Market size and forecast figures in this report are generated using Mordor Intelligence’s proprietary estimation framework, updated with the latest available data and insights as of 2026.
Market Trends and Insights
Drivers Impact Analysis of Periodontal Market*
| Driver | (~) % Impact on CAGR Forecast | Geographic Relevance | Impact Timeline |
|---|---|---|---|
| Rising prevalence of periodontal diseases among ageing populations | +1.8% | Global, with concentration in North America, Europe, and Japan | Long term (≥ 4 years) |
| Growing demand for cosmetic & aesthetic dentistry | +1.2% | North America, Europe, and urban Asia-Pacific | Medium term (2-4 years) |
| Technological shift toward minimally-invasive laser & regenerative therapies | +1.5% | Global, led by North America and Europe | Medium term (2-4 years) |
| Expanding dental-insurance coverage in high-income economies | +0.9% | North America, Europe, and select Asia-Pacific markets | Short term (≤ 2 years) |
| Home-use photodynamic devices improving patient compliance | +0.4% | North America and Europe initially, expanding to Asia-Pacific | Medium term (2-4 years) |
| AI-driven risk-analytics inside DSOs enabling preventive outreach | +0.3% | North America primarily, with expansion to Europe | Short term (≤ 2 years) |
| Source: Mordor Intelligence | |||
Rising prevalence of periodontal diseases among ageing populations
Rapid population ageing is elevating disease burden: nearly 70% of adults over 65 in high-income economies exhibit some periodontitis, while senescent cells intensify inflammation that standard debridement alone cannot resolve. Healthcare systems are integrating periodontal screening into chronic-disease programmes, reinforcing a solid demand pipeline that sustains the periodontal market over the long term.
Growing demand for cosmetic & aesthetic dentistry
Video-conferencing culture and social-media visibility have recalibrated patient expectations toward seamless function and facial harmony. Digital scanners and chairside 3-D printing enable clinicians to merge regenerative periodontal surgery with smile-design workflows, drawing younger cohorts into the periodotal treatment market. Insurers now reimburse aesthetic-linked periodontal procedures when systemic health benefits are documented, further widening the addressable base.
Technological shift toward minimally-invasive laser & regenerative therapies
Diode and Er:YAG lasers deliver precise decontamination and tissue preservation, achieving deeper pocket-depth reduction than conventional scaling alone. Photodynamic therapy paired with methylene-blue activation curbs antibiotic resistance, while nano-hydroxyapatite scaffolds boost predictable bone fill. These innovations lift procedure acceptance rates and keep the periodontal market on a steady acceleration path.
Expanding dental-insurance coverage in high-income economies
Canada’s 2024 Dental Care Plan and forthcoming U.S. essential-health-benefit rules add adult periodontal benefits, immediately lowering out-of-pocket hurdles. Nine U.S. states broadened Medicaid dental packages in 2024, and 34 now offer unlimited preventive and periodontal services. Short-term volume elasticity from these policy shifts injects new patients into the periodontal market.
Restraints Impact Analysis of Periodontal Market*
| Restraint | (~) % Impact on CAGR Forecast | \ | Impact Timeline |
|---|---|---|---|
| High treatment cost & limited reimbursement in emerging markets | -1.1% | Asia-Pacific (excluding Japan), Latin America, Middle East and Africa | Long term (≥ 4 years) |
| Shortage of specialised periodontists in semi-urban & rural areas | -0.8% | Global, with acute impact in rural North America, Europe, and emerging markets | Medium term (2-4 years) |
| Post-COVID clinic focus on higher-margin restorative work | -0.6% | Global, with concentration in developed markets | Short term (≤ 2 years) |
| Regulatory uncertainty for nano-biomaterials | -0.4% | Global, led by North America and Europe regulatory frameworks | Medium term (2-4 years) |
| Source: Mordor Intelligence | |||
High treatment cost & limited reimbursement in emerging markets
In India only 5% of the population can afford advanced oral care; 80% have never visited a dentist, demonstrating a vast access gap. Import dependence inflates equipment prices, and private payment models dominate. Although local manufacturers are scaling, the affordability barrier continues to slow periodontal market uptake across South and Southeast Asia.
Shortage of specialised periodontists in semi-urban & rural areas
The United States lists 11,909 dental-provider vacancies, while rural ratios can reach 1 dentist per 3,850 residents. Similar gaps exist in Europe and Latin America, capping procedure volumes. Teledentistry pilots and expanded practice rights for dental hygienists mitigate, yet workforce scarcity remains a medium-term drag on the periodontal market.
*Our forecasts treat driver/restraint impacts as directional, not additive. The impact forecasts reflect baseline growth, mix effects, and variable interactions.
Periodontal Market Segment Analysis
By Product:
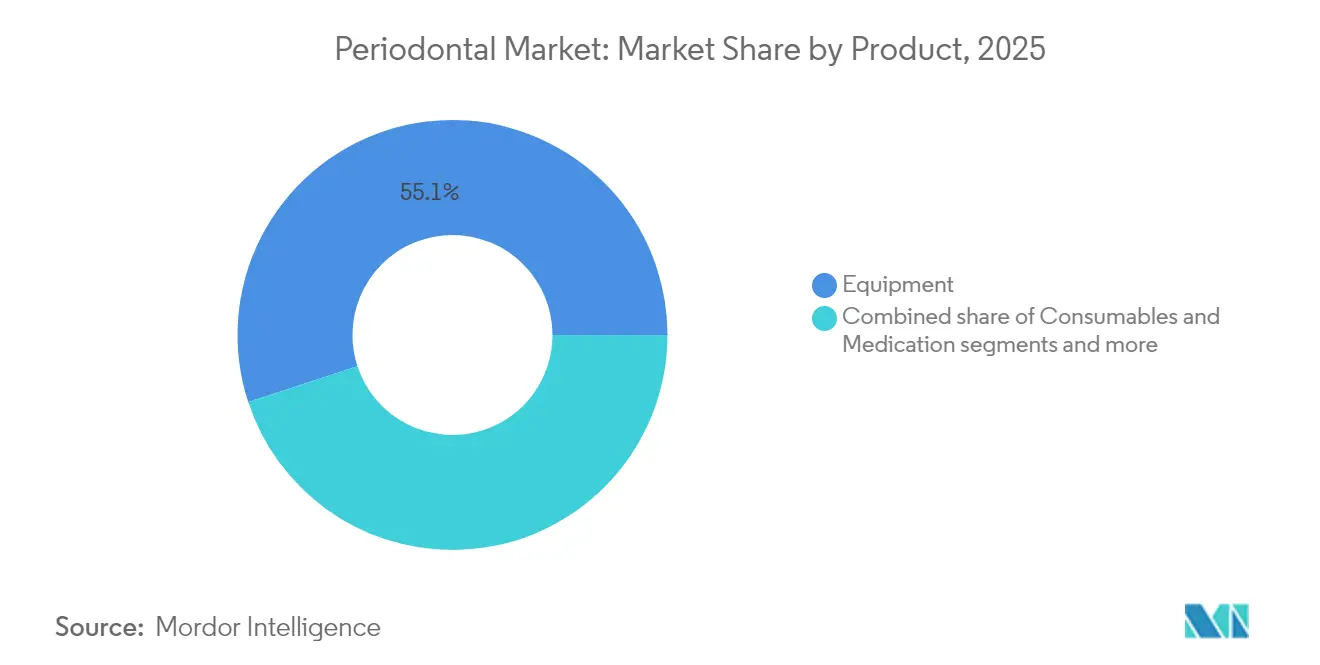
Equipment leadership drives innovationEquipment contributed 55.05% to the periodontal market in 2025 as power-driven scalers, lasers, and CBCT imaging became standard for comprehensive care. Ongoing upgrades in piezoelectric systems and the rising penetration of diode lasers keep average selling prices resilient. Consumables, though smaller, are the fastest advancing slice at a 6.05% CAGR, propelled by regenerative membranes and nano-hydroxyapatite grafts that clinicians reorder frequently. The periodontal market size for regenerative graft materials is set to expand steadily, supported by clinical proof of faster osseointegration.
The medication sub-segment is pivoting toward locally delivered antimicrobials, enabling sustained drug concentrations in periodontal pockets without systemic exposure. Together, these dynamics reinforce the periodontal market trajectory as practices invest in both capital equipment and recurring consumables to stay competitive.



By Disease:
Gingivitis prevalence contrasts with aggressive periodontitis growthGingivitis retained 46.40% share of the periodontal market size in 2025 because routine prophylaxis addresses a broad patient base. Public-health campaigns and employer-sponsored dental wellness have increased early detection, keeping this segment sizeable. Aggressive periodontitis, although smaller, is set to post a 6.42% CAGR to 2031 as improved genetic and biomarker diagnostics allow clinicians to intervene earlier in rapid-destructive cases.
Chronic periodontitis continues to climb with longevity, while necrotizing and medication-related conditions create specialized niches that stimulate innovation in immunomodulatory adjuncts. These multiple disease pathways make the periodontal market a diversified field that rewards flexible product portfolios.
By Treatment:
Surgical innovation accelerates growthNon-surgical care still accounts for 60.75% of 2025 revenue, but surgical treatments are the fastest mover at 6.83% CAGR, reflecting confidence in guided tissue regeneration and growth-factor technologies. Meta-analyses show 3-wall infrabony defects gain superior fill when treated with advanced membranes and autologous platelet concentrates. As a result, clinicians once wary of surgical morbidity now position regenerative surgery as a definitive solution, expanding the periodontal market.
Meanwhile, laser-assisted non-surgical protocols combine pocket decontamination with biostimulation, allowing practices to offer tiered care levels. Medication-only pathways shrink as standalone options but flourish as adjuncts within broader care plans, illustrating how integrated modalities shape the periodontal market.
By End User:
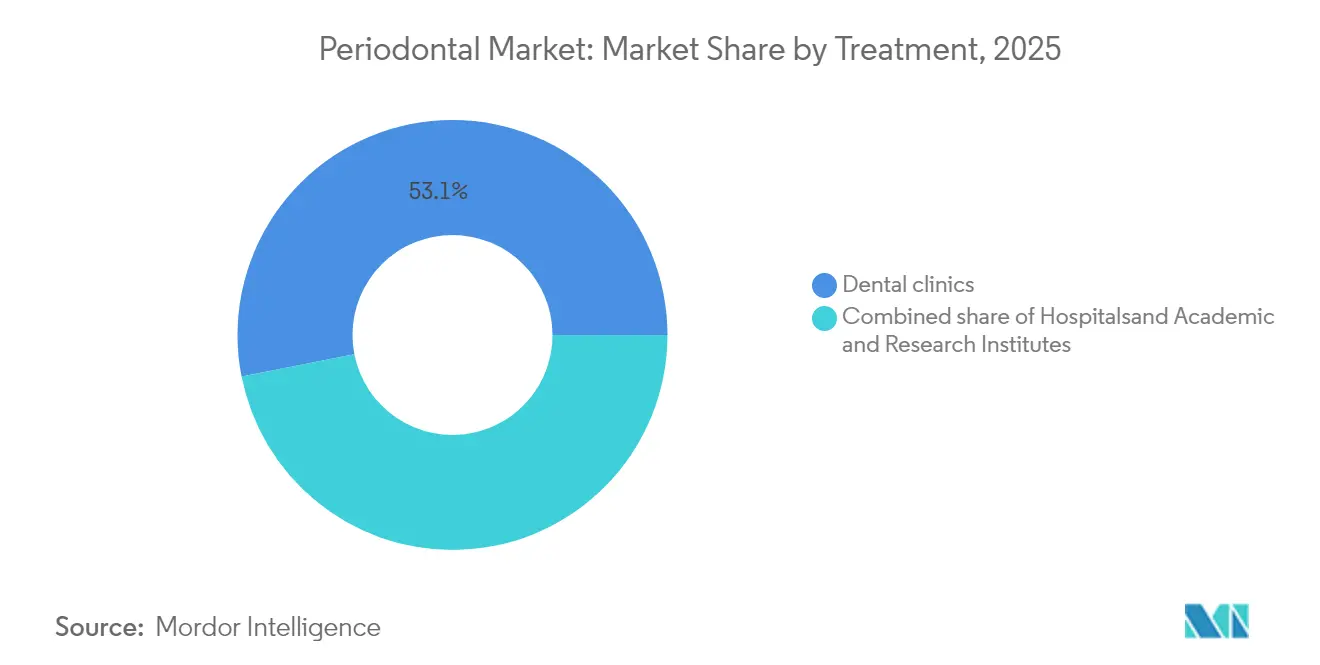
Dental clinics accelerate digital transformationPrivate dental clinics captured 53.10% of spending in 2025 and exhibit the strongest 7.21% CAGR outlook. Consolidated dental service organizations deploy AI-guided analytics, cloud PMS, and same-day workflows to raise throughput, intensifying their pull on suppliers. Hospitals preserve complex surgical referrals but grow slowly; academic centers remain innovation hubs, hosting 248 active periodontitis clinical trials that feed technology transfer into commercial channels.
Collectively, these dynamics ensure each setting contributes distinct revenue streams, keeping the periodontal market diversified across delivery channels.
Geography Analysis
North America Periodontal Market
North America retained 41.70% of 2025 turnover as Medicaid expansions and private-insurance upgrades broadened adult periodontal benefits. Yet provider shortages outside major metros limit penetration speed, prompting mobile clinics and teledentistry pilots. The periodontal market remains robust across Canada, where federal coverage launched in 2024 underwrites comprehensive periodontal services.
APAC Periodontal Market
Asia-Pacific is the primary growth engine at 7.66% CAGR through 2031. China’s implant boom and digitally enabled peri-implant maintenance propel equipment upgrades, while domestic manufacturing—exemplified by Laxmi Dental’s graft production—shrinks import costs for India. Medical-tourism flows to Thailand and South Korea further swell the periodontal market, supported by governmental health-check subsidies that bundle periodontal screening into inbound packages.
Europe, Middle East and LATAM Periodontal Market
Europe benefits from universal insurance and stringent device regulations that safeguard clinical standards. Germany and Switzerland pioneer biomaterial development, with Geistlich’s collagen membranes gaining traction for difficult defects. Southern European economies experience faster growth as EU recovery funds modernize clinics. Latin America and the Middle East show steady demand, especially in urban centers where premium cosmetic dentistry resonates with aspirational consumers, although currency volatility tempers the periodontal market’s potential in the near term.

Regulatory Landscape
Periodontal equipment, instruments, and regenerative materials are handled as medical devices under risk-based frameworks that affect time to market and post-market obligations. In the United States, many periodontal devices are covered under FDA dental-device classifications in 21 CFR Part 872 and commonly follow Class II pathways with special controls, influencing product categories such as ultrasonic scalers and related accessories. For regenerative bone-grafting materials used in dental indications, FDA updated expectations via a Federal Register notice in August 2025 describing animal-study recommendations for 510(k) submissions, raising the bar for preclinical packages and comparability evidence.
In Europe, dental and periodontal devices are governed by Regulation (EU) 2017/745 (MDR), which tightens clinical evaluation, post-market surveillance (PMS), and post-market clinical follow-up (PMCF) requirements, including for some reusable instruments that now require Notified Body involvement. CEN/TR 12401:2025 adds practical guidance on mapping dental devices into MDR risk classes, supporting manufacturer and importer alignment on technical documentation and labeling for conformity assessment. Across regions, adherence to dentistry-focused standards such as ISO 21672-1:2012 (periodontal probes) and ISO 13397-2:2023 (periodontal curettes) supports evidence generation and quality-system alignment for global registrations.
Value Chain Analysis
The periodontal market value chain moves from materials and components into device design, clinical validation, regulated manufacturing, and multi-channel distribution to dental clinics, hospitals, and academic centers. Upstream inputs include medical-grade metals for hand instruments, polymers and ceramics for tips and components, and electronics and optics for imaging and laser platforms. This is followed by R&D, prototyping, and clinical and regulatory workstreams anchored in ISO 13485-aligned quality systems. Production spans precision machining and surface finishing for instruments, cleanroom or controlled processing for regenerative biomaterials and gels, sterilization and packaging, and final release testing to meet regional conformity requirements.
Midstream activity often includes specialized contract manufacturing for items such as micro-injection molded disposable tips or sterile protein-based gel formulations, while OEMs retain tight control over design history files, traceability, and complaint handling given MDR and FDA expectations. Downstream distribution is typically hybrid, with direct sales and service networks for capital equipment (lasers, imaging systems) and dealer or group-purchasing routes for recurring consumables and hand instruments. DSOs also increasingly standardize procurement and use platform-based ordering across clinician networks. Straumann Group's Biora manufacturing site in Malmo, Sweden illustrates how dedicated biomaterials capacity can support periodontal regeneration portfolios and internal group supply, while digital platforms connect ordering, device management, and clinical workflows across larger clinic networks.
Competitive Landscape
The periodontal market is moderately concentrated. Straumann Group produced 11.2% organic revenue growth in Q3 2024 on strong Asia-Pacific demand and new SIRIOS intraoral scanner launches. Dentsply Sirona posted a 3.5% organic sales decline for FY 2024 and is restructuring to lift EBITDA margins and reinforce customer programs.
Henry Schein’s exclusive deal to distribute vVARDIS’s Curodont Repair Fluoride Plus to DSOs underscores distribution power as an entry barrier. FDA guidance released in October 2024 on dental-implant performance criteria adds compliance costs but favors incumbent manufacturers with robust regulatory staff[2]Source: U.S. Food and Drug Administration, “Final Guidance on Dental Implants,” federalregister.gov .
Competitive edges now hinge on integrated digital ecosystems, regenerative portfolios, and region-specific channel depth. Players that harmonize hardware, software, service, and reimbursement advocacy are positioned to outpace the periodontal market average.
Periodontal Industry Leaders
Medtronic PLC
Straumann AG
The 3M Company
Bausch Health Companies
Dentsply Sirona
- *Disclaimer: Major Players sorted in no particular order
Periodontal Market Companies Covered in this Report
- Dentsply Sirona
- Envista Holdings (Nobel Biocare, KaVo Kerr)
- Straumann Group
- 3M
- Henry Schein
- BIOLASE Inc.
- J. Morita Corp.
- Zimmer Biomet
- Geistlich Pharma
- BEGO GmbH
- A-dec
- NSK Nakanishi
- Ultradent Products
- Keystone Dental Group
- Millennium Dental Technologies
- Brasseler USA
- Parkell
- DentalEZ
- AMD Lasers
- Botiss Biomaterials

Market Opportunities and Future Outlook
The most actionable opportunity in periodontal care sits at the intersection of minimally invasive workflows and data-enabled diagnosis, where imaging and analytics can reduce chair time and support consistent decision-making across DSOs and multi-site clinics. Dentsply Sirona's May 2026 launch of Smart View-Detect, an FDA-cleared and CE-marked AI-enabled diagnostic aid integrated into its DS Core platform, points to vendor investment in AI-assisted detection within CBCT workflows. This creates room for adjacent periodontal screening modules, interoperability services, and bundled imaging-to-treatment pathways tied to preventive outreach.
Regenerative consumables and localized therapeutics also offer differentiation where evidence packages and regulatory readiness are strongest. Academic research published in early 2026, including microneedle-based triggerable release concepts and hydrogel approaches targeting periodontal bone repair and the senescent microenvironment, supports a pipeline of advanced local-delivery and tissue-regeneration strategies that can feed device and biomaterial roadmaps. At the same time, EU MDR requirements for clinical evidence, PMS, and PMCF increase the burden on drug-device combination approaches, including antibiotic-releasing local-delivery systems. Suppliers that can assemble consistent technical documentation and clinical evaluation narratives aligned to relevant standards are positioned to reduce friction in Notified Body review.
Recent Industry Developments in Periodontal Market
- June 2026: Straumann Group raised its 2026 profitability guidance, increasing the anticipated core EBIT margin expansion to 140-170 basis points (from 30-60 basis points) and pointing to operational improvements and lower tariffs. The update reinforces the role of manufacturing productivity and supply-chain optimization in protecting margins while sustaining investment in digital and biomaterials portfolios that support periodontal and implant maintenance workflows.
- May 2026: Dentsply Sirona launched Smart View-Detect, an FDA-cleared and CE-marked AI-enabled diagnostic aid for identifying teeth with periapical radiolucencies in CBCT scans, integrated into the DS Core platform. Embedding AI into a cloud workflow supports platform stickiness for imaging-driven treatment planning and helps multi-site dental organizations adopt standardized diagnostics.
- October 2024: The US Food and Drug Administration issued final guidance on endosseous dental implants, outlining safety and performance-based considerations for submissions. The guidance increases compliance emphasis around performance expectations and documentation, which can raise development effort for device makers while favoring suppliers with established regulatory and clinical-evidence capabilities.


Periodontal Market Report Scope and Research Methodology
Market Definition and Coverage
The periodontal market, for this study, covers revenues linked to diagnosing and treating periodontal diseases, including non-surgical care and periodontal surgery that a dental provider uses to manage gum infection and tissue damage.
Scope exclusions: We exclude routine general dentistry services that are not used to treat periodontal disease, along with orthodontics and cosmetic-only procedures.
Segments Covered in This Report
- By Product (Value, USD million)
- Equipment
- Power-Driven Scalers & Ultrasonic Units
- Dental Lasers
- CBCT & Imaging Systems
- Consumables
- Sutures & Hemostats
- Barrier Membranes
- Regenerative Bone-Graft Substitutes
- Medication
- Topical Antibiotics & Antimicrobials
- Systemic Antibiotics
- Equipment
- By Disease (Value, USD million)
- Gingivitis
- Acute Gingivitis
- Recurrent Gingivitis
- Chronic Gingivitis
- Chronic Periodontitis
- Aggressive Periodontitis
- Other Diseases
- Gingivitis
- By Treatment (Value, USD million)
- Non-Surgical Treatment
- Scaling
- Root Planing
- Medication Therapy
- Topical Therapy
- Systemic Therapy
- Surgical Treatment
- Flap Surgery / Pocket-Reduction Therapy
- Soft-Tissue Graft
- Bone Grafting
- Guided Tissue Regeneration
- Other Surgical Treatments
- Non-Surgical Treatment
- By End User (Value, USD million)
- Hospitals
- Dental Clinics
- Academic & Research Institutes
- By Geography (Value, USD million)
- North America
- United States
- Canada
- Mexico
- Europe
- Germany
- United Kingdom
- France
- Italy
- Spain
- Rest of Europe
- Asia-Pacific
- China
- India
- Japan
- South Korea
- Australia
- Rest of Asia-Pacific
- South America
- Brazil
- Argentina
- Rest of South America
- Middle East and Africa
- GCC
- South Africa
- Rest of Middle East and Africa
- North America
Data Sources, Market Sizing, and Validation
Desk Research
Desk research was used to build the demand pool, map typical clinical practice patterns, and set realistic pricing and utilization guardrails before assumptions were tested. We referred to public sources such as the US CDC oral health surveillance, NIH and PubMed-indexed clinical literature, WHO oral health resources, and OECD health statistics to understand periodontitis prevalence, risk factors, and care-seeking behavior.
To translate need into spend, secondary work also used sources such as national health ministries, dental and periodontology association websites, dental insurance or reimbursement summaries published by public bodies, and customs or trade statistics for relevant dental instruments and materials where available. Company filings, investor presentations, and reputable press were checked to understand portfolio exposure and where growth is coming from. A paid subscription set that covers company financials and news, plus patent databases and an import/export shipment-level database, was selectively used to fill data gaps and validate directionally. These are illustrative examples, and many other public sources were also consulted for data collection and cross-checking.
Primary Interviews and Surveys
Primary work focused on validating what is actually used in clinics and hospitals, and how treatment mix changes by disease severity and patient affordability. We spoke with a mix of manufacturers, distributors, dental providers, and clinical experts across APAC, EMEA, and the Americas to confirm therapy split, procedure frequency, and practical ranges for pricing and adoption.
Distribution of primary research fieldwork respondents
| Company type | Respondent position | Region |
|---|---|---|
| Top tier: 34% | CXOs: 12% | APAC: 42% |
| Mid tier: 51% | Functional/Unit leaders: 42% | EMEA: 33% |
| Smaller Players: 15% | Managers: 46% | Americas: 25% |
Market-Sizing & Forecasting
Sizing started with a top-down build where disease prevalence and treated-patient rates were used to reconstruct the addressable pool, which was then translated into procedure volumes across non-surgical therapy and surgical treatment. To keep it practical, we used inputs such as periodontitis prevalence, dental visit rates, share of patients receiving scaling and root planing or periodontal surgery, average number of visits per course of therapy, and typical pricing ranges by setting.
Results were then corroborated with selective bottom-up approximations, including sampled volume-by-country checks, channel feedback on high-running items, and sanity checks on spend per treated patient. When gaps appeared in smaller countries, the missing pieces were bridged using proxy indicators like dentist density, insurance penetration, and historical procedure mix, and then adjusted after expert feedback.
For forecasting, scenario analysis was used to reflect how adoption changes when reimbursement improves or when minimally invasive approaches expand. The forward view was anchored to a small set of drivers that respondents consistently pointed to, including aging population, chronic disease burden, dental insurance coverage, clinic capacity expansion, and patient awareness, and then smoothed so short-term noise did not overstate long-run growth.
Data Validation & Update Cycle
Validation was done in multiple passes so that unusual jumps were caught early and corrected with evidence. We checked the output against independent signals such as procedure trends discussed in public health statistics, import and production direction for key dental items, and the expected relationship between treated cases and dental visit volumes.
Outliers were reviewed by another analyst before sign-off, and follow-up questions were triggered when interview feedback and model outputs did not align on therapy split, pricing, or growth assumptions. The report is refreshed annually, and interim updates are made when material events shift demand, regulation, or care delivery. Before delivery, the model is rechecked and updated so clients receive the latest market view.
Mordor Intelligence's Periodontal Market Size Versus Other Published Estimates
It is normal to see different market sizes for periodontics because publishers do not always count the same therapies, settings of care, or geographic coverage. Differences also show up when one study uses procedure-based demand logic and another leans more on broad dental spending shares.
By tracking treated-patient volumes, procedure mix, and country-level pricing updates, Mordor Intelligence keeps the 2026 total tied to periodontal therapies actually delivered, instead of bundling in adjacent dental categories or using aggressive therapy expansion assumptions.
Benchmark comparison
| Source | Market Size | Gaps in Research Methodology |
|---|---|---|
| Mordor Intelligence | USD 2.20 B (2026) | |
| Global Consultancy A | USD 12.20 B (2025) | This estimate appears to treat the market as a broader periodontal ecosystem that includes a wider set of devices, drugs, and procedures, and it uses a different base year with a longer horizon, which can lift the stated value. |
| Industry Publisher B | USD 12.73 B (2025) | The scope is presented at a higher level, with product and procedure baskets that can overlap with general dental treatment lines. The value is also anchored to a 2025 base with faster stated growth, which increases the gap versus a procedure-led periodontal-only model. |
The comparison mainly shows that scope boundaries and the way procedure activity is converted into revenue can change the headline size by a wide margin. When inputs are kept close to treated cases, therapy split, and realistic price ranges by country, the resulting number is easier to trace back and recheck as conditions change year to year.


Key Questions Answered in the Report
1. What is the current size of the periodontal market?
– The periodontal market size is valued at USD 2.2 billion in 2026 and is projected to reach USD 2.93 billion by 2031.
2. Which product category leads revenue?
– Equipment, including scalers, lasers, and imaging systems, held 55.05% of periodontal market share in 2025.
3. Why is Asia-Pacific the fastest-growing region?
– Economic growth, expanding dental infrastructure, and strong patient inflows in China and India drive a 7.66% CAGR through 2031.
4. Which treatment segment is expanding quickest?
– Surgical procedures featuring regenerative biomaterials are forecast to grow at 6.83% CAGR as clinical evidence mounts.
Page last updated on:





