
Restorative Dentistry Market Size and Share
Market Overview
| Study Period | 2020 - 2031 |
|---|---|
| Market Size (2026) | USD 26.04 Billion |
| Market Size (2031) | USD 37.75 Billion |
| Growth Rate (2026 - 2031) | 7.71 % |
| Fastest Growing Market | Asia-Pacific |
| Largest Market | North America |
| Market Concentration | Medium |
Major Players *Disclaimer: Major Players sorted in no particular order Image © Mordor Intelligence. Reuse requires attribution under CC BY 4.0. | |
Restorative Dentistry Market Analysis by Mordor Intelligence
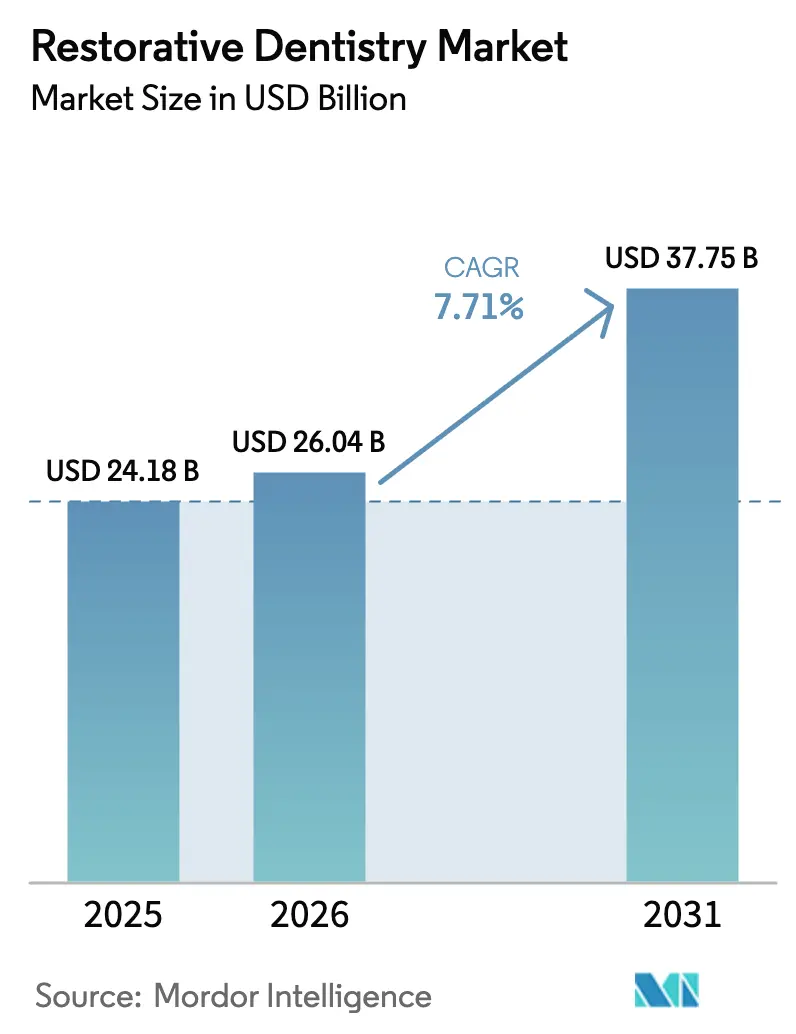
The restorative dentistry market size in 2026 is estimated at USD 26.04 billion, growing from 2025 value of USD 24.18 billion with 2031 projections showing USD 37.75 billion, growing at 7.71% CAGR over 2026-2031. Rising global incidence of dental caries, the rapid adoption of digital workflows, and greater awareness of oral-systemic health links are accelerating procedure volumes and average spending per visit. Ongoing demographic transition toward larger older-adult cohorts is expanding the addressable pool of patients who require complex full-arch and implant-supported restorations. Intensifying consolidation—more than 60 dental mergers and acquisitions totaled USD 9 billion in 2024—signals a competitive shift toward vertically integrated platforms that couple chairside technologies with material innovation. Finally, supportive regulation in high-income countries and steady insurance coverage gains are sustaining premium-priced procedures even as cost pressures mount for providers.
Key Report Takeaways
- By product, restorative materials led with 42.12% of restorative dentistry market share in 2025, while restorative equipment is projected to post the fastest 9.3% CAGR through 2031.
- By end-user, dental hospitals and clinics accounted for 62.95% of the restorative dentistry market size in 2025, whereas dental laboratories are set to expand at a 9.68% CAGR to 2031.
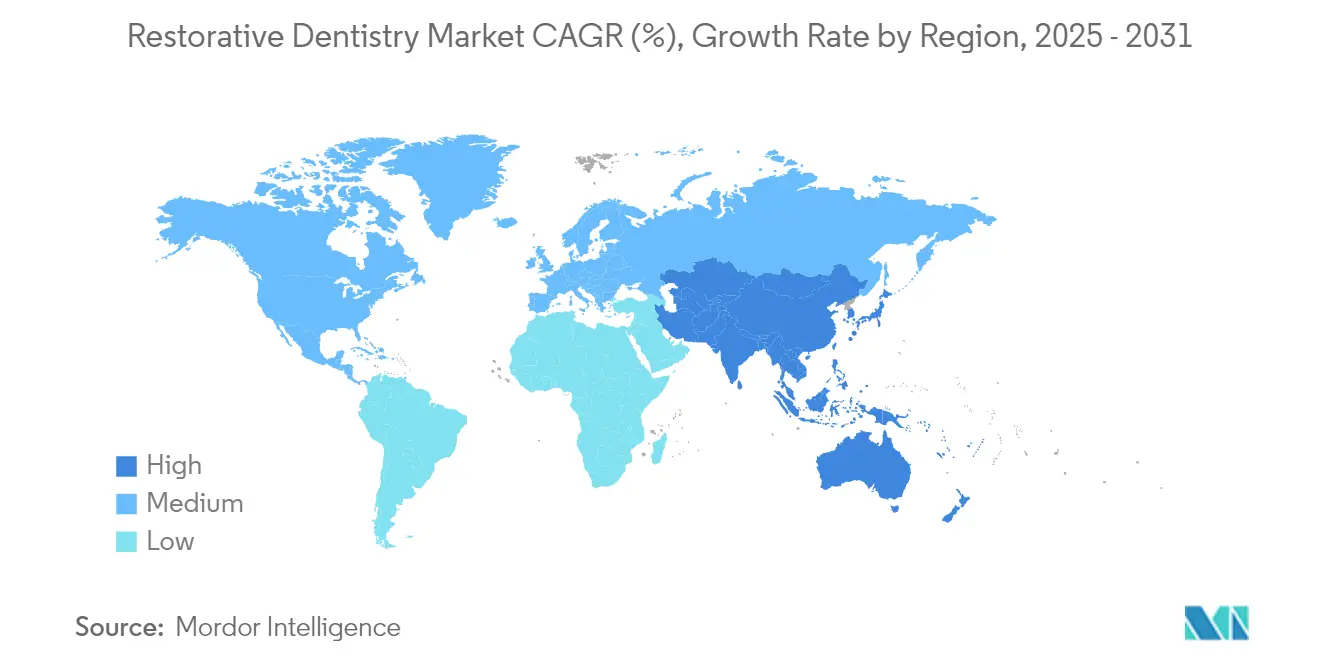
- By geography, North America contributed 39.92% of restorative dentistry market share in 2025, while Asia-Pacific is forecast to register the strongest 8.29% CAGR over the outlook period.
Note: Market size and forecast figures in this report are generated using Mordor Intelligence’s proprietary estimation framework, updated with the latest available data and insights as of 2026.
Global Restorative Dentistry Market Trends and Insights
Drivers Impact Analysis*
| Driver | % Impact on CAGR Forecast | Geographic Relevance | Impact Timeline |
|---|---|---|---|
| Growing prevalence of dental caries & tooth loss | +1.8% | Global; higher impact in developing regions | Long term (≥ 4 years) |
| Rising geriatric population globally | +1.5% | Global; concentrated in North America & Europe | Long term (≥ 4 years) |
| Technological advancements in CAD/CAM & 3D printing | +2.1% | Global; led by North America & Asia-Pacific | Medium term (2-4 years) |
| Increasing demand for cosmetic & aesthetic dentistry | +1.2% | North America, Europe, urban Asia-Pacific | Medium term (2-4 years) |
| Expansion of value-based dental insurance models | +0.8% | Primarily North America & Europe | Short term (≤ 2 years) |
| Integration of teledentistry for postoperative care | +0.4% | Global; accelerated in developed markets | Short term (≤ 2 years) |
| Source: Mordor Intelligence | |||
Growing Prevalence of Dental Caries and Tooth Loss
Worldwide, 2.37 billion caries cases were recorded, and incidence is rising fastest among adolescents and young adults[1]A. Brown, “Robotic Dental Procedures Outpace Humans,” British Dental Journal, nature.com. Untreated periodontal disease costs the United States economy an estimated USD 154 billion each year. In West Africa, some Nigerian studies show caries prevalence as high as 96%, illustrating a sizeable pool of unmet restorative need. Older adults compound clinical complexity because cumulative tooth loss and systemic comorbidities require longer chairtime and multidisciplinary coordination. These epidemiological trends keep procedure volumes high and stimulate ongoing material development that can withstand heavier occlusal loads while preserving esthetics. As a result, the restorative dentistry market continues to widen its customer base across age groups and income segments.
Technological Advancements in CAD/CAM and 3D Printing
Computer-aided design and manufacture now underpin most indirect restorations, delivering finer marginal fit and superior fracture resistance compared with conventional waxing techniques[2]J. Smith et al., “Marginal Fit of Subtractive vs Additive CAD/CAM Crowns,” BMC Oral Health, biomedcentral.com. The arrival of cloud-native intraoral scanners, such as Dentsply Sirona’s Primescan 2 introduced in 2024, enables hardware-independent data capture that suits single-chair as well as multi-location practices. Artificial-intelligence engines embedded in design software enhance margin detection and propose optimal reduction paths, cutting design time and reducing remakes. Robotic-assisted surgery is emerging, with pilot studies showing robots prepare teeth faster than human clinicians while employing imaging modalities that eliminate ionizing radiation. Collectively, these innovations reduce laboratory dependencies, shorten appointment cycles, and elevate patient acceptance—key levers for revenue growth in the restorative dentistry market.
Rising Geriatric Population Globally
More than 280 million people aged 70 and above live with oral disorders that impair nutrition, speech, and social engagement. Geriatric patients often present multiple chronic conditions that complicate treatment planning, driving demand for minimally invasive restorations that integrate with periodontal and prosthodontic care. Policy initiatives under the UN Decade of Healthy Ageing are encouraging reimbursement models that recognize oral health’s systemic importance, fostering preventive visits and subsidized prosthetic replacement in high-income economies. Clinics and laboratories are therefore expanding service lines, such as implant-supported overdentures, that address both functional and cosmetic needs of older adults. Sustained demand from this cohort reinforces the long-run expansion of the restorative dentistry market.
Increasing Demand for Cosmetic and Aesthetic Dentistry
Social-media exposure and higher discretionary income have repositioned dental visits as lifestyle investments. Surveys show 91% of adults view oral health as integral to overall wellness, and 80% prefer zirconia implants for their translucent appearance and low allergenicity. Consequently, multilayer zirconia blocks that graduate translucency from cervical to incisal zones are gaining favor because they replicate natural dentition without compromising flexural strength. The American Dental Association reports 98% of practitioners use zirconia for posterior crowns, underscoring rapid material adoption. These preferences elevate average selling prices and provide upselling opportunities, boosting the restorative dentistry market’s revenue trajectory.
Restraints Impact Analysis*
| Restraints Impact Analysis | (~) % Impact on CAGR Forecast | Geographic Relevance | Impact Timeline |
|---|---|---|---|
| High cost of restorative dental procedures | -1.4% | Global; more pronounced in developing markets | Medium term (2-4 years) |
| Limited reimbursement for elective treatments | -0.9% | North America & Europe | Short term (≤ 2 years) |
| Shortage of skilled dental technicians & prosthodontists | -0.7% | Global; acute in North America & Europe | Medium term (2-4 years) |
| Volatile prices of zirconia & other premium materials | -0.6% | Global; import-dependent markets most affected | Short term (≤ 2 years) |
| Source: Mordor Intelligence | |||
High Cost of Restorative Dental Procedures
Advanced restorative workflows often involve premium materials, multi-visit protocols, and sophisticated capital equipment. U.S. practices absorbed 10% import tariffs on dental devices and consumables in April 2025, a policy that escalated equipment and implant prices and squeezed profit margins[3]P. Zenone, “Impact of 2025 Tariffs on Dental Imports,” Zenone, zenone.com. Volatile supply chains for zirconia and titanium further inflate costs, prompting some providers to defer technology upgrades. For patients, high out-of-pocket expenses deter acceptance of full-arch implant therapy, particularly in emerging economies where public insurance rarely covers elective treatment. This price sensitivity narrows the addressable audience and tempers volume growth in the restorative dentistry market.
Limited Reimbursement for Elective Treatments
Although 65% of U.S. adults carry dental insurance, many policies exclude veneers, all-ceramic crowns, and AI-based image analysis, categorizing them as elective. Recent adoption of Dental Loss Ratio standards improves transparency but stops short of mandating broader coverage. AI-powered claims workflows from Cigna and Aetna reduce administrative overhead yet still apply traditional benefit caps to esthetic procedures, shifting financial burden onto patients. Deferred treatment results in larger restorative failures later, but near-term budget constraints curb immediate uptake of high-value solutions. The reimbursement gap thus restricts rapid penetration of premium offerings in the restorative dentistry market.
*Our forecasts treat driver/restraint impacts as directional, not additive. The impact forecasts reflect baseline growth, mix effects, and variable interactions.
Segment Analysis
By Product: Materials Lead While Equipment Accelerates
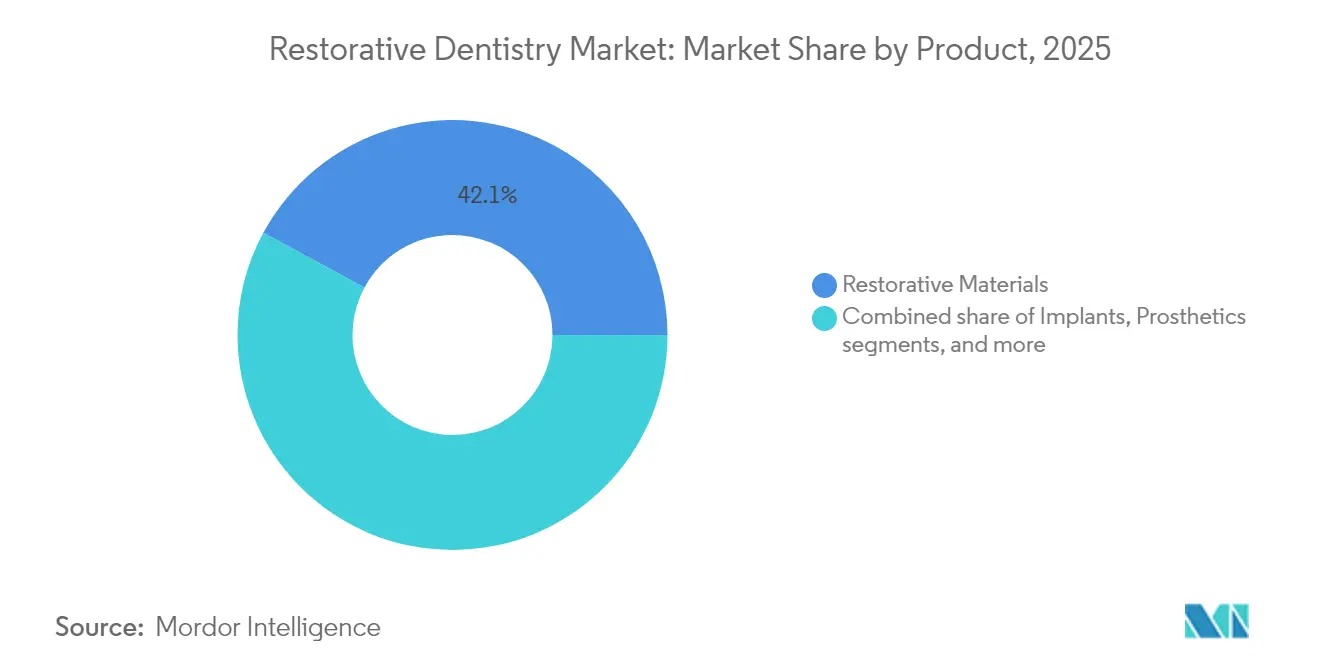
Restorative materials contributed 42.12% to restorative dentistry market share in 2025, underscoring their irreplaceable role across direct fillings, inlays, onlays, and indirect prostheses. The restorative dentistry market size for materials stood near USD 10.2 billion in 2025 and is growing steadily as zirconia, resin-nanoceramic hybrids, and bioactive cements capture share from legacy amalgams. Multilayer zirconia blocks that sinter at optimized temperatures deliver esthetic translucency for anterior regions while retaining 1,000 MPa strength suitable for posterior bridges. Ongoing research into antimicrobial composites and ion-releasing liners promises to extend restoration longevity, keeping replacement cycles strong.
Restorative equipment, meanwhile, is set to register a 9.3% CAGR through 2031—outpacing all other categories—as clinics and laboratories replace standalone milling units with integrated cloud-based ecosystems. The restorative dentistry market size tied to equipment investments is projected to surpass USD 15.1 billion by 2031, driven by intraoral scanners, chairside mills, and 3D printers that shrink turnaround time from weeks to hours. Dentsply Sirona’s Primescan 2 exemplifies the shift: its open architecture allows seamless data flow to any mill or printer, lowering hardware lock-in and broadening adoption. The spread of AI-driven quality assurance modules further shortens learning curves and curbs remake rates, reinforcing equipment-driven revenue gains.



By End-User: Labs Outpace Traditional Providers
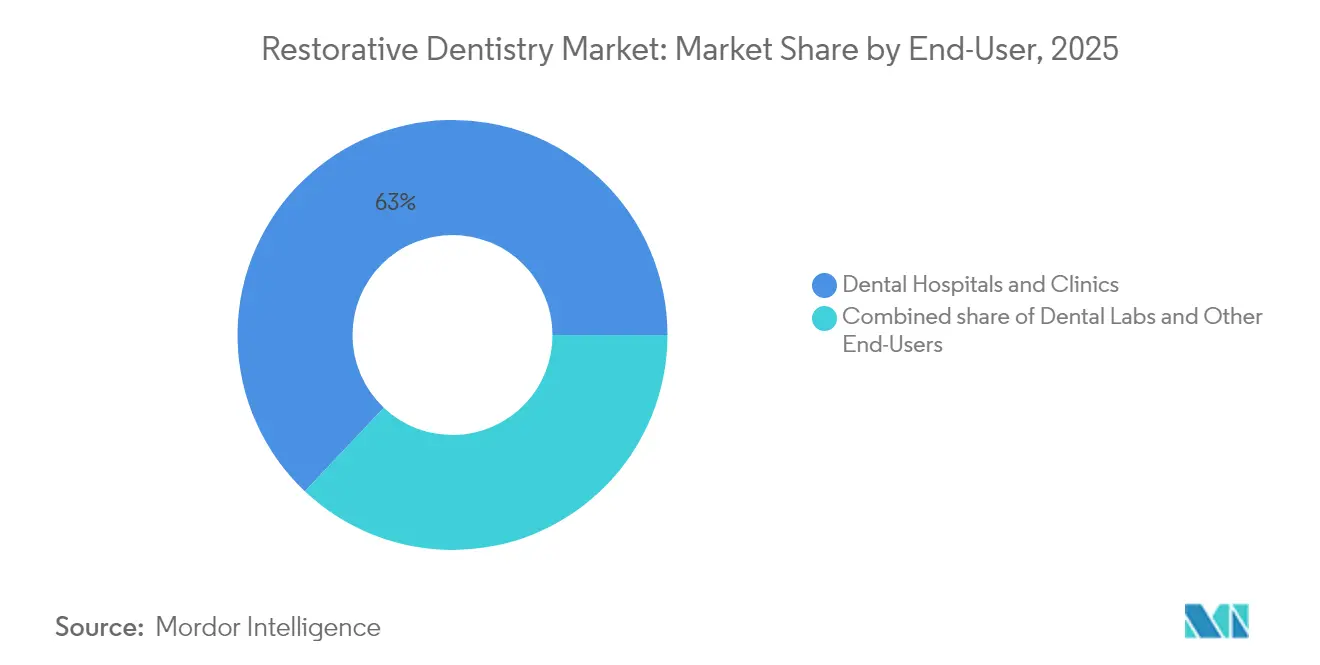
Dental hospitals and clinics retained 62.95% of restorative dentistry market size in 2025, reflecting their status as primary treatment portals. Yet staffing shortages remain acute: 95% of practices report difficulty recruiting hygienists, and the workforce has shrunk 8% since the COVID-19 pandemic. Practices are compensating by deepening digital chairside capability and using remote triage; smartphone-based teledentistry shows 96.8% sensitivity for caries detection, reducing non-essential appointments. Nevertheless, real-time laboratory collaboration remains critical for complex cases, sustaining clinic dominance.
Dental laboratories represent the fastest-growing end-user at a 9.68% CAGR to 2031. Outsourcing intricate design and fabrication tasks lets clinics focus on patient management, raising demand for high-volume labs equipped with multi-axis mills and dental-grade polymer printers. Laboratories capitalize on economies of scale, offering five-day turnaround for multilayer zirconia restorations and same-day service for 3D-printed provisionals. This symbiotic model boosts overall throughput and shields smaller practices from capital outlays, strengthening the restorative dentistry market’s ecosystem.
Geography Analysis
North America delivered 39.92% of restorative dentistry market share in 2025, underpinned by robust insurance penetration and early adoption of digital workflows. FDA guidance issued in October 2024 under the Safety and Performance Based Pathway clarified performance criteria for endosseous implants and dental ceramics, accelerating product approvals. However, import tariffs enacted in April 2025 inflate acquisition costs for scanners and implants, challenging practice profitability. Leading suppliers such as Dentsply Sirona reported a 3.5% organic sales decline in 2024 yet continue to fund cloud-platform rollouts aimed at offsetting pricing pressure.
Asia-Pacific is the fastest-growing region, set to post an 8.29% CAGR as urban middle-income populations widen access to elective care. Straumann Group achieved 33.8% organic growth in Asia-Pacific during 2024 on the back of its AlliedStar intraoral scanner launch and localized implant production in China. Government dental-awareness campaigns and rising private insurance uptake boost procedural demand, while local manufacturers such as Osstem Implant advance acquisition strategies to cement regional leadership. Rapid digitalization allows clinics to leapfrog analog workflows, further enlarging the restorative dentistry market.
Europe maintains steady expansion, sustained by aging demographics and stringent product standards that favor premium solutions. Harmonized Medical Device Regulations, coupled with structured reimbursement schemes, encourage the diffusion of bioactive materials and AI-supported diagnostic platforms. Straumann’s EMEA operations logged 11.4% organic growth in Q3 2024, driven by education initiatives that advance clinician competence in fully digital implant protocols. Workforce shortages resembling those in North America are accelerating investment in chairside CAD/CAM and robotic assistance, reinforcing efficiency gains across the region.

Regulatory Landscape
Restorative dentistry products are regulated as medical devices and materials in major markets, which pushes manufacturers toward stronger clinical evidence, post-market surveillance, and standardized test methods. In the United States, FDA oversight covers implants, prosthetics, CAD/CAM systems, and restorative materials, with the Quality Management System Regulation (QMSR) implemented in February 2026 incorporating ISO 13485:2016 into device quality management expectations and updating inspection procedures.
In Europe, Regulation (EU) 2017/745 (MDR) continues to govern dental devices and materials, and the compliance burden is shaping portfolio and documentation strategies, especially for implantables and high-volume restorative indications. In March 2026, Commission Delegated Regulation (EU) 2026/1359 amended MDR provisions around technical documentation assessment scope for certain Class IIb implantable devices, explicitly listing dental device categories such as dental implants, fillings, and crowns. International standards updates, including ISO 6872:2024 for dental ceramics and ISO 9917-1:2025 for dental cements, also anchor the performance and test requirements used in conformity assessment and product validation.
Competitive Landscape
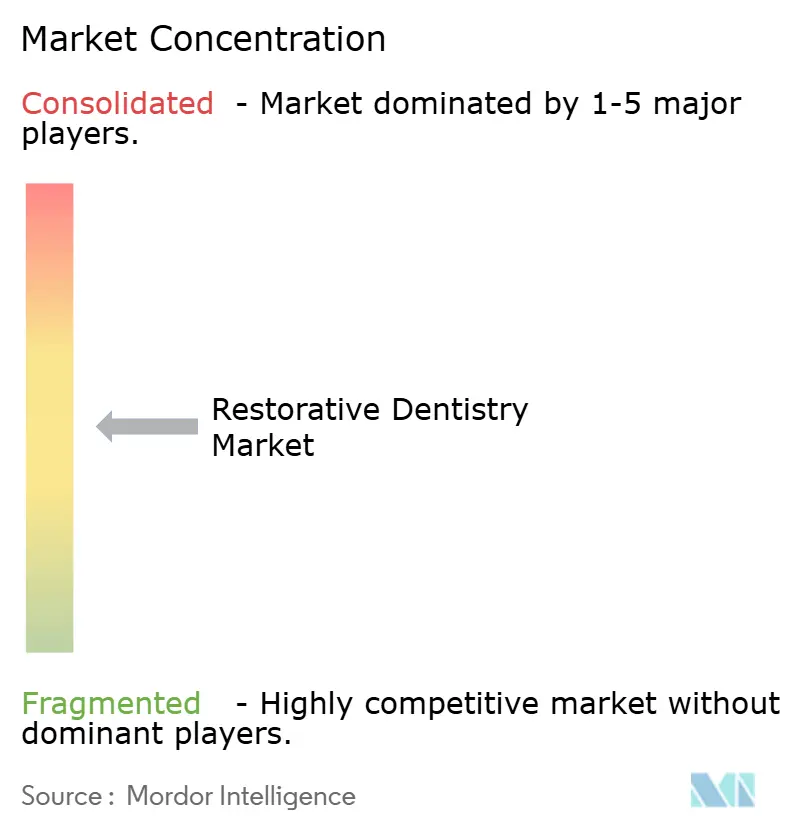
The restorative dentistry market shows moderate consolidation, with the top tier comprising Dentsply Sirona, Straumann Group, Envista, 3M’s spin-off Solventum, and Henry Schein. M&A activity surged in 2024: Patient Square Capital’s USD 4.1 billion acquisition of Patterson Companies and Carestream Dental’s USD 525 million capital raise illustrate the appetite for scale and technology depth. Companies differentiate by bundling hardware, software, and materials into subscription-based ecosystems that promise end-to-end workflow integration.
Technology partnerships are proliferating. Envista collaborates with AI firm Pearl to embed radiographic-diagnosis algorithms into its scanners, and Solventum’s stand-alone structure frees capital for targeted acquisitions in bioactive cements. White-space opportunities persist in teledentistry: despite high diagnostic accuracy, remote postoperative monitoring solutions remain under-penetrated outside research pilots. Robotic chairside systems developed in Asia and Europe await broader regulatory clearance but could reconfigure procedural economics once commercialized.
Continuous innovation pressures incumbent players to defend share against nimble entrants. Start-ups focused on resin-nanoceramic hybrid blocks, single-visit implant prostheses, and cloud-native treatment-planning hubs are attracting venture backing. Providers ultimately benefit from quicker turnaround, higher case acceptance, and lower remake rates, reinforcing the upward trajectory of the restorative dentistry market.
Restorative Dentistry Industry Leaders
3M Company
Dentsply Sirona
Mitsui Chemicals, Inc.
ZimVie Inc.
Envista Holdings Corporation
- *Disclaimer: Major Players sorted in no particular order

Market Opportunities and Future Outlook
The shift away from mercury-containing materials is creating near-term whitespace for alternative restorative materials and compatible workflows in regulated markets. The European Union prohibition on the manufacturing and import of dental amalgam, effective July 1, 2026 (with narrow exceptions), concentrates demand on composites, ceramics, and other non-mercury restorative options, supporting opportunities for suppliers with validated material portfolios and training support for high-throughput clinical environments.
Digitally integrated restorative workflows and additive manufacturing are also moving deeper into routine care, creating opportunities in chairside production, lab automation, and cloud-connected service models. PDS Health surpassing five million CEREC chairside restorations with Dentsply Sirona in July 2026 shows scaled deployment of chairside CAD/CAM across multi-site practice settings. In parallel, Stratasys TrueDent receiving CE Class IIa certification in Europe in March 2026 expands the addressable use of monolithic 3D-printed dentures, crowns, and bridges under MDR. Portfolio expansion and consolidation further support cross-selling between materials and devices, including Mitsui Chemicals announcing in June 2026 that its subsidiary will acquire Ultradent Products to expand oral care solutions spanning restorative and whitening categories.
Recent Industry Developments
- July 2026: PDS Health announced its practices surpassed five million CEREC chairside restorations completed with Dentsply Sirona digital dentistry solutions. The milestone shows scaled chairside CAD/CAM utilization across multi-location provider networks and underscores continued demand for integrated scanning, design, and milling ecosystems, along with associated restorative materials.
- April 2025: ZimVie announced the U.S. launch of its Immediate Molar Implant System designed to streamline site preparation for molar extractions and support primary stability. The release targets a clinically demanding indication and supports procedure standardization, increasing competitive pressure in implant workflows tied to restorative components and prosthetics.
- July 2024: ZimVie announced FDA 510(k) clearance and the U.S. launch of its GenTek restorative component portfolio. The expanded component offering supports restorative versatility across implant systems and strengthens aftermarket revenue potential tied to compatible prosthetic connections.


Research Methodology Framework and Report Scope
Market Definition and Coverage
This market covers revenue generated from restorative dentistry solutions that repair or replace damaged or missing teeth, including restorative materials, implants, prosthetics, and restorative equipment, as tracked across major regions and key countries.
Scope exclusions: We exclude purely preventive, diagnostic-only, and orthodontic care when it does not directly result in a restorative procedure or product sale.
Segmentation Overview
- By Product
- Restorative Materials
- Direct Restorative Materials
- Indirect Restorative Materials
- Biomaterials
- Bonding Agents / Adhesives
- Impression Materials
- Implants
- Prosthetics
- Restorative Equipment
- CAD/CAM Systems
- Handpieces
- Rotary Instruments
- Casting Equipment
- Other Restorative Equipments
- Restorative Materials
- By End-User
- Dental Hospitals & Clinics
- Dental Labs
- Other End-Users
- Geography
- North America
- United States
- Canada
- Mexico
- Europe
- Germany
- United Kingdom
- France
- Italy
- Spain
- Rest of Europe
- Asia-Pacific
- China
- Japan
- India
- Australia
- South Korea
- Rest of Asia-Pacific
- Middle East & Africa
- GCC
- South Africa
- Rest of Middle East & Africa
- South America
- Brazil
- Argentina
- Rest of South America
- North America
Data Sources, Market Sizing, and Validation
Desk Research
Desk research starts with clear boundaries on what counts as restorative dentistry revenue, and then mapping the demand pool that drives procedures and product use. We rely on public, reputable sources such as World Health Organization oral health statistics, OECD health data, CDC oral health publications, and national health ministries for disease burden and care-access context.
To connect demand to spending, we also review sources such as professional dental association publications, peer-reviewed journals on restorative materials and treatment patterns, and trade and customs statistics for relevant dental device categories where they help explain import reliance. Company annual reports, investor presentations, and earnings commentary are used to understand product mix and geographic exposure. We then reference a paid subscription covering company financials and a separate subscription for patent and innovation tracking to confirm timelines and product activity. These sources are not exhaustive, and we used many other public references to collect, cross-check, and clarify data points during the study.
Primary Interviews and Surveys
Primary work focuses on checking how restorative procedures translate into product demand and pricing in real settings, since list prices and actual realized prices can differ by channel and country. We speak with a mix of manufacturers, distributors, dental labs, and clinic-side roles to validate adoption of materials and equipment, typical procedure volumes, and how usage changes with reimbursement and patient out-of-pocket patterns across APAC, EMEA, and the Americas.
Distribution of primary research fieldwork respondents
| Company type | Respondent position | Region |
|---|---|---|
| Top tier: 29% | CXOs: 14% | APAC: 53% |
| Mid tier: 56% | Functional/Unit leaders: 34% | EMEA: 29% |
| Smaller Players: 15% | Managers: 52% | Americas: 18% |
Market-Sizing & Forecasting
Market sizing uses a top-down and bottom-up mix. The starting point is a demand pool tied to restorative procedure activity and the spend associated with it, and then the total is checked against supply-side signals. We reconstruct the addressable market by linking indicators such as treated population trends, dental visit rates, procedure mix shifts (for example, crowns, fillings, and implant placements), and broad reimbursement and out-of-pocket patterns. These inputs translate into volumes for materials, prosthetics, implants, and equipment.
Next, we use selective bottom-up approximations to keep totals realistic, including sampled average selling price ranges, distributor channel checks, and supplier revenue roll-ups for the most visible categories where reporting is clearer. When some country-level splits are missing, we handle gaps through region-level ratio builds anchored to known procedure intensity and the local mix of public versus private dental care.
For forecasting, we run scenario analysis supported by variable-by-variable expectations collected during interviews. The model is also stress-tested with macro signals such as healthcare spending trends and dental workforce capacity where applicable. We separate short-run shocks from longer-run adoption curves for newer materials and digital restorative workflows so growth does not get overstated.
Data Validation & Update Cycle
Validation is done through multiple checks so final totals stay consistent with independent demand and supply signals. We compare modeled outcomes with external markers such as procedure-rate directionality, trade movements for key device categories where relevant, and company-reported regional trends, and then review outliers before internal sign-off.
If a major variance appears, we revisit assumptions behind price progression, product mix, and regional weighting, and we schedule follow-up calls with the most relevant respondent types. Reports are refreshed annually, and interim updates are made when material events occur, for example policy changes, major pricing resets, or step-changes in adoption. Before delivery, an additional analyst pass is completed so clients receive the latest updated view aligned to the current data cut.
Mordor Intelligence's Global Restorative Dentistry Market Estimate Compared With Other Published Estimates
Published market sizes for restorative dentistry can differ even when they claim to measure the same scope, because the boundary between materials, devices, and services is not always applied consistently. Differences also arise from how procedure activity is converted into spending, how prices are normalized across countries, and how often assumptions are refreshed.
Some estimates fold in adjacent dental categories or include broader equipment pools without clearly separating what is used for restorative work versus general dental use. Currency conversion timing, base year selection, and whether private-pay procedure intensity is checked through interviews can also shift the final number.
Benchmark comparison
| Source | Market Size | Gaps in Research Methodology |
|---|---|---|
| Mordor Intelligence | USD 26.04 B (2026) | |
| Trade Journal A | USD 22.40 B (2024) | Uses an earlier base year and a shorter forecast window, and the scope is not clearly separated across materials, prosthetics, implants, and restorative equipment, which can compress the total when some categories are treated as out of scope. |
| Industry Newsletter B | USD 20.32 B (2024) | Blends restorative market language with equipment-only references, and the definition of what is counted appears narrower around product sales, with limited transparency on how procedure intensity and pricing were normalized across regions. |
By tracking category-level inclusion rules and refreshing price and procedure assumptions through cross-region interviews, Mordor Intelligence reduces scope overlap between restorative materials, prosthetics, implants, and equipment, which helps explain the spread versus smaller 2024-stated totals. In practice, the comparison points to three recurring drivers, base year selection, category coverage, and how demand is translated into spend, which is why totals can differ even when the market name matches.


Key Questions Answered in the Report
What is the current restorative dentistry market size?
The restorative dentistry market size stands at USD 26.04 billion in 2026 and is projected to reach USD 37.75 billion by 2031.
Which product segment is growing fastest?
Restorative equipment—particularly intraoral scanners, chairside mills, and dental-grade 3D printers—is expected to grow at a 9.3% CAGR through 2031.
Why is Asia-Pacific the fastest-growing regional market?
Rapid urbanization, expanding middle-class purchasing power, and aggressive adoption of digital workflows are driving an 8.29% CAGR in Asia-Pacific.
How are tariffs affecting North American providers?
A 10% tariff on dental imports introduced in April 2025 is raising equipment and material costs, pressuring practice margins and delaying some capital purchases.
Which companies lead in digital restorative solutions?
Dentsply Sirona, Straumann Group, Envista, and Solventum currently dominate through integrated portfolios that combine scanners, CAD/CAM hardware, and proprietary materials.
What technological trend will most influence the next five years?
Wider deployment of AI-enabled design and robotic-assisted procedures is poised to compress chairtime, improve accuracy, and enhance patient experience across the restorative dentistry industry.
Page last updated on:


 Your data is secure and never sold or shared.


