Dental Chair Market Size and Share
Market Overview
| Study Period | 2020 - 2031 |
|---|---|
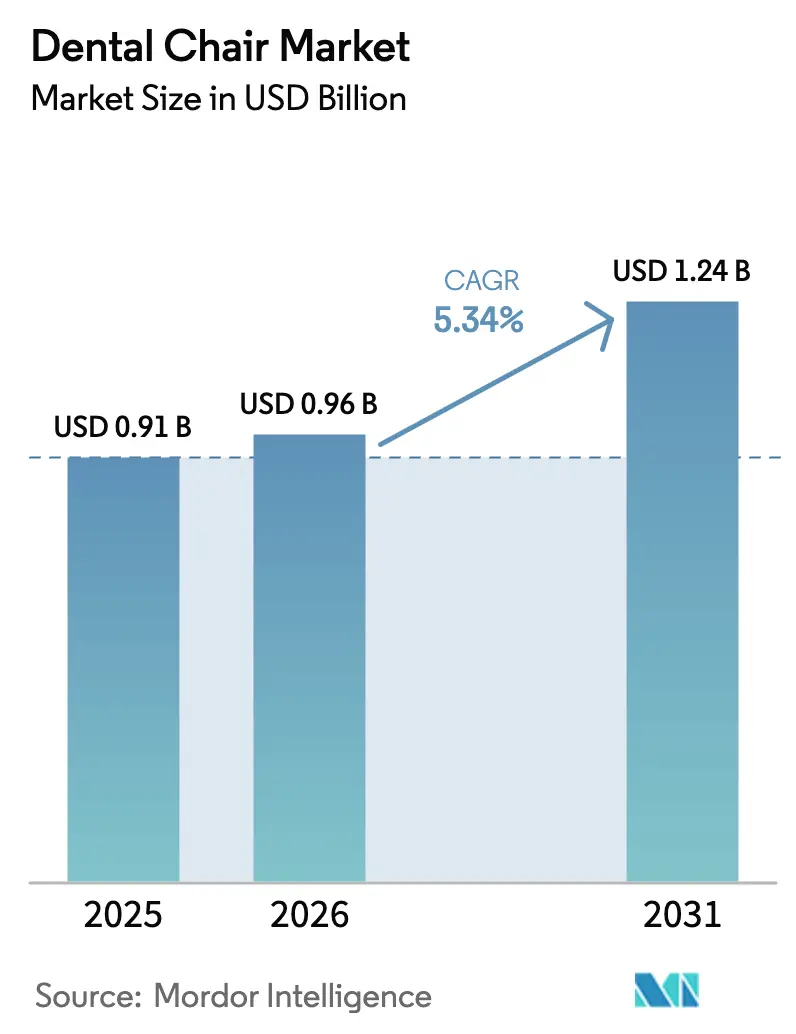
| Market Size (2026) | USD 0.96 Billion |
| Market Size (2031) | USD 1.24 Billion |
| Growth Rate (2026 - 2031) | 5.34% CAGR |
| Fastest Growing Market | Asia Pacific |
| Largest Market | North America |
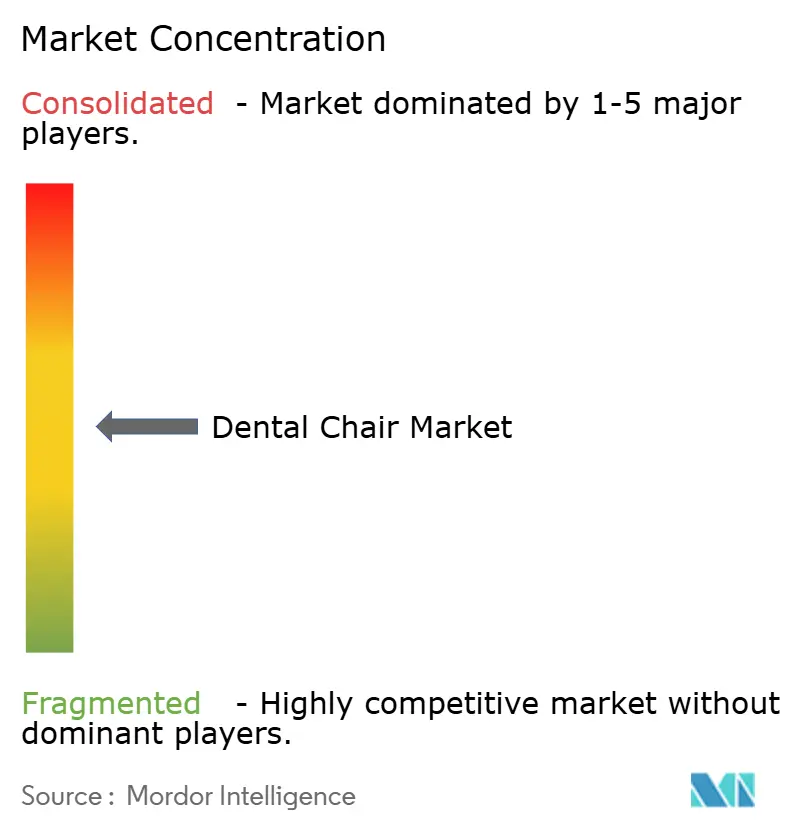
| Market Concentration | Medium |
Major Players*Disclaimer: Major Players sorted in no particular order Image © Mordor Intelligence. Reuse requires attribution under CC BY 4.0. | |
Dental Chair Market Analysis by Mordor Intelligence
The dental chair market size was valued at USD 0.91 billion in 2025 and estimated to grow from USD 0.96 billion in 2026 to reach USD 1.24 billion by 2031, at a CAGR of 5.34% during the forecast period (2026-2031). The dental chair market is in a maturation phase in which practice consolidation and technology-rich treatment platforms, rather than sheer unit expansion, underpin value creation. Dental service organizations (DSOs) now negotiate bulk contracts that lock in standardized chair features, accelerating replacement cycles as infection-control mandates tighten. An aging patient base demands complex oral care, reinforcing investment in ergonomically advanced chairs that support longer procedures. Regionally, the Asia-Pacific dental chair market benefits from publicly funded oral-health programs, while North America retains the largest share as DSOs scale nationwide networks and prioritize integrated chair ecosystems. Financing structures, including vendor-backed leasing, further ease capital expenditure barriers, pushing premium electric and CAD/CAM-ready units into mainstream adoption.
Key Report Takeaways
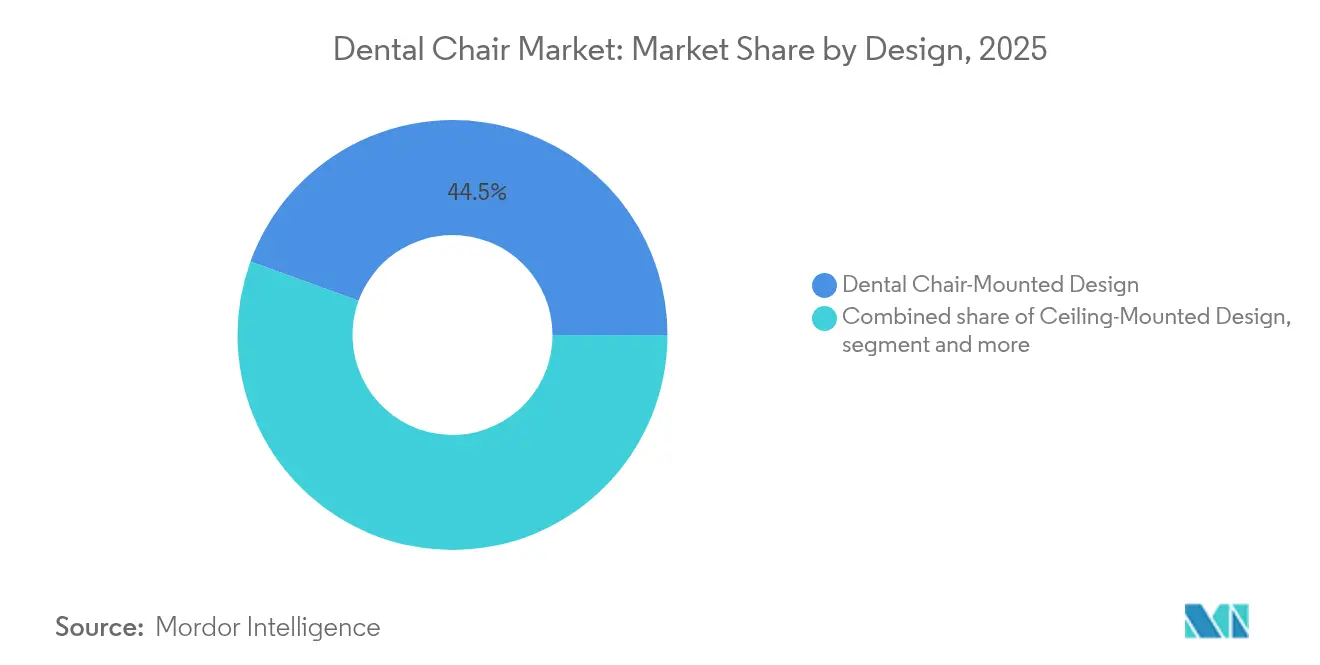
- By design, dental chair-mounted systems led with 44.45% revenue share in 2025, while mobile-independent units are projected to expand at a 6.29% CAGR to 2031.
- By product type, powered chairs held 64.62% of the dental chair market share in 2025 and are advancing at a 6.55% CAGR through 2031.
- By operation mechanism, electromechanical chairs accounted for 36.20% share of the dental chair market size in 2025, whereas electric motorized systems are set to grow at 6.95% CAGR between 2026-2031.
- By application, examination chairs commanded 46.80% share of the dental chair market size in 2025, while surgery and implantology applications are rising at a 6.25% CAGR to 2031.
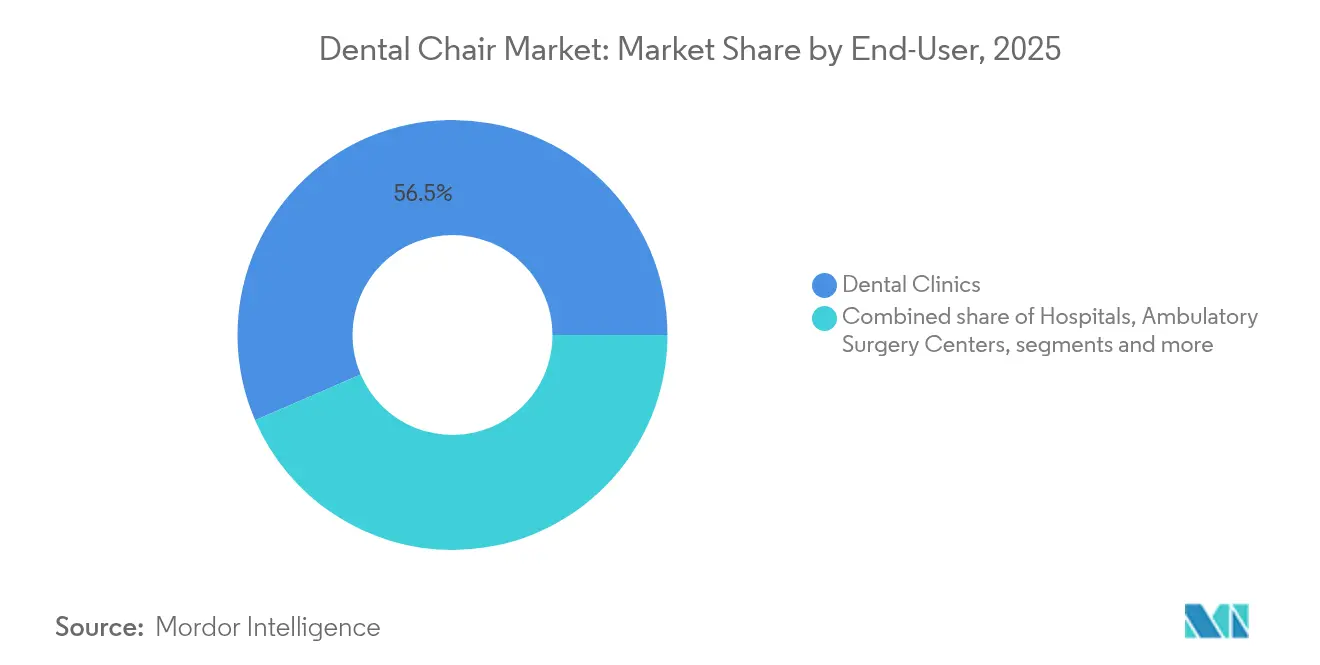
- By end user, dental clinics maintained 56.48% share in 2025; ambulatory surgery centers record the highest expected CAGR at 7.25% through 2031.
- By distribution channel, direct manufacturer-to-practice sales accounted for 56.02% of the dental chair market size in 2025, but e-commerce portals are growing fastest at 7.52% CAGR.
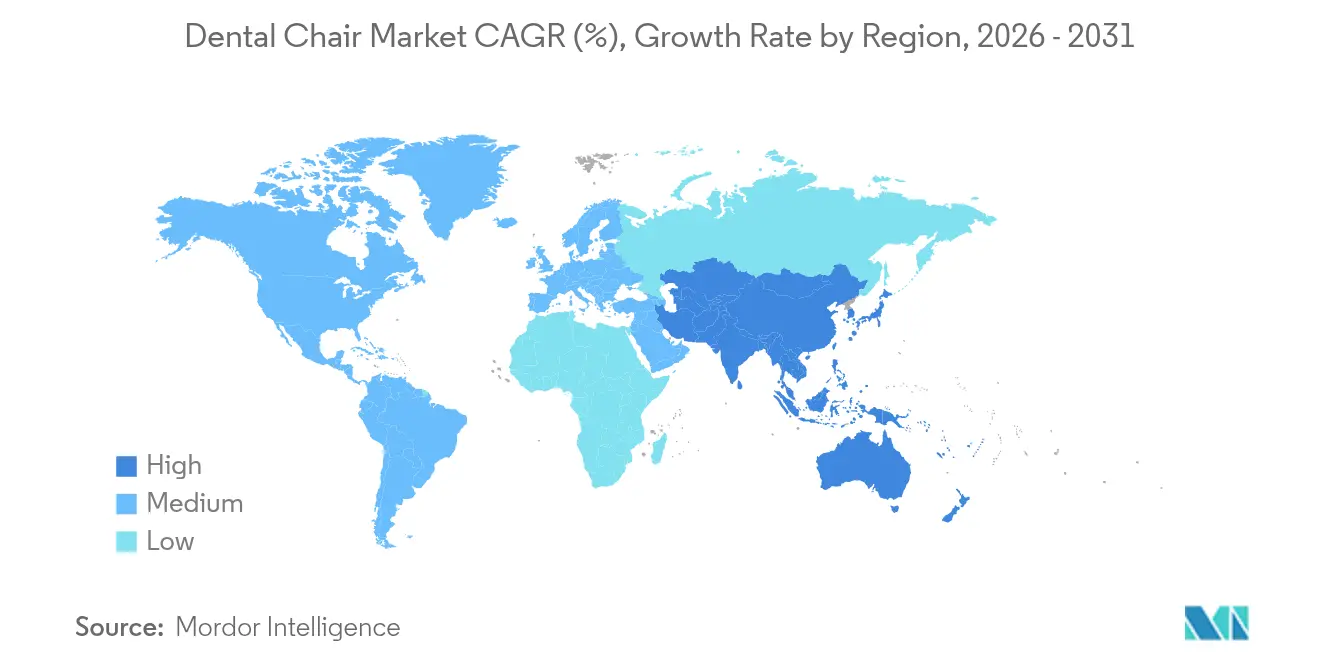
- By geography, North America dominated with 39.10% share in 2025, whereas the Asia-Pacific dental chair market is predicted to expand at a 7.80% CAGR between 2026-2031.
Note: Market size and forecast figures in this report are generated using Mordor Intelligence’s proprietary estimation framework, updated with the latest available data and insights as of 2026.
Market Trends and Insights
Drivers Impact Analysis of Dental Chair Market*
| Driver | (~) % Impact on CAGR Forecast | Geographic Relevance | Impact Timeline |
|---|---|---|---|
| Growing prevalence of caries & periodontal disease | +1.2% | Global, with higher impact in APAC and MEA | Long term (≥ 4 years) |
| Rapid adoption of integrated CAD/CAM-ready chair units | +0.8% | North America & Europe core, expanding to APAC | Medium term (2-4 years) |
| Surging demand from emerging dental service organisations (DSOs) | +1.5% | North America dominant, early expansion to Europe | Short term (≤ 2 years) |
| Rise of chair-side teledentistry & remote monitoring modules | +0.6% | Global, with early adoption in developed markets | Medium term (2-4 years) |
| Accelerated replacement cycle driven by infection-control retrofits post-COVID-19 | +0.9% | Global, with emphasis on high-density practice areas | Short term (≤ 2 years) |
| Government-funded geriatric oral-health schemes in OECD & APAC | +0.7% | OECD countries and select APAC markets | Long term (≥ 4 years) |
| Source: Mordor Intelligence | |||
Growing Prevalence of Caries & Periodontal Disease
Oral disease affects billions worldwide, creating a persistent need for treatment chairs that support both preventive and restorative workflows. Severe periodontal conditions in older adults increase chair time per visit, nudging practices to invest in ergonomically advanced units that reduce clinician fatigue. Emerging public health programs now emphasize preventive screenings, which paradoxically raise utilization of diagnostic chair features such as integrated imaging arms. As governments link oral and systemic health, reimbursement frameworks increasingly support early intervention, strengthening long-term replacement demand for premium systems.[1]Ministry of Health Malaysia, “National Oral Health Strategic Plan 2022-2030,” moh.gov.my
Rapid Adoption of Integrated CAD/CAM-Ready Chair Units
Digital workflows collapse impression-taking, design, and milling into a single appointment. CAD/CAM-ready platforms with built-in data ports and software interfaces fetch premium prices yet lower overall chairside cycle times. Ecosystem interoperability, illustrated by Dentsply Sirona’s DS Core cloud environment,[2]Dentsply Sirona, “Form 10-K 2024,” sec.gov shifts competitive advantage toward vendors that bundle hardware, firmware, and service contracts. Practices adopting chair-integrated scanners report higher restoration case acceptance, justifying higher capital outlays and locking in multiyear service subscriptions.
Surging Demand from Emerging Dental Service Organizations (DSOs)
DSOs have tripled their penetration within a decade, driving formulary-based procurement that standardizes chair specifications across hundreds of clinics. Centralized purchasing lowers per-unit costs and guarantees volume for manufacturers capable of nationwide service coverage. Expansion packages such as Pacific Dental Services’ equipment line of credit illustrate how capital pools funnel directly into bulk chair orders, compressing the replacement timeline across entire networks. This scale benefits vendors offering turnkey installations and predictive maintenance dashboards.
Rise of Chair-Side Teledentistry & Remote Monitoring Modules
Teleconsultation moved from contingency to core service after pandemic disruptions. Today, high-resolution cameras and secure data links embedded in chairs allow remote specialists to assist real-time, widening practice reach and improving triage. Integration with AI algorithms that flag occlusal anomalies boosts diagnostic confidence. Remote monitoring sensors now transmit equipment-health data to service centers, enabling predictive repairs that minimize downtime and reduce technician dispatch frequency. Such smart features increasingly appear on mid-tier models, broadening adoption.
Restraints Impact Analysis of Dental Chair Market*
| Restraint | (~) % Impact on CAGR Forecast | Geographic Relevance | Impact Timeline |
|---|---|---|---|
| High upfront & total-cost-of-ownership for digital chairs | -0.8% | Global, with higher impact in price-sensitive markets | Medium term (2-4 years) |
| Slower cap-ex recovery for solo practices after 2021 demand dip | -0.6% | North America & Europe, affecting independent practices | Short term (≤ 2 years) |
| Shortage of qualified biomedical technicians for advanced chair systems | -0.4% | Global, with acute shortages in developed markets | Long term (≥ 4 years) |
| Growing availability of low-cost refurbished units in price-sensitive markets | -0.3% | Emerging markets and cost-conscious practices | Medium term (2-4 years) |
| Source: Mordor Intelligence | |||
High Upfront & Total Cost of Ownership for Digital Chairs
Premium digital chairs often cost double their analog counterparts once software subscriptions and maintenance contracts are included. Recent import tariffs add 10% to landed prices in several markets, stretching payback periods for independent practitioners. Leasing mitigates cash-flow strain but lengthens overall expenditure over a five-year term. As long as price sensitivity persists, basic hydraulic models continue to serve entry-level clinics, tempering full-market migration to digital units.
Shortage of Qualified Biomedical Technicians
Employment demand for equipment technicians outstrips supply, causing service queues that prolong chair downtime. Rural practices face wait times exceeding four weeks for complex repairs, undermining confidence in adopting highly digitized models. Manufacturers respond by embedding self-diagnostics and remote firmware updates, yet the human skill gap remains a structural constraint.
*Our forecasts treat driver/restraint impacts as directional, not additive. The impact forecasts reflect baseline growth, mix effects, and variable interactions.
Dental Chair Market Segment Analysis
By Design:
Mobile Units Gain TractionThe dental chair market size for design segments shows chair-mounted platforms still dominate with 44.45% share in 2025, owing to their integrated delivery systems and established clinical familiarity. Multi-specialty DSOs lean on this format for standardized operatory layouts that streamline staff training. However, mobile-independent configurations record the strongest 6.29% CAGR as practices prioritize flexible room utilization and rapid sanitization between appointments. Lightweight frames and lockable casters allow clinics to reconfigure operatories daily, an advantage in high-volume urban centers.
In many emerging markets, pop-up clinics and outreach programs prefer portable chairs that fold into compact transport cases, extending care to underserved populations. Hospitals with multi-disciplinary surgical suites also adopt ceiling-mounted variants where floor space is critical, but growth remains modest. Vendors now bundle mobile units with battery-powered instrument modules, enabling uninterrupted procedures even where power reliability is poor.


By Product Type:
Powered Systems DominatePowered chairs represent the largest slice of the dental chair market, holding 64.62% share in 2025 and continuing to expand at a 6.55% CAGR. Integrated control panels, programmable positions, and synchronized lighting improve clinical efficiency, supporting value-based care models. Productivity gains compensate for higher capital costs, especially in multi-operator DSOs measuring revenue per chair per hour.
Basic non-powered models persist in rural outreach programs and school-based clinics where simplicity and low maintenance outweigh functionality. Nonetheless, software-enabled semi-autonomous positioning—now a mid-tier feature—cements the powered segment’s leadership. As digital imaging arms migrate from separate carts to chair-mounted booms, the premium gap between powered and non-powered offerings widens.
By Operation Mechanism:
Electric Motorized Systems AccelerateElectromechanical chairs held 36.20% share of the dental chair market size in 2025, but electric motorized models outpace at 6.95% CAGR thanks to precise, silent actuation. Programmable memory presets minimize operator fatigue and facilitate repeatable patient positioning for implantology and orthodontic workflows. Hydraulic chairs remain price-efficient yet face scrutiny for potential fluid leaks in sterile environments.
In teaching hospitals, electric chairs integrate with simulation software that logs positional data for student performance review, reinforcing demand. Manufacturers market modular motor assemblies that simplify field repairs, partially offsetting technician scarcity. Pneumatic/manual variants retreat into low-acuity settings where power infrastructure is unreliable.
By Application:
Surgery Applications Drive GrowthExamination chairs still represent 46.80% of revenue, reflecting broad primary-care caseloads. However, surgery and implantology categories experience 6.25% CAGR as aging populations seek full-arch restorations and as DSOs internalize specialty services. Enhanced headrest articulation and 180-degree rotation features permit complex oral-surgery ergonomics, reducing patient transfers between operatories.
AI-supported robotic adjuncts under development aim to automate drilling trajectories, and integration requires rock-steady electric bases with micron-level positional accuracy. For orthodontic cases, chair-embedded 3D scanners cut appointment times, yet the revenue per unit remains lower than surgical applications, tempering growth. Across applications, software updates unlock new procedure protocols, elongating equipment life cycles.
By End User:
Ambulatory Surgery Centers Expand RapidlyDental clinics claimed 56.48% of units sold in 2025, but ambulatory surgery centers (ASCs) chart a robust 7.25% CAGR. Shifts in insurance reimbursement favor outpatient settings that reduce total care costs. ASCs invest in multi-specialty chairs outfitted with anesthesia interfaces, permitting complex extractions and implant placements under conscious sedation.
Hospitals continue to house maxillofacial suites but centralize around trauma care, a narrower revenue base. Government mobile units and military field clinics round out the “other” segment, often relying on rugged portable chairs. Chair makers design quick-release upholstery and antimicrobial coatings specifically for ASC turnover demands.
By Distribution Channel:
E-Commerce Gains MomentumDirect sales channels captured 56.02% share in 2025 because large DSOs negotiate factory-to-clinic contracts. Yet digital portals post the highest 7.52% CAGR as small and mid-size practices adopt online procurement to compare real-time pricing. Cloud-based configurators illustrate operatory layouts, while augmented-reality apps simulate chair placement, shortening decision cycles.
Dealers retain relevance where bundled installation and on-site service are essential, particularly for multi-unit hospital bids. Manufacturers respond by launching hybrid models: chairs ship via e-commerce yet include prepaid local technician visits. Subscription-style consumable kits further anchor customers to brand ecosystems.
Geography Analysis
North America Dental Chair Market
North America commanded 39.10% of global revenue in 2025, underpinned by high insurance coverage and rapid DSO consolidation that drives standardized, tech-rich chair procurement. The dental chair market in the United States benefits from leasing programs that convert capital expense to predictable operating outlays, offsetting technician shortages that still prolong repair lead times in rural states. Tariffs on imported equipment imposed in 2025 inflated purchase costs, but vendors countered with trade-in rebates and extended warranties. Policy initiatives promoting license portability for dental professionals aim to ease staffing bottlenecks, indirectly supporting chair utilization.
APAC Dental Chair Market
Asia-Pacific delivers the fastest growth at 7.80% CAGR through 2031. Government oral-health campaigns in Malaysia, India, and China subsidize equipment upgrades across public clinics, broadening access and driving volume. Malaysia’s National Oral Health Strategic Plan channels capital grants toward ergonomic chairs suitable for geriatric care, while India’s expanding USD 9 billion medical-device sector remains heavily import-dependent. Rising disposable income fuels private-clinic openings in Vietnam, Indonesia, and the Philippines, where mid-tier powered chairs are favored. Local assemblers attempt to undercut imports, yet the technical gap in precision actuators keeps international brands dominant.
Europe Dental Chair Market
Europe records steady, mid-single-digit expansion as clinics modernize to meet EU-wide environmental directives targeting energy efficiency. Subsidized loans encourage replacement of hydraulic oil systems with electric drives, aligning sustainability and infection-control objectives. Geriatric oral-health vouchers in Germany and the Nordic countries spur demand for chairs with bariatric weight ratings and extended legroom. Technician shortages mirror North American patterns, prompting vendors to integrate remote diagnostics that comply with EU cybersecurity standards. Eastern European markets adopt refurbished units aggressively, tempering new-unit volumes but enlarging aftermarket service prospects.

Competitive Landscape
Market concentration remains moderate. Major suppliers command significant combined revenue share, leaving space for regional specialists. Dentsply Sirona leads on the strength of its integrated DS Core platform but absorbed USD 495 million in goodwill impairments during 2024, reflecting pricing pressure and slower post-pandemic recovery.[3]Dentsply Sirona, “Q4 2024 Earnings Presentation,” dentsplysirona.com Midmark amplifies brand equity through design awards for its mobile systems, differentiating via user-centric ergonomics.
Strategic focus shifts toward platform ecosystems. Leading vendors package chairs with imaging sensors, cloud subscriptions, and AI analytics, creating recurring revenue streams and raising switching costs. Service programs now include predictive maintenance dashboards that alert technicians before component failure, mitigating technician scarcity. Start-ups such as Perceptive, backed by USD 30 million in funding, push robotics-augmented chairs that promise semi-automated implant placement, potentially redefining surgical throughput.
M&A activity centers on distribution leverage. Patient Square Capital’s acquisition of Patterson Companies removes quarterly earnings pressures, enabling deeper investment in post-sale chair services. Private-equity interest suggests that downstream service margins outrank hardware profits, prompting OEMs to bundle extended warranties and compliance training. To address technician shortages, several manufacturers pilot remote-assist smart glasses that guide local staff through complex repairs, reducing travel cost and downtime.
Dental Chair Industry Leaders
A-dec Inc
Dentsply Sirona
Midmark Corporation
PLANMECA OY
Takara Belmont
- *Disclaimer: Major Players sorted in no particular order
Dental Chair Market Companies Covered in this Report
- A-dec Inc
- Dentsply Sirona
- Planmeca
- Midmark
- Kavo Dental
- Takara Belmont
- Boyd Industries
- DENTALEZ, Inc..
- XO CARE A/S
- CHIRANA Medical
- Heka Dental
- Summit Dental Systems
- Fimet Oy
- Diplomat Dental
- Fedesa
- DCI Edge
- Shanghai Foshion Medical

Recent Industry Developments in Dental Chair Market
- June 2025: Scientific Reports published simulation-based ergonomics research highlighting back-rest and spittoon modifications that lower clinician lumbar stress, influencing upcoming chair designs.
- December 2024: Patient Square Capital acquired Patterson Companies for USD 4.1 billion, positioning the distributor for expanded North American and UK chair logistics.
- September 2024: Carestream Dental raised USD 525 million to accelerate integration of AI modules into future chair platforms.
- January 2024: Midmark Corporation introduced its redesigned Mobile Dental Chair System, compliant with new examination-chair standards and recognized for industrial-design excellence.


Global Dental Chair Market Report Scope
As per the scope of the report, dental chairs are essential equipment in the dental industry, designed to optimize patient comfort and streamline dental procedures. These chairs offer adjustable configurations to support various treatments and are often integrated with advanced features such as lighting systems, instrument trays, and water lines. Modern dental chairs emphasize ergonomic design, enhancing operational efficiency for practitioners while ensuring a superior patient experience. The dental chair market is segmented by type, application, end-user, and geography. By type, the market is segmented into ceiling-mounted design, mobile-independent design, and dental chair-mounted design. By application, the market is segmented into examination, surgery, orthodontics, and others. By end user, the market is segmented into hospitals, dental clinics, and others. By geography, the market is segmented into North America, Europe, Asia-Pacific, Middle-East and Africa, and South America. The report also covers the estimated market sizes and trends for 17 countries across major regions globally. The report offers the value (in USD) for the above segments.
Segmentation Overview
| Ceiling-Mounted Design |
| Mobile-Independent Design |
| Dental Chair-Mounted Design |
| Powered |
| Non-Powered |
| Electromechanical |
| Hydraulic |
| Electric Motorized |
| Pneumatic / Manual |
| Examination |
| Surgery and Implantology |
| Orthodontics |
| Others |
| Dental Clinics |
| Hospitals |
| Ambulatory Surgery Centers |
| Others |
| Direct (Manufacturer to Practice) |
| Dealer / Distributor Sales |
| E-commerce and Online Portals |
| North America | United States |
| Canada | |
| Mexico | |
| Europe | Germany |
| United Kingdom | |
| France | |
| Italy | |
| Spain | |
| Rest of Europe | |
| Asia-Pacific | China |
| Japan | |
| India | |
| Australia | |
| South Korea | |
| Rest of Asia-Pacific | |
| Middle East and Africa | GCC |
| South Africa | |
| Rest of Middle East and Africa | |
| South America | Brazil |
| Argentina | |
| Rest of South America |
| By Design | Ceiling-Mounted Design | |
| Mobile-Independent Design | ||
| Dental Chair-Mounted Design | ||
| By Product Type | Powered | |
| Non-Powered | ||
| By Operation Mechanism | Electromechanical | |
| Hydraulic | ||
| Electric Motorized | ||
| Pneumatic / Manual | ||
| By Application | Examination | |
| Surgery and Implantology | ||
| Orthodontics | ||
| Others | ||
| By End-User | Dental Clinics | |
| Hospitals | ||
| Ambulatory Surgery Centers | ||
| Others | ||
| By Distribution Channel | Direct (Manufacturer to Practice) | |
| Dealer / Distributor Sales | ||
| E-commerce and Online Portals | ||
| By Geography | North America | United States |
| Canada | ||
| Mexico | ||
| Europe | Germany | |
| United Kingdom | ||
| France | ||
| Italy | ||
| Spain | ||
| Rest of Europe | ||
| Asia-Pacific | China | |
| Japan | ||
| India | ||
| Australia | ||
| South Korea | ||
| Rest of Asia-Pacific | ||
| Middle East and Africa | GCC | |
| South Africa | ||
| Rest of Middle East and Africa | ||
| South America | Brazil | |
| Argentina | ||
| Rest of South America | ||


Key Questions Answered in the Report
What is the current dental chair market size in 2026?
The dental chair market size stands at USD 0.96 billion in 2026.
How fast is the dental chair market expected to grow through 2031?
It is projected to expand at a 5.34% CAGR, reaching USD 1.24 billion by 2031.
Which region is growing fastest in the dental chair market?
The Asia-Pacific dental chair market is forecast to register a 7.80% CAGR between 2026-2031.
What design segment is expanding quickest?
Mobile-independent chairs lead growth at a 6.29% CAGR due to their flexible operatory placement.
Why are powered chairs dominating share?
Powered chairs integrate programmable positioning and digital interfaces, securing 64.62% share in 2025 and sustaining growth at 6.55% CAGR.
Page last updated on:


