
Specialty Medical Chairs Market Size and Share
Market Overview
| Study Period | 2020 - 2031 |
|---|---|
| Market Size (2026) | USD 4.71 Billion |
| Market Size (2031) | USD 6.46 Billion |
| Growth Rate (2026 - 2031) | 6.52 % |
| Fastest Growing Market | Asia Pacific |
| Largest Market | North America |
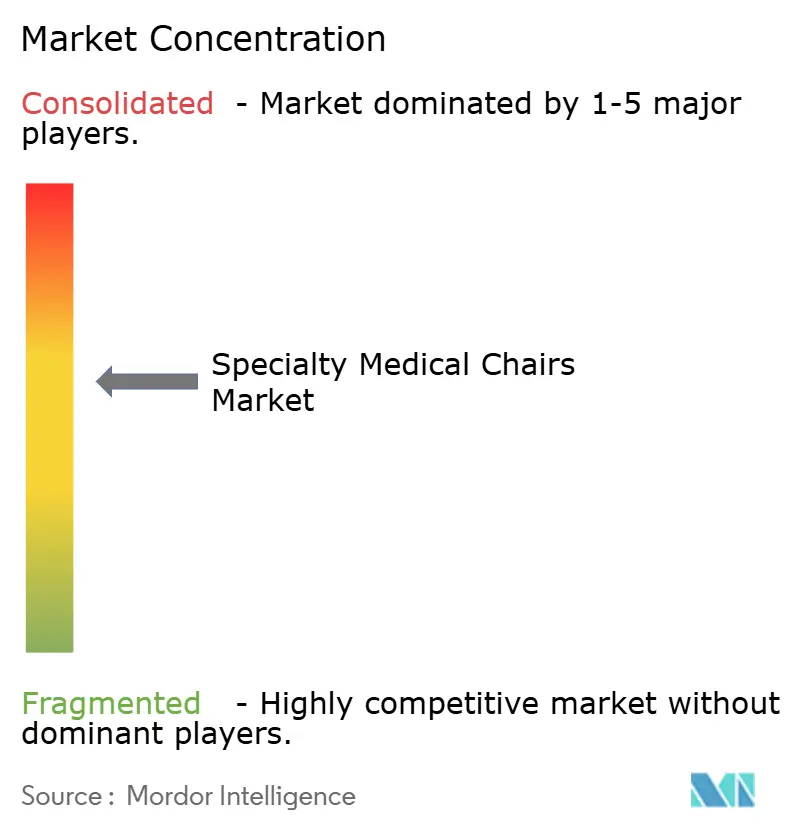
| Market Concentration | Medium |
Major Players *Disclaimer: Major Players sorted in no particular order Image © Mordor Intelligence. Reuse requires attribution under CC BY 4.0. | |
Specialty Medical Chairs Market Analysis by Mordor Intelligence
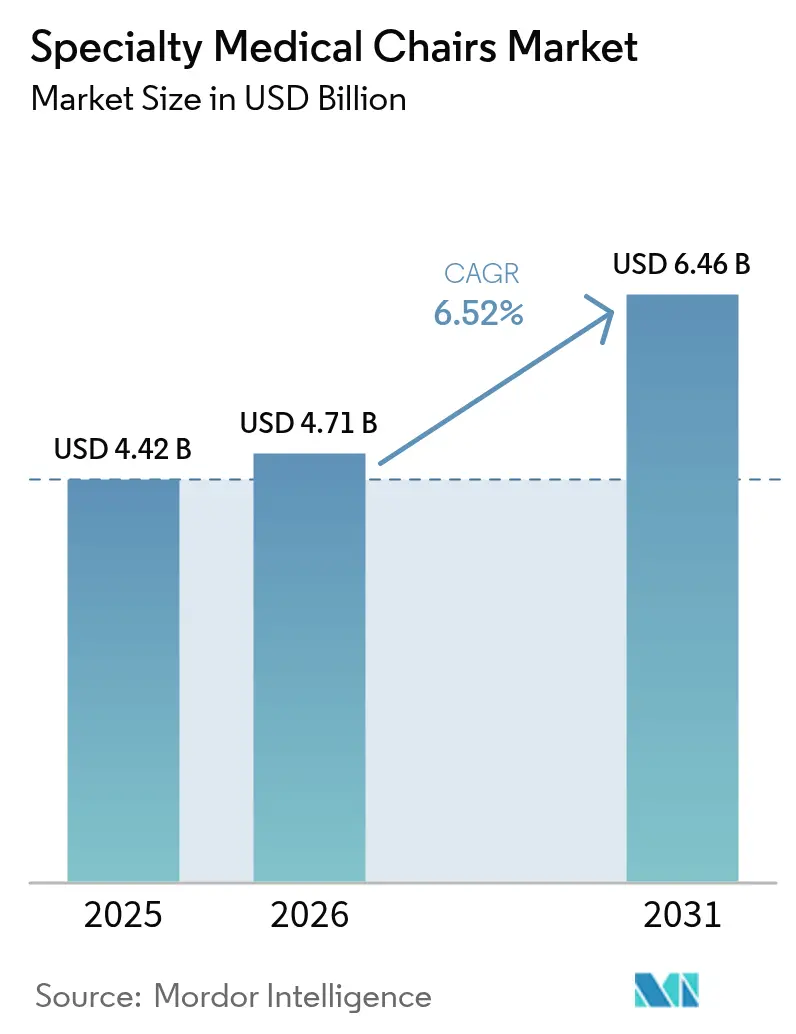
The Specialty Medical Chairs Market size is projected to expand from USD 4.42 billion in 2025 and USD 4.71 billion in 2026 to USD 6.46 billion by 2031, registering a CAGR of 6.52% between 2026 to 2031.
The demand for electric chairs in healthcare settings is being driven by key factors, including an aging population with multiple chronic conditions, payer strategies favoring cost-effective outpatient care, and procurement policies prioritizing electric chairs with embedded sensors for patient positioning documentation. Programmable designs that automate height, tilt, and Trendelenburg positioning are enhancing operational efficiency by reducing room turnover times and minimizing caregiver back injuries, which account for one-third of nursing-related lost-time incidents. While hospitals are replacing chairs to comply with Joint Commission pressure-injury standards, the fastest growth in unit sales is occurring in ambulatory surgery and day-care centers due to reimbursement shifts away from inpatient care. Manufacturers that certify cybersecurity compliance and offer modular upgrade pathways are expanding their market presence, as healthcare facilities increasingly consider software support and over-the-air updates as critical selection criteria.
Key Report Takeaways
- By product type, examination chairs contributed 38.03% of 2025 revenue, while treatment chairs are expanding at an 8.43% CAGR to 2031.
- By end user, hospitals accounted for 42.32% of 2025 spending; ambulatory surgery and day-care centers are growing at a 9.21% CAGR through 2031.
- By technology, fully electric programmable models commanded 39.03% of 2025 technology outlays and are advancing at an 8.65% CAGR.
- By geography, North America accounted for 42.12% of 2025 sales; Asia-Pacific is growing fastest at a 7.54% CAGR through 2031.
Note: Market size and forecast figures in this report are generated using Mordor Intelligence’s proprietary estimation framework, updated with the latest available data and insights as of 2026.
Market Trends and Insights
Drivers Impact Analysis of Specialty Medical Chairs Market*
| Driver | (~) % Impact on CAGR Forecast | Geographic Relevance | Impact Timeline |
|---|---|---|---|
| Growing geriatric and multimorbidity patient population | +1.8% | North America, Europe, East Asia | Long term (≥ 4 years) |
| Shift toward fully electric and IoT-enabled chairs enhancing clinical efficiency | +1.5% | North America, European Union, APAC urban centers | Medium term (2-4 years) |
| Rising outpatient surgery and day-care centers in emerging economies | +1.3% | China, India, Southeast Asia, Latin America | Medium term (2-4 years) |
| Mandatory pressure injury prevention guidelines in acute care facilities | +1.2% | North America, European Union, Australia, Middle East | Short term (≤ 2 years) |
| Procurement policies favoring low-VOC and recyclable upholstery materials | +0.6% | Europe, United Kingdom, California | Medium term (2-4 years) |
| Imaging-suite demand for MRI-compatible and anti-static chair designs | +0.4% | United States, Germany, Japan | Short term (≤ 2 years) |
| Source: Mordor Intelligence | |||
Growing Geriatric and Multimorbidity Patient Population
Adults aged 65 and older will represent 16% of the global population by 2030, up from 9.3% in 2020, and they show an average of 2.9 chronic illnesses that require frequent clinical encounters. Bariatric-rated chairs that lift up to 272 kg and feature powered leg-rest extensions help clinicians examine frail patients without manual handling, cutting the 35% incidence of caregiver back injuries recorded by the National Institute for Occupational Safety and Health. Japan reported that citizens aged 75 plus accounted for 38% of outpatient visits in 2025, accelerating demand for height-adjustable examination chairs that align with wheelchairs and reduce fall risk[1]Ministry of Health, Labour and Welfare, “Patient Survey 2025,” mhlw.go.jp. Longer appointment times for multimorbid patients drive clinics to adopt memory presets that restore optimal positions between visits. In the United States, 68% of seniors manage at least two chronic diseases, ensuring a steady replacement cycle as manual chairs reach ergonomic limits.
Shift Toward Fully Electric and IoT-Enabled Chairs Enhancing Clinical Efficiency
IoT-ready chairs integrate weight sensors and tilt encoders that stream data to electronic health records, satisfying Joint Commission documentation requirements. A 2024 Journal of Medical Internet Research study showed that connected chairs trimmed room turnover time by 22% in ambulatory clinics, freeing nursing staff for direct care[2]Journal of Medical Internet Research, “Smart Examination Chairs Reduce Turnover Time,” jmir.org. The FDA’s October 2023 cybersecurity guidance obliges manufacturers to submit a software bill of materials and prove encryption, driving investment in embedded Linux and secure update paths. Stryker’s ProCuity platform demonstrates the value of predictive analytics that alert caregivers when a patient exceeds pressure thresholds, positioning sensor-rich chairs as part of a wider surface ecosystem. European buyers now require IEC 62304-compliant software life-cycle evidence, embedding cybersecurity as a decisive tender criterion.
Rising Outpatient Surgery and Day-Care Centers in Emerging Economies
Outpatient visits in China reached 8.5 billion in 2024, up 6.3% year on year, backed by USD 140 billion in Healthy China 2030 primary-care funding. India’s Ayushman Bharat scheme covers 550 million citizens and reimburses day-surgery performed in accredited centers, which fuels demand for treatment chairs with integrated IV poles and antimicrobial upholstery. Brazil’s Previne Brasil ties federal transfers to municipalities that meet outpatient surgery targets, nudging facilities toward semi-electric and fully electric models that speed patient turnover. Fresenius Medical Care reports that dialysis chairs paired with its 5008 CorDiax system cut patient setup time by 15%, allowing clinics to schedule one extra session per day. Overall, surgery migration to ambulatory sites is cementing treatment chairs as the fastest-growing product category.
Mandatory Pressure Injury Prevention Guidelines in Acute Care Facilities
The National Pressure Injury Advisory Panel’s 2025 update urges repositioning immobile patients every 2 hours and documenting surface suitability, elevating demand for chairs with pressure-mapping sensors. The Joint Commission added pressure-injury risk assessment to its 2024 safety goals, compelling hospitals to adopt powered-tilt chairs in emergency, infusion, and dialysis units. Canada’s nursing guidelines recommend tilt-in-space seating during long procedures to keep sacral pressure below the 32 mm Hg capillary threshold. The US Department of Veterans Affairs earmarked USD 87 million in 2024 to replace chairs older than 10 years with bariatric-compliant powered models across all VA centers. These rules shorten refresh cycles despite wider budget pressure and shift demand toward premium programmable designs.
Restraints Impact Analysis of Specialty Medical Chairs Market*
| Restraint | (~) % Impact on CAGR Forecast | Geographic Relevance | Impact Timeline |
|---|---|---|---|
| Post-pandemic capital budget constraints in hospitals and clinics | –0.9% | North America, Western Europe | Short term (≤ 2 years) |
| Limited reimbursement coverage for specialty chairs in non-hospital settings | –0.7% | North America, selected EU markets, emerging APAC | Medium term (2-4 years) |
| Supply-chain bottlenecks for UL-94 fire-safe actuator components | –0.6% | Global, concentrated in East Asia sourcing hubs | Short term (≤ 2 years) |
| Lengthy cybersecurity certification cycles for connected chair software | –0.5% | North America, European Union | Medium term (2-4 years) |
| Source: Mordor Intelligence | |||
Post-Pandemic Capital Budget Constraints in Hospitals and Clinics
Hospital equipment budgets fell 12% in 2024 as facilities diverted funds to wage inflation, EHR upgrades, and debt service, according to the Healthcare Financial Management Association[3]Healthcare Financial Management Association, “2024 Capital Survey,” hfma.org. US data show that 36% of hospitals ran at negative margins in 2024, extending chair replacement cycles from 7 to almost 10 years. German hospitals reported operating margins of 1.2% in 2025, the lowest in a decade, limiting orders for furniture and patient-handling equipment. Manufacturers are piloting lease-to-own programs, yet finance teams remain wary of off-balance-sheet arrangements for assets lacking a discrete billing code. As a result, capital deferment will dampen order flow until labor and energy costs stabilize.
Limited Reimbursement Coverage for Specialty Chairs in Non-Hospital Settings
Medicare Part B and most Medicaid plans classify specialty chairs as facility equipment rather than durable medical equipment, leaving home-care patients to self-fund USD 3,200 to USD 8,500 per unit. Only 18% of assisted-living operators had upgraded to programmable models by 2025 because state per-diem rates exclude powered seating. Home-health agencies that serve 3.4 million Medicare beneficiaries annually use improvised seating because the prospective payment system lacks a line item for treatment chairs, constraining the acuity of home care. This reimbursement void curtails near-term expansion into residential and long-term care channels.
*Our forecasts treat driver/restraint impacts as directional, not additive. The impact forecasts reflect baseline growth, mix effects, and variable interactions.
Specialty Medical Chairs Market Segment Analysis
By Product Type:
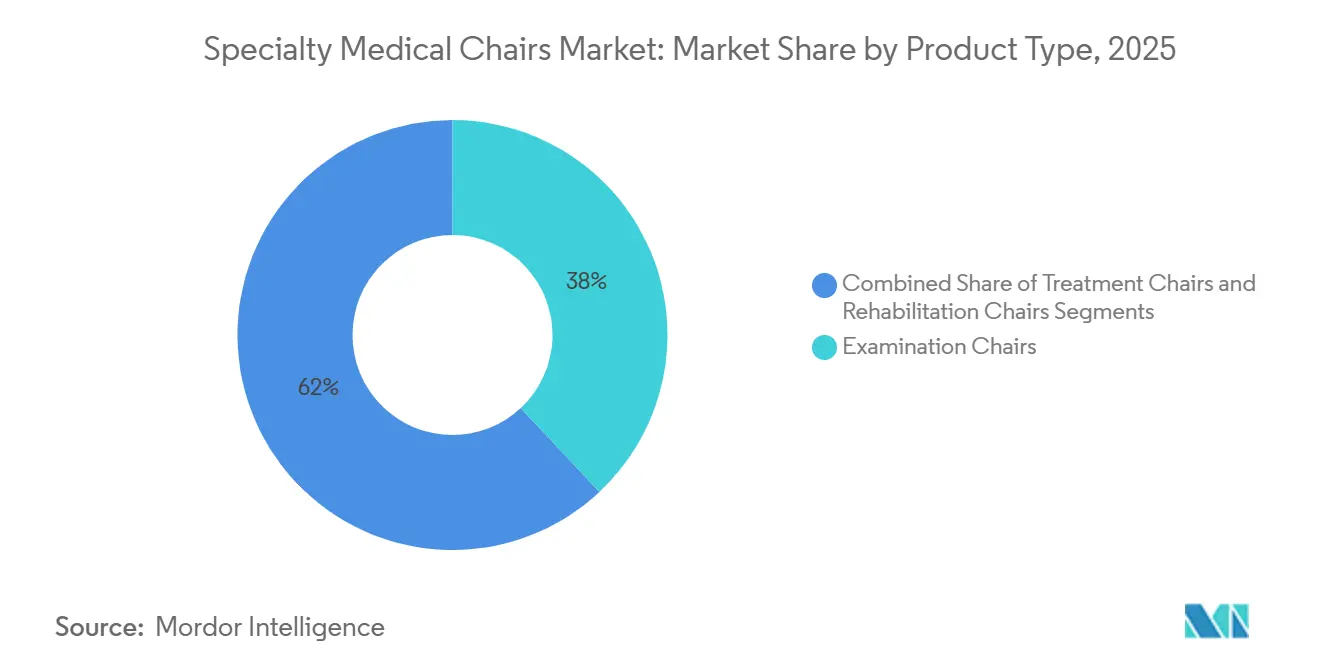
Treatment Chairs Lead Growth TrajectoryTreatment chairs are expanding at an 8.43% CAGR to 2031 as oncology, dialysis, and day-surgery sites replace manual recliners with chairs offering integrated scales and antimicrobial upholstery. Examination chairs retained 38.03% of 2025 revenue, a testament to their ubiquity in primary-care and specialist offices. Rehabilitation chairs remain niche but are benefitting from bundled payment programs that incentivize faster discharge and outpatient physical therapy.
This growth spread underscores the structural pivot toward outpatient infusion and hemodialysis sessions, where the specialty medical chairs market size for treatment settings is projected to widen its lead through 2031. Fresenius Medical Care reports its CorDiax chair platform trims session preparation by 15%, strengthening provider economics. Competitive pressure is intensifying as Asian manufacturers supply look-alike models at prices 30% lower than Western brands, compelling incumbents to differentiate via IoT connectivity and extended warranties.



By Technology:
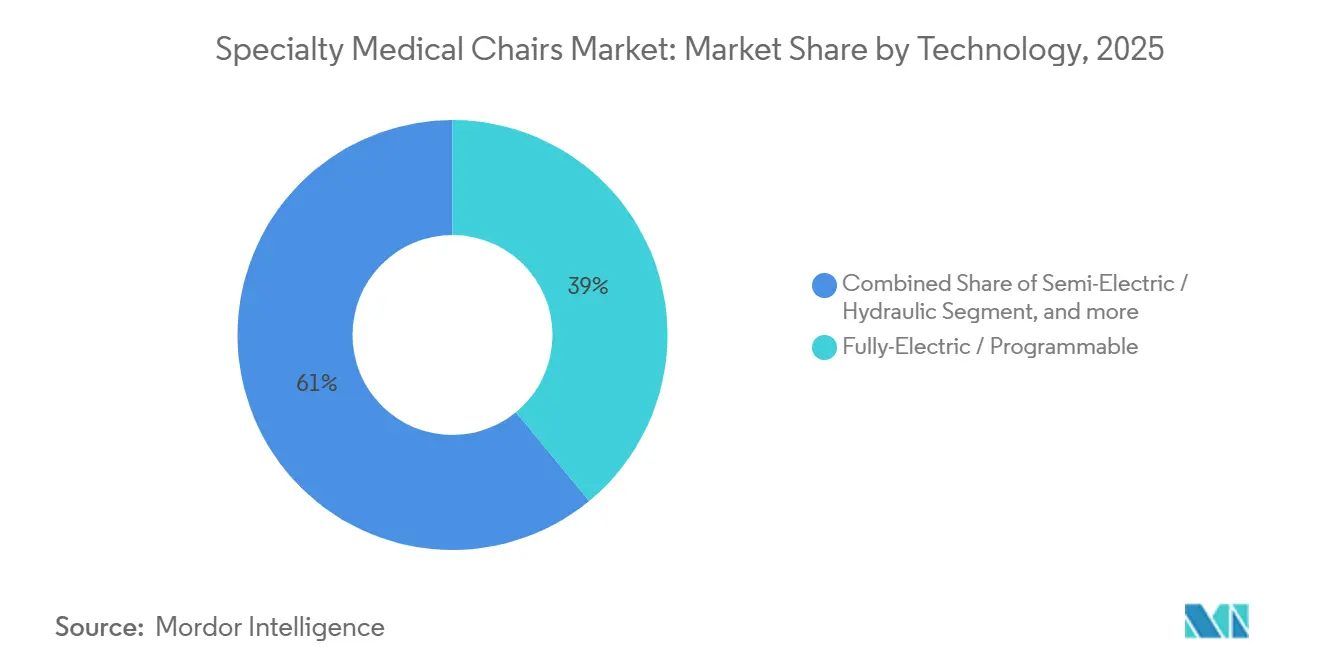
Programmable Electric Models Dominate UpgradesFully electric programmable chairs represented 39.03% of 2025 purchases and are rising at an 8.65% CAGR through 2031 because automated height, tilt, and memory presets cut caregiver injury risk and lift clinic throughput. Manual and hydraulic chairs are losing ground as safety regulators tie staff injury reduction to powered equipment adoption.
The specialty medical chairs market share for connected models is set to climb steadily as the FDA now requires a software bill of materials for every network-enabled chair. European tenders increasingly score cybersecurity readiness alongside ergonomic criteria, prompting suppliers to bundle encrypted firmware updates inside multiyear service contracts. Manual variants retain a role in rural health posts that face intermittent electricity or limited technical support.
By End User:
Ambulatory Centers Accelerate AdoptionHospitals provided 42.32% of 2025 spending, reflecting installed bases and regulatory urgency, yet ambulatory surgery and day-care centers are advancing at a 9.21% CAGR as payers reward lower-cost outpatient episodes. Clinics and dental offices contribute a steady mid-tier share aligned with practice expansions and lease expirations.
Reimbursement differentials explain the surge: the US Hospital Outpatient Prospective Payment System reimburses ASCs at 58% of the hospital rate, so centers maximize chair throughput to sustain margins. Conversely, the specialty medical chairs industry still sees limited penetration into home-care settings because reimbursement voids deter investment in powered equipment.
Geography Analysis
North America Specialty Medical Chairs Market
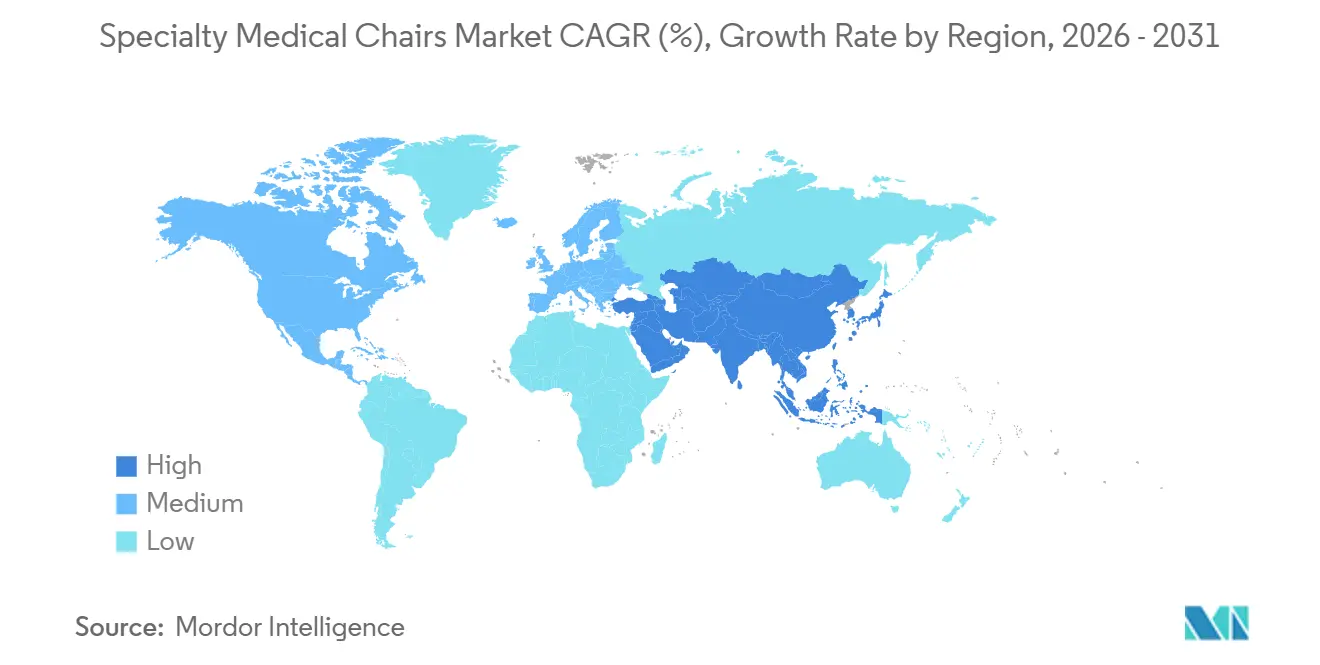
North America accounted for 42.12% of 2025 revenue owing to Joint Commission pressure-injury standards that push facilities toward chairs with pressure-mapping sensors. The US Department of Veterans Affairs earmarked USD 87 million in 2024 for fleet renewal, illustrating public-sector influence on procurement. Margin erosion has stretched replacement cycles, yet liability risk keeps baseline demand resilient.
APAC Specialty Medical Chairs Market
Asia-Pacific is advancing at a 7.54% CAGR to 2031, the fastest regional pace. China’s Healthy China 2030 allocates USD 140 billion to community health stations that must install Bureau of Indian Standards-compliant seating, while India’s Ayushman Bharat extends coverage to 550 million citizens, rewarding accredited day-care centers that invest in programmable chairs. Japan’s super-aging cohort pushes clinics to adopt height-adjustable models that facilitate wheelchair transfers.
EMEA and South America Specialty Medical Chairs Market
Europe shows moderate growth as fiscal constraints limit capital budgets. German hospitals report record-low margins, and the United Kingdom’s net-zero supply chain rules now favor modular chairs with replaceable actuators over single-use designs. Middle East, Africa, and South America remain project-driven markets tied to new hospital construction in urban medical hubs.

Regulatory Landscape
Specialty medical chairs are regulated primarily as medical devices where the intended use covers patient positioning, treatment support, fall prevention, or rehabilitation. In the United States, FDA product classifications include electric positioning chairs under 21 CFR 890.3110, generally requiring 510(k) premarket notification as Class II when powered and used for clinical positioning, while some non-powered chair categories can fall under Class I controls and exemptions depending on intended use and labeling. As chairs add connectivity and software, compliance expectations increasingly extend beyond mechanical safety to software lifecycle controls (for example, IEC 62304-aligned documentation) and cybersecurity submissions that align with FDA guidance for connected medical devices.
In Europe, Regulation (EU) 2017/745 (EU MDR) governs medical chairs marketed with a medical intended purpose, commonly as Class I for non-sterile, non-measuring configurations, but with expanded technical documentation, post-market surveillance, and clinical evaluation obligations compared with legacy regimes. Cross-border regulatory coordination is also gaining visibility: in July 2026, Malaysia MDA and China NMPA advanced Phase 2 of a Joint Evaluation Pilot Programme under a GHWP framework to reduce duplicate reviews for devices submitted in both markets, indicating that multi-market pathways are becoming more structured for manufacturers managing global launches.
Value Chain Analysis
The value chain spans component suppliers (actuators, motors, controls, sensors, upholstery, and metals such as steel and aluminum), sub-assembly and final manufacturing (frames, powered lift and tilt mechanisms, embedded electronics, and patient-contact surfaces), verification and compliance testing, and distribution to care settings through direct sales and medical device distributors. As chair designs move toward fully electric programmable and connected models, upstream dependence on electronics and fire-safe actuator components becomes more central, while downstream buyers increasingly require validated integration with clinical workflows (positioning documentation, serviceability, and software support). Regulatory and standards compliance requirements (for example, IEC 60601-1-aligned electrical safety expectations for powered equipment, ISO 10993 considerations for patient-contact materials, and IEC 62304-aligned software lifecycle evidence for digital features) add testing and documentation nodes that shape lead times and supplier qualification.
On the demand side, purchasing is dominated by hospitals and expanding ambulatory surgery and day-care centers, with procurement often routed through group purchasing organizations and evaluated by clinical engineering and ergonomics stakeholders alongside finance. After-sales service, preventive maintenance, and parts logistics have become core value-chain differentiators because powered chairs have higher uptime sensitivity and a broader spare-parts footprint than manual variants. Supply chain resilience efforts in medtech, including deeper multi-sourcing for electronics and improved supply visibility, increasingly tie back to compliance and delivery continuity as component availability tightens.
Competitive Landscape
The top five players—Stryker, Midmark, Hill-Rom (Baxter), Dentsply Sirona, and Fresenius Medical Care—account for about 38% of global revenue by bundling chairs, service contracts, and predictive-maintenance software through group purchasing organizations. Modular accessory platforms and recurring software subscriptions help these firms offset slower capital cycles.
Market challengers are carving out niches such as MRI-compatible chairs that use non-ferromagnetic actuators to comply with imaging-suite protocols. Sensor-embedded models that auto-populate electronic health records address CMS quality-reporting metrics and open cross-sell pathways into broader patient-surface ecosystems.
Barriers to entry are rising as the FDA enforces cybersecurity submissions and vulnerability disclosure, raising compliance costs for mid-tier manufacturers. Invacare’s 2024 exit from Chapter 11 underlines the funding strain faced by firms that lack scale to absorb component inflation and testing overhead. Emerging Asian manufacturers gain market share in price-sensitive markets but struggle with after-sales support in mature regions.
Specialty Medical Chairs Industry Leaders
Dentsply Sirona
A-dec Inc.
PLANMECA OY
Midmark Corporation
Fresenius Medical Care AG & Co. KGaA
- *Disclaimer: Major Players sorted in no particular order
Specialty Medical Chairs Market Companies Covered in this Report
- Acime SAS
- ActiveAid Inc.
- A-dec
- Atmos MedizinTechnik GmbH
- Champion Manufacturing Inc.
- Danaher Corp. (KaVo Dental)
- DentalEZ
- Dentsply Sirona
- Drive DeVilbiss Healthcare
- Forest Dental
- Fresenius
- Greiner GmbH
- Heinemann Medizintechnik GmbH
- Hill-Rom
- Invacare
- Likamed GmbH
- Midmark
- PLANMECA Oy
- Stryker

Market Opportunities and Future Outlook
A whitespace is emerging in connected, serviceable chair fleets that support outpatient throughput while meeting documentation and pressure-injury prevention requirements. Hospitals and ambulatory sites are aligning purchases with quality and safety programs such as the Joint Commission patient safety goals and the National Pressure Injury Advisory Panel 2025 update, which elevates the value of powered tilt, pressure management, and documentation-ready features that reduce manual handling and support audit trails. At the same time, cybersecurity and software lifecycle compliance have become buying criteria for IoT and sensor-enabled chairs, creating a clearer path for vendors that can bundle validated software maintenance, encrypted update pathways, and multi-year service agreements into tenders.
Opportunity also extends to capacity expansion and new product intelligence in adjacent seating and mobility ecosystems. In January 2026, Jin Medical International described its 430,000-square-foot Chuzhou facility as entering final construction with full-capacity production timing targeted by end-April 2026 for electric mobility products, a signal of scaling capability for powered platforms and component ecosystems that overlap with electrically actuated clinical seating. In June 2026, Kalogon reported raising USD 5.75 million to support international expansion and invest further in the intelligence of its smart seating systems, reinforcing market pull toward sensor-driven seating outcomes, software-enabled differentiation, and broader geographic go-to-market execution beyond traditional hospital furniture channels.
Recent Industry Developments in Specialty Medical Chairs Market
- May 2026: Dentsply Sirona launched Smart View - Detect, an AI-enabled diagnostic aid delivered through the DS Core cloud platform in the United States and Europe. While centered on dental imaging software, the release highlights how cloud-connected operatory workflows are being specified alongside chairs and other delivery systems.
- March 2026: A-dec and Dentsply Sirona extended their strategic partnership, integrating the Dentsply Sirona Midwest Motor System directly into A-dec 500 Pro and A-dec 300 Pro delivery systems. The expanded interoperability supports tighter integration of powered chair-side hardware and procedural tools.
- January 2025: A-dec increased its standard product warranty from five years to ten years for core equipment, including dental chairs, delivery systems, lights, and stools. Longer warranty coverage raises the bar on reliability and lifecycle cost commitments, which can shape tender evaluations where uptime, service terms, and total cost of ownership are emphasized.


Specialty Medical Chairs Market Report Scope and Research Methodology
Market Definition and Coverage
This market covers purpose-built specialty chairs used to position and support patients during examination, treatment, diagnostics, and minor procedures in medical and dental care settings, and the revenue is counted in USD at the point of sale.
Scope exclusions: General hospital beds, basic clinic stools, and over-bed tables are not counted, even if they are used around similar care workflows.
Segments Covered in This Report
- By Product Type
- Examination Chairs
- Cardiac Chairs
- Birthing Chairs
- Blood-Drawing Chairs
- Dialysis Chairs
- Mammography Chairs
- Other Examination Chairs
- Treatment Chairs
- ENT Chairs
- Ophthalmic Chairs
- Dental Chairs
- Infusion / Oncology Chairs
- Other Treatment Chairs
- Rehabilitation Chairs
- Geriatric Chairs
- Pediatric Chairs
- Bariatric Chairs
- Other Rehabilitation Chairs
- Examination Chairs
- By Technology
- Manual
- Semi-Electric / Hydraulic
- Fully-Electric / Programmable
- IoT / Connected & Sensor-Enabled
- By End User
- Hospitals
- Clinics & Dental Practices
- Ambulatory Surgery & Day-Care Centers
- Home-Care & Long-Term Care Settings
- Geography
- North America
- United States
- Canada
- Mexico
- Europe
- Germany
- United Kingdom
- France
- Italy
- Spain
- Rest of Europe
- Asia-Pacific
- China
- Japan
- India
- Australia
- South Korea
- Rest of Asia-Pacific
- Middle East & Africa
- GCC
- South Africa
- Rest of Middle East & Africa
- South America
- Brazil
- Argentina
- Rest of South America
- North America
Data Sources, Market Sizing, and Validation
Desk Research
Desk research was used to set the guardrails for what should and should not be counted, and to build a starting view of demand signals tied to chair utilization in care delivery. We reviewed public health system statistics and procedure volumes from sources such as the US CDC, the OECD, and the World Bank, followed by trade and production indicators from sources such as UN Comtrade and national customs publications.
To keep the assumptions grounded, we also checked device and safety standards information from sources such as the FDA and ISO references, plus clinical publications in peer-reviewed journals that discuss procedure mix and care setting shifts. Alongside these, company filings, investor presentations, and reputable press were used to understand product mix trends like manual versus electric configurations and typical replacement cycles. Where needed, a paid subscription database was used for company financials and patent activity to validate product launches and innovation intensity. The desk sources listed here are illustrative, and additional public references were reviewed during data collection and cross-checking.
Primary Interviews and Surveys
Primary interviews focused on what actually drives buying decisions, pricing movement, and replacement timing across key care settings, and these inputs were used to set the model assumptions. We spoke with manufacturers, distributors, procurement staff, and clinical users across APAC, EMEA, and the Americas, so we could compare regional adoption patterns and tender behavior and correct any mismatches found during desk research.
Distribution of primary research fieldwork respondents
| Company type | Respondent position | Region |
|---|---|---|
| Top tier: 28% | CXOs: 18% | APAC: 46% |
| Mid tier: 54% | Functional/Unit leaders: 37% | EMEA: 35% |
| Smaller Players: 18% | Managers: 45% | Americas: 19% |
Market-Sizing & Forecasting
The sizing starts with a top-down build where procedure volumes and care setting activity are used to reconstruct an addressable demand pool for specialty chairs, and then translated into value using typical unit-to-site ratios and blended pricing. Once that structure is set, we corroborate totals with selective bottom-up approximations, such as supplier revenue roll-ups from public disclosures, sampled average selling price checks, and channel feedback. When the model gaps are repeatedly linked to a clear assumption issue, the structure is adjusted instead of forcing a fit.
Key inputs used in the model include the share of procedures requiring patient positioning support, the installed base and refresh cycle for examination and treatment rooms, the adoption rate of electric and semi-electric configurations, average selling prices by chair type, and the pace of ambulatory and outpatient expansion. When primary feedback indicated missing volumes, we handled the gap through conservative penetration assumptions by care setting, then re-tested those assumptions against trade flow direction and product shipment signals.
For forecasting, scenario analysis was used to translate expected procedure growth, facility additions, and pricing direction into annual demand. Forecast paths were reviewed with expert consensus for each region, so short-term variability does not overly swing the longer-term trajectory.
Data Validation & Update Cycle
Outputs are validated by comparing modeled totals against independent signals, such as procedure growth patterns, facility expansion indicators, and observed pricing direction from channel checks. If any region shows a sharp jump that cannot be explained by these signals, the assumptions are reopened, and targeted re-contacts are triggered to clarify what changed.
Before sign-off, the model and written outputs go through multiple analyst review steps, which helps catch unit errors, double counting between chair categories, and currency timing issues. The report is refreshed annually, and interim updates are made when material events occur, such as major regulatory changes or pricing shifts. Right before delivery, a final pass is performed so clients receive the latest updated view.
Mordor Intelligence's Specialty Medical Chairs Market Estimate Compared With Other Published Estimates
Published market sizes for specialty medical chairs often vary because study boundaries are not always the same, and the underlying demand indicators can be selected differently. The biggest differences usually come from what chair types are included, whether dental and outpatient settings are fully counted, and how pricing is converted and updated across regions.
By tracking procedure volume signals and installed base refresh cycles, Mordor Intelligence keeps the estimate tied to chair replacement and new room additions, instead of only applying broad equipment spending growth rates.
Benchmark comparison
| Source | Market Size | Gaps in Research Methodology |
|---|---|---|
| Mordor Intelligence | USD 4.71 B (2026) | |
| Global Research Publisher A | USD 4.40 B (2023) | Uses an earlier base year and a shorter forecasting window, and the scope is not clearly stated for inclusion of dental and ambulatory settings, which can shift the addressable demand pool. |
| Industry Research Publisher B | USD 4.60 B (2024) | Back-solves value from overall healthcare equipment growth with limited visibility on chair type mix, and currency conversion timing is not clearly explained, which can widen cross-region variance. |
Taken together, the spread mainly reflects scope edges and how the demand pool is built, not just different math. Our approach stays traceable because each region is linked back to procedure activity, care setting footprint, and realistic price progression checks that can be repeated and reviewed over time.


Key Questions Answered in the Report
What is the current value of the specialty medical chairs market?
It was USD 4.71 billion in 2026 and is projected to reach USD 6.46 billion by 2031.
Which product category is growing fastest?
Treatment chairs show the highest growth, advancing at an 8.43% CAGR through 2031.
Why are fully electric chairs gaining traction?
They automate height and tilt adjustments, cut caregiver injury risk, meet pressure-injury standards, and integrate with electronic health records.
Which region will post the highest growth?
Asia-Pacific leads with a forecast 7.54% CAGR, driven by China's Healthy China 2030 and India's Ayushman Bharat investments.
How do reimbursement gaps affect adoption in home-care settings?
Medicare and most Medicaid plans exclude specialty chairs from durable equipment coverage, so patients often self-fund, limiting residential uptake.
Who are the key market leaders?
Stryker, Midmark, Hill-Rom (Baxter), Dentsply Sirona, and Fresenius Medical Care together control about 38% of global revenue.
Page last updated on:


 Your data is secure and never sold or shared.


