Dental Bone Graft Substitutes Market Size and Share
Market Overview
| Study Period | 2020 - 2031 |
|---|---|
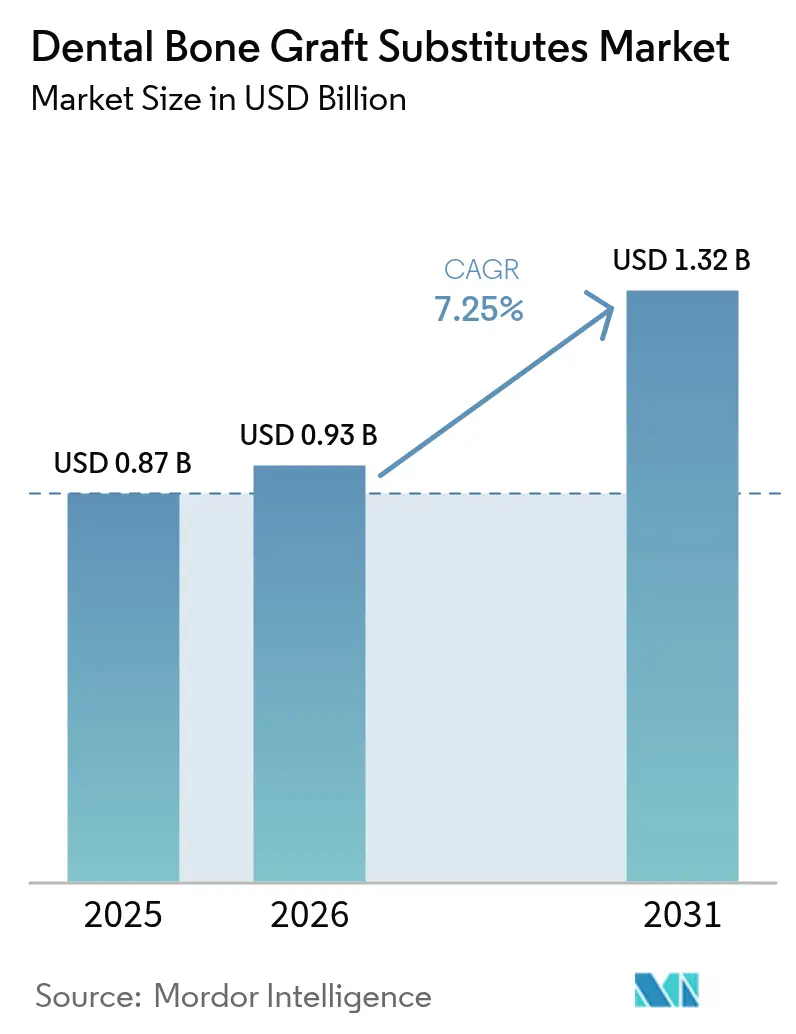
| Market Size (2026) | USD 0.93 Billion |
| Market Size (2031) | USD 1.32 Billion |
| Growth Rate (2026 - 2031) | 7.25% CAGR |
| Fastest Growing Market | Asia-Pacific |
| Largest Market | North America |
| Market Concentration | Medium |
Major Players*Disclaimer: Major Players sorted in no particular order Image © Mordor Intelligence. Reuse requires attribution under CC BY 4.0. | |
Dental Bone Graft Substitutes Market Analysis by Mordor Intelligence
The dental bone graft substitutes market size is expected to grow from USD 0.87 billion in 2025 to USD 0.93 billion in 2026 and is forecast to reach USD 1.32 billion by 2031 at 7.25% CAGR over 2026-2031. Steady expansion reflects the shift from autograft dependency toward synthetic solutions that satisfy clinical, ethical, and supply-chain demands. Three macro forces underpin this growth: a rising elderly population prone to edentulism, an escalating global periodontal disease burden, and rapid adoption of CAD/CAM-enabled customization that improves surgical accuracy. Growing medical tourism—especially in Thailand, where the medical device sector totaled USD 7.2 billion in 2024—funnels international patients to high-quality yet affordable clinics. Meanwhile, payer policies such as UnitedHealthcare’s 2024 update increasingly reimburse ridge preservation, stimulating procedure volumes.
Key Report Takeaways
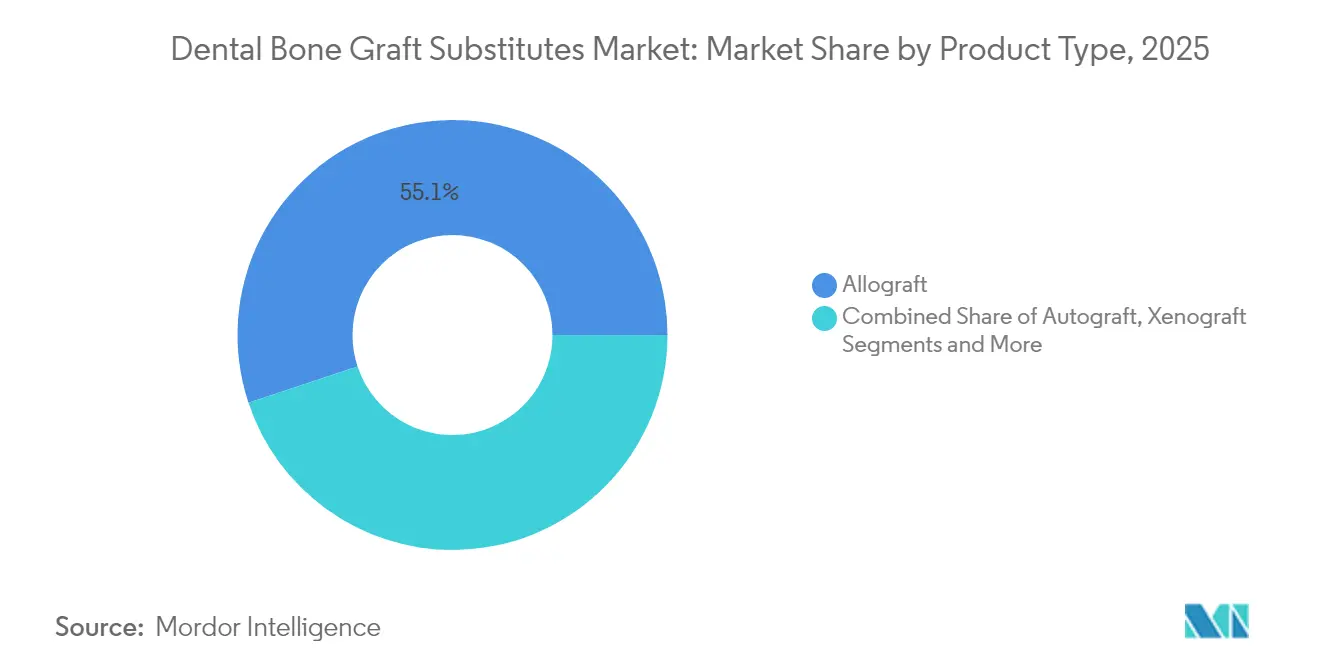
- By product type, allografts led with 55.10% revenue share in 2025; synthetic/alloplast materials are forecast to expand at a 9.78% CAGR to 2031.
- By mechanism, osteoconduction accounted for 60.10% of the dental bone graft substitutes market share in 2025, while osteoinduction is projected to rise at a 9.02% CAGR through 2031.
- By material, ceramic-based solutions held 43.30% share of the dental bone graft substitutes market size in 2025; growth factor-enhanced materials are set to climb at an 10.74% CAGR between 2026-2031.
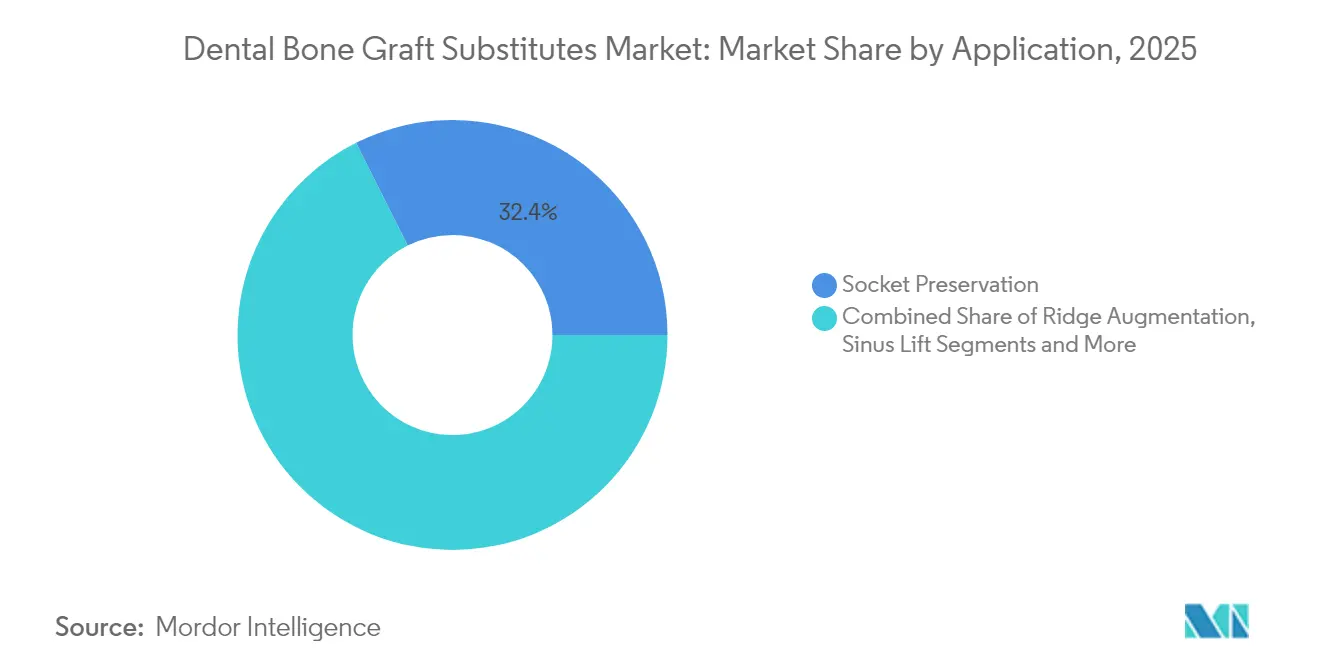
- By application, socket preservation captured 32.40% share in 2025; implant bone regeneration is poised for the fastest 12.05% CAGR to 2031.
- By end user, hospitals controlled 48.30% share in 2025, whereas dental clinics are advancing at a 9.28% CAGR through 2031.
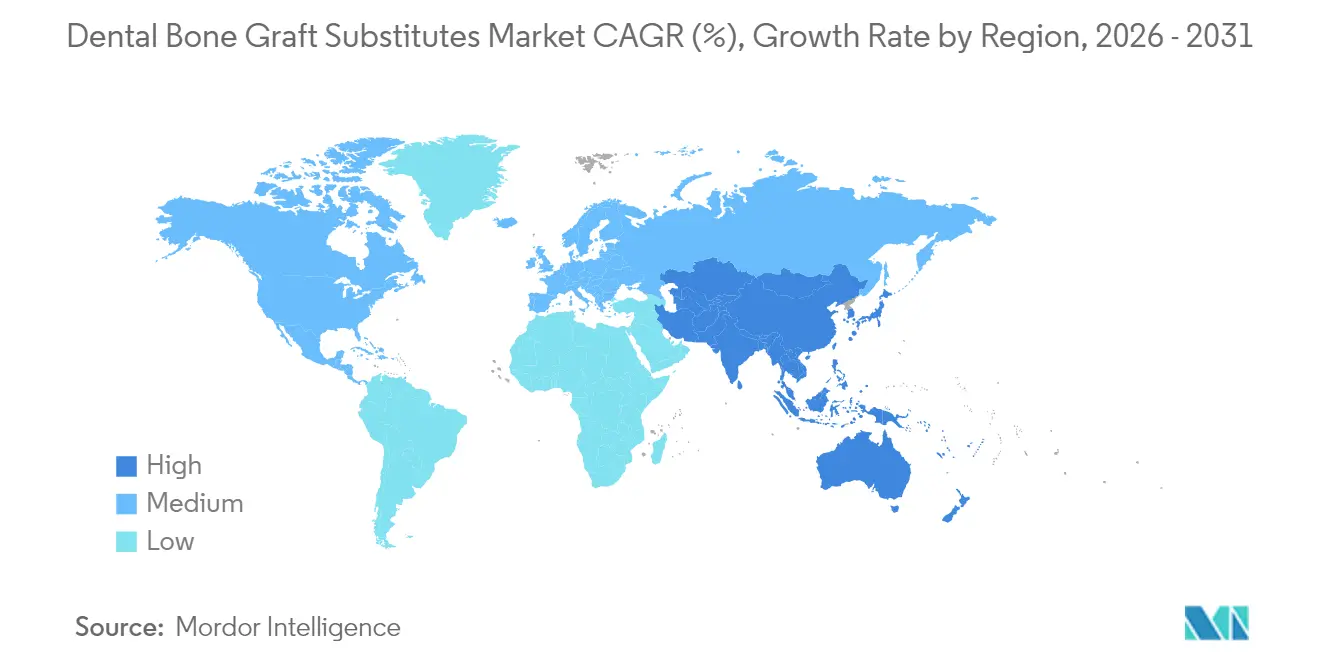
- By geography, North America captured 35.40% revenue share in 2025, yet Asia-Pacific is forecast to grow at a 11.05% CAGR to 2031.
Note: Market size and forecast figures in this report are generated using Mordor Intelligence’s proprietary estimation framework, updated with the latest available data and insights as of 2026.
Global Dental Bone Graft Substitutes Market Trends and Insights
Drivers Impact Analysis*
| Driver | (~) % Impact on CAGR Forecast | Geographic Relevance | Impact Timeline |
|---|---|---|---|
| Soaring outbound medical & dental tourism flows | +1.2% | Asia-Pacific core, spill-over to MEA | Medium term (2-4 years) |
| Escalating global burden of periodontal & edentulous disorders | +1.8% | Global | Long term (≥ 4 years) |
| Rapid adoption of CAD/CAM & 3-D printing-enabled custom grafts | +1.5% | North America & EU, expanding to APAC | Short term (≤ 2 years) |
| Growing preference for synthetic alloplasts amid religious/ethical concerns | +0.9% | Global, strong in Middle East | Medium term (2-4 years) |
| Favorable reimbursement expansion for regenerative dental procedures | +0.8% | North America & EU | Medium term (2-4 years) |
| Emergence of growth-factor–laden biomimetic matrices | +1.1% | Global, early adoption in developed markets | Long term (≥ 4 years) |
| Source: Mordor Intelligence | |||
Escalating Global Burden of Periodontal & Edentulous Disorders
The World Health Organization reports that 3.5 billion people live with oral diseases, generating USD 387 billion in direct costs each year. Severe periodontitis accelerates alveolar bone loss, expanding the need for regeneration solutions. Clinical trials show 35.6% greater bone volume when FGF-2-impregnated atelocollagen sponges are used. An aging demographic exacerbates demand, as 353 million people were edentulous in 2024, with projections of 661 million by 2050. This demographic and clinical pressure directly fuels procedure volumes within the dental bone graft substitutes market.
Rapid Adoption of CAD/CAM & 3-D Printing-Enabled Custom Grafts
Nanoscale 3-D printing breakthroughs from the University of Sydney deliver bone-mimicking scaffolds with natural-like porosity and strength[1]Hala Zreiqat, “3D Printing Bones at the Nano Level Achieved,” sydney.edu.au. Open-source CAD/CAM software lets surgeons design titanium meshes that fit precisely, shortening operating times. Bioactive glass scaffolds fabricated through additive manufacturing yielded 43.93% bone volume fraction in atrophic ridges. These digital workflows command premium pricing yet curb revision rates, sustaining margin expansion for suppliers competing in the dental bone graft substitutes market.
Growing Preference for Synthetic Alloplasts Amid Religious/Ethical Concerns
Coral-inspired synthetic matrices achieve complete defect repair in 3-6 months without exogenous biologics. Religious constraints and disease transmission fears intensified after a 2023 tuberculosis outbreak from contaminated allografts in seven U.S. states[2]Centers for Disease Control and Prevention, “Second Nationwide Tuberculosis Outbreak Caused by Bone Allografts Containing Live Cells — United States, 2023,” cdc.gov. Beta-tricalcium phosphate–calcium sulfate blends re-mineralize 50% in 12 weeks and 85% by week 33. Producers such as Biomatlante have shipped synthetic grafts to 50+ countries, underscoring global traction.
Emergence of Growth-Factor–Laden Biomimetic Matrices
Recombinant PDGF-BB paired with osteoconductive matrices already claims FDA approval for alveolar repairs and matches autograft outcomes. Platelet-rich fibrin doubles as scaffold and biologic reservoir, enhancing stem-cell proliferation. Nano-sustained release platforms entering Phase II trials align growth-factor kinetics with tissue formation. A spinal fusion study reported 100% union at 12 months using an integrative matrix. High manufacturing costs limit uptake today but suit premium, complex reconstructions and strengthen differentiation across the dental bone graft substitutes market.
Restraints Impact Analysis*
| Restraint | (~) % Impact on CAGR Forecast | Geographic Relevance | Impact Timeline |
|---|---|---|---|
| High procedure & product cost vis-à-vis conventional dentures | -1.4% | Global, acute in emerging markets | Medium term (2-4 years) |
| Limited reimbursement in emerging markets | -1.1% | Asia-Pacific, Latin America, MEA | Long term (≥ 4 years) |
| Scarcity & logistics issues in human-donor tissue supply chains | -0.8% | Global | Short term (≤ 2 years) |
| Persistent ethical push-back against xenograft sourcing | -0.6% | Middle East, parts of Asia | Long term (≥ 4 years) |
| Source: Mordor Intelligence | |||
High Procedure & Product Cost Vis-à-Vis Conventional Dentures
Economic evaluations show retaining at-risk teeth is cheaper than replacing them with implants, especially once peri-implantitis maintenance is considered. Graft materials alone add USD 46.2–140 per case. Multiple visits and protracted healing magnify total spend, dampening uptake among cost-sensitive groups. Providers in the dental bone graft substitutes market mitigate sticker shock through bundled procedure pricing and in-house manufacturing that compresses overhead.
Limited Reimbursement in Emerging Markets
Coverage gaps leave patients self-funding advanced grafts despite widening middle-class incomes. Many payers lack specific codes for growth-factor matrices or 3-D printed grafts, forcing a two-tier system. Government insurance in Thailand or India often caps reimbursement at basic xenografts, leaving premium synthetics off-limits to average citizens. Private insurers either exclude dental procedures or set low annual maximums, curbing adoption even as the dental bone graft substitutes market grows on the premium end. Regional health-authority pilots aim to update codes, but progress lags technological innovation.
*Our forecasts treat driver/restraint impacts as directional, not additive. The impact forecasts reflect baseline growth, mix effects, and variable interactions.
Segment Analysis
By Product Type: Allografts Lead Despite Synthetic Surge
Allografts maintained a 55.10% share in 2025, driven by surgeon familiarity and extensive clinical evidence. However, the tuberculosis outbreak triggered stricter screening, nudging clinicians toward disease-free synthetics. Synthetic/alloplast innovations post a 9.78% CAGR, buoyed by coral-inspired designs and growth-factor additives that sidestep donor-tissue shortages. The dental bone graft substitutes market size for synthetic/alloplast products is slated to widen as 3-D printing streamlines custom shapes.
Autografts remain the biological benchmark yet suffer donor-site morbidity and limited volume. Xenografts serve niche complex reconstructions; segmented equine sheets achieved horizontal gains of 6.18 mm in 3-D defects. Emerging dentin-derived xenogeneic matrices extend indications by retaining organic components.


By Mechanism: Osteoconduction Dominance Challenged by Osteoinduction
Osteoconductive scaffolds accounted for 60.10% of the dental bone graft substitutes market in 2025. Reliability across socket preservation and ridge augmentation sustains volume. Osteoinductive products, led by recombinant growth-factor matrices, are tracking a 9.02% CAGR owing to superior defect fill: FGF-2 sponges produced 35.6% extra bone area in lab studies.
Hybrid constructs now merge osteoconduction, osteoinduction, and osteogenesis. An integrative matrix reached 100% spinal fusion at 12 months. As evidence accumulates, hospitals revise protocols, increasing the dental bone graft substitutes market share of multi-mechanism devices.
By Material: Ceramic Foundations Enable Growth-Factor Innovations
Ceramic matrices, chiefly hydroxyapatite and β-tricalcium phosphate, captured 43.30% share in 2025 thanks to predictable resorption. A β-TCP/calcium-sulfate mix resorbed 50% by week 12 and 85% by week 33. Growth factor-enhanced materials record an 10.74% CAGR as nano-controlled release prolongs biologic activity.
Collagen scaffolds accelerate vascularization; a hydroxyapatite/collagen composite matched autograft fusion in cervical surgeries. Polymer-ceramic hybrids tailor strength and degradation, while plant-derived apatites, validated for ethical compatibility, enter pilot use. These innovations enlarge the dental bone graft substitutes market size by tapping elective cosmetic cases.
By Application: Socket Preservation Dominates While Implant Regeneration Surges
Socket preservation held 32.40% share in 2025. Combining allograft and xenograft granules limited horizontal loss to 1.6 mm after 4 months. As global implant placement rises, implant bone regeneration exhibits a 12.05% CAGR. The dental bone graft substitutes market size for implant regeneration grows faster where peri-implant deficiencies demand tailored grafts.
Ridge augmentation benefits from customized titanium meshes printed via CAD/CAM, delivering predictable contour restoration. Sinus lifts rely on bioactive glass scaffolds for atrophic maxillae. Autologous tooth grafts demonstrated 100% 5-year implant success.
By End User: Hospital Dominance Shifts Toward Specialized Centers
Hospitals controlled 48.30% revenue in 2025 owing to infrastructure suited for multistage, comorbidity-laden cases. Yet specialized dental clinics advance at 9.28% CAGR as outpatient workflows lower cost and recovery time. Digital in-house 3-D printing empowers clinics to design grafts and guides within hours, supporting broader diffusion of the dental bone graft substitutes market.
Ambulatory surgical centers attract routine grafting with same-day discharge. Academic institutes pilot nano-release factors and biomimetic matrices, accelerating translation to commercial channels.
Geography Analysis
North America held 35.40% share in 2025, boosted by comprehensive reimbursement and early technology adoption. UnitedHealthcare’s 2024 policy clarified graft coverage, raising case volumes. The FDA’s 2024 breakthrough device awards to Renovos and CGBio signal continued innovation support. Nonetheless, the 2023 allograft-linked tuberculosis outbreak led to tighter donor screening, temporarily slowing allograft sales. These dynamics encourage synthetic uptake, reinforcing momentum for the dental bone graft substitutes market.
Asia-Pacific is the fastest-growing region at 11.05% CAGR on the back of enlarging medical tourism hubs and rising discretionary income. Thailand’s medical-device sector reached USD 7.2 billion in 2024, exemplifying supportive infrastructure. Super-aged profiles in Japan, South Korea, and Thailand elevate demand for implants and associated grafts. However, limited reimbursement hinders mass adoption, keeping price-sensitive segments reliant on lower-cost xenografts.
Europe maintains a mature yet innovation-friendly market. Rigorous CE-mark pathways favor companies with strong clinical dossiers, while public health systems emphasize ethical sourcing, fueling synthetic alternatives. Collaborative research networks expedite biomaterial breakthroughs that quickly reach German and Scandinavian clinics. Economic pressures temper expenditure growth but stable aging demographics ensure steady baseline demand for the dental bone graft substitutes market.

Competitive Landscape
The market is moderately fragmented. Geistlich Pharma’s Bio-Oss remains the world’s best-selling xenograft, backed by 30 years of clinical data. Straumann Group optimized its portfolio by divesting DrSmile in 2024 to concentrate on implants and regeneration, yet retained 20% equity to keep aligner exposure.
Regulatory strategy is an emerging differentiator. Amphix Bio, CGBio, and Renovos secured FDA breakthrough designations in 2024 for novel biomimetic gels and putties, accelerating U.S. entry. Coral-inspired synthetic developers focus on Middle-East markets where religious concerns amplify demand. 3-D printing specialists collaborate with OEM printer firms to bundle software, materials, and service, creating turnkey offerings.
Supply chain robustness shapes competitive standing. LifeNet Health launched OraGen in February 2024, a cryopreserved viable allograft blending corticocancellous bone with demineralized matrix, targeting hospitals that require live-cell performance. Synthetic entrants highlight predictable sourcing and sterility advantages, capturing share amid donor-tissue scrutiny.
Dental Bone Graft Substitutes Industry Leaders
Johnson & Johnson
Institut Straumann AG
Medtronic PLC
Dentsply Sirona
ZimVie Inc
- *Disclaimer: Major Players sorted in no particular order

Recent Industry Developments
- February 2025: LifeNet Health launched OraGen, the first viable dental bone allograft featuring live bone cells and demineralized matrix.
- August 2025: Straumann Group sold its DrSmile direct-to-consumer aligner unit to Impress Group while retaining a 20% stake.


Research Methodology Framework and Report Scope
Market Definitions and Key Coverage
Our study, according to Mordor Intelligence, views the dental bone graft substitutes market as the total sales value of biologic or synthetic materials, autografts, allografts, xenografts, and alloplasts, implanted to restore alveolar bone before or during oral and maxillofacial procedures. Use cases span socket preservation, ridge augmentation, sinus lift, periodontal defect repair, and implant site regeneration.
Scope Exclusion: Orthopedic bone void fillers and cranio-maxillofacial grafts that are not performed by dental professionals remain outside this analysis.
Segmentation Overview
- By Product Type
- Autograft
- Allograft
- Xenograft
- Synthetic/Alloplast
- Other Types
- By Mechanism
- Osteoconduction
- Osteoinduction
- Osteogenesis
- Osteopromotion
- By Material
- Ceramic-based
- Collagen-based
- Growth-factor-enhanced
- Polymer & Composite
- By Application
- Socket Preservation
- Ridge Augmentation
- Sinus Lift
- Periodontal Defect Regeneration
- Implant Bone Regeneration
- By End User
- Hospitals
- Dental Clinics & Implant Centers
- Ambulatory Surgical Centers
- Academic & Research Institutes
- Geography
- North America
- United States
- Canada
- Mexico
- Europe
- Germany
- United Kingdom
- France
- Italy
- Spain
- Rest of Europe
- Asia-Pacific
- China
- Japan
- India
- South Korea
- Australia
- Rest of Asia-Pacific
- Middle East and Africa
- GCC
- South Africa
- Rest of Middle East and Africa
- South America
- Brazil
- Argentina
- Rest of South America
- North America
Detailed Research Methodology and Data Validation
Primary Research
Mordor analysts then interviewed oral surgeons, periodontists, and procurement managers across North America, Europe, and high-growth Asian economies. Their insights validated graft material mix shifts, discounting patterns, and typical grams per procedure, helping us refine regional penetration assumptions and future growth triggers.
Desk Research
We began by mapping publicly available benchmarks, population aging curves from UN DESA, periodontal disease prevalence tables from the WHO Global Oral Health Data Bank, and jaw bone defect incidence data published by the American Dental Association. Trade statistics from UN Comtrade and import duty registers helped us size cross-border flows of bovine xenograft granules, while reimbursement bulletins from CMS and NICE clarified covered indications. Company 10-Ks, D&B Hoovers revenue splits, and patent trends retrieved through Questel highlighted competitive intensity and average selling prices. This list is illustrative; numerous other open and subscription sources fed our desk work.
Market-Sizing & Forecasting
We anchored 2025 demand through a top-down procedure volume reconstruction. Edentulous and partially edentulous cohorts were multiplied by implant adoption ratios and graft usage propensities, which are then cross-checked with shipment data and sampled ASP times volume roll-ups from supplier financials. Key variables like implant penetration, average bone loss severity, xenograft price deflation, insurer coverage breadth, and chairside CAD/CAM uptake drive the model. A multivariate regression against periodontal burden and disposable income trends projects 2026-2030 volumes; exponential smoothing guides short-term ASP forecasts. Where bottom-up supplier tallies diverged, gaps were prorated using regional procedure shares before final consolidation.
Data Validation & Update Cycle
Outputs pass variance checks against historical growth corridors, peer data, and in-house time series dashboards. Senior reviewers interrogate anomalies, and analysts re-contact experts if deviations exceed control limits. Models refresh yearly, with interim updates triggered by material regulatory or pricing events; a last-minute sweep ensures clients receive the newest baseline.
Why Our Dental Bone Graft Substitutes Baseline Commands Reliability
Published figures differ because firms vary scope, assume distinct material mixes, and refresh at unequal cadences. By restricting coverage to dentist-led grafting, aligning currencies to constant 2025 USD, and revisiting inputs each year, we minimize noise and present a balanced view.
Benchmark comparison
| Market Size | Anonymized source | Primary gap driver |
|---|---|---|
| USD 0.87 B (2025) | Mordor Intelligence | - |
| USD 1.31 B (2025) | Global Consultancy A | Includes ENT and orthopedic use; applies single inflation factor to 2020 data |
| USD 0.33 B (2025) | Regional Consultancy B | Relies mainly on distributor surveys from three countries; omits synthetic alloplasts |
| USD 0.62 B (2024) | Industry Journal C | Uses list prices without volume-weighted discount; forecast frozen since 2023 |
These contrasts show that when scope, price realization, and refresh rigor shift, totals swing widely. Our disciplined variable tracking and annual recalibration therefore give decision-makers a dependable, transparent baseline.


Key Questions Answered in the Report
What is the current value of the dental bone graft & substitutes market?
The market is valued at USD 0.93 billion in 2026 and is projected to hit USD 1.32 billion by 2031 at a 7.25% CAGR.
Which product segment is growing fastest?
Synthetic/alloplast materials are expanding at a 9.78% CAGR through 2031 as clinicians adopt coral-inspired and bioactive glass grafts.
Why are synthetic grafts gaining popularity?
They eliminate disease-transmission risk, satisfy religious-ethical concerns, and increasingly match or surpass allograft performance in bone regeneration timelines.
Which region will see the quickest market growth?
Asia-Pacific leads with an 11.05% CAGR, driven by medical-tourism hubs and aging populations seeking implant-based restorations.
How are CAD/CAM and 3-D printing influencing the market?
Digital workflows allow patient-specific grafts and titanium meshes, reducing operative time and revision rates while commanding premium procedure fees.
Page last updated on:


