Vascular Graft Market Size and Share
Market Overview
| Study Period | 2020 - 2031 |
|---|---|
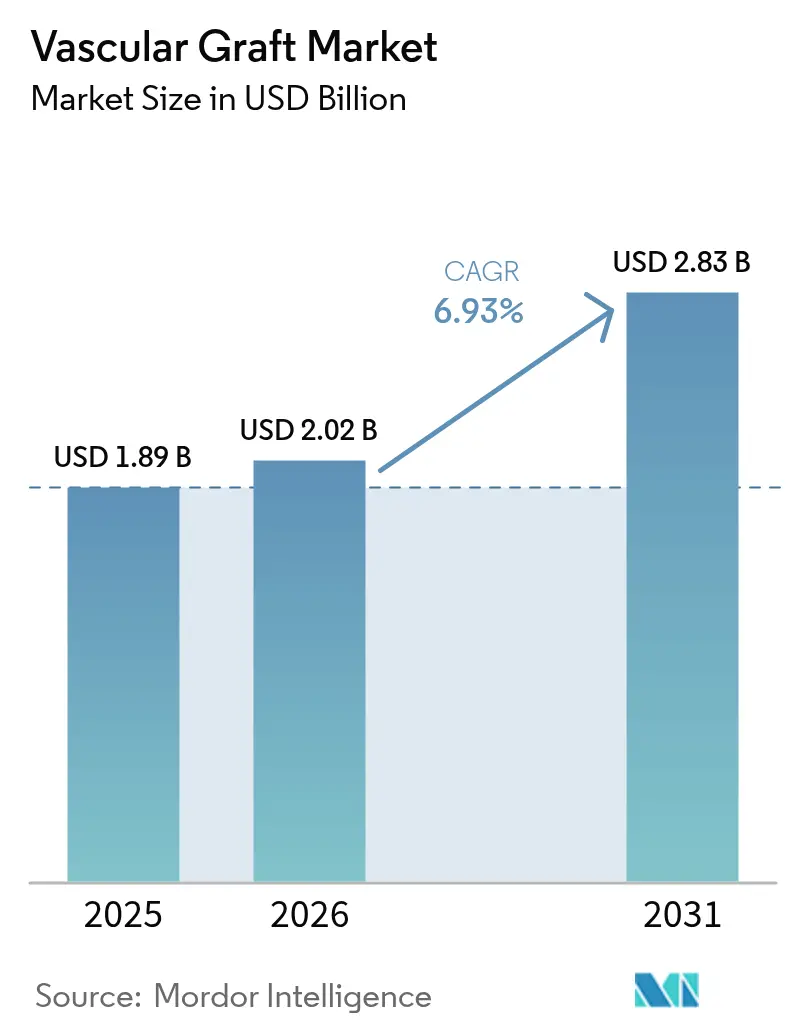
| Market Size (2026) | USD 2.02 Billion |
| Market Size (2031) | USD 2.83 Billion |
| Growth Rate (2026 - 2031) | 6.93% CAGR |
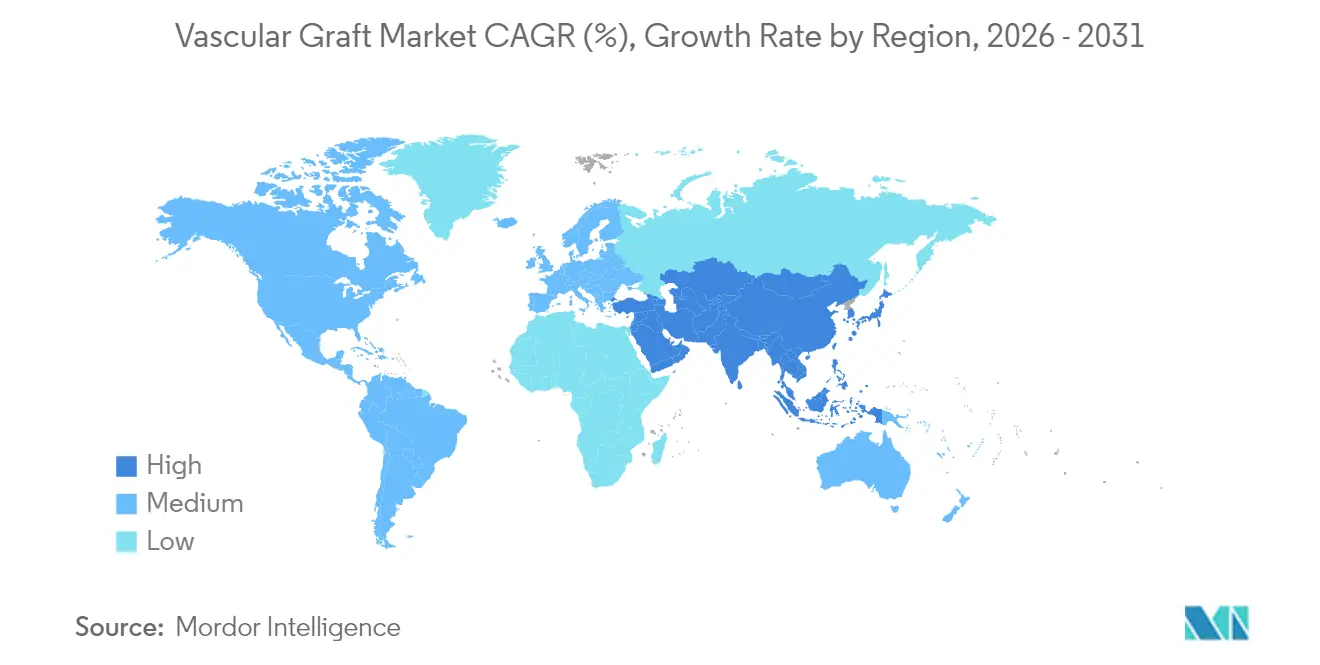
| Fastest Growing Market | Asia-Pacific |
| Largest Market | North America |
| Market Concentration | Medium |
Major Players *Disclaimer: Major Players sorted in no particular order Image © Mordor Intelligence. Reuse requires attribution under CC BY 4.0. | |
Vascular Graft Market Analysis by Mordor Intelligence
The vascular graft market size was valued at USD 1.89 billion in 2025 and estimated to grow from USD 2.02 billion in 2026 to reach USD 2.83 billion by 2031, at a CAGR of 6.93% during the forecast period (2026-2031). This expansion reflects the synchronized influence of rising cardiovascular disease prevalence, the routine adoption of minimally invasive repair, and rapid material innovation, which keeps synthetic and biological grafts central to contemporary vascular care. Endovascular stent grafts continue to drive overall revenue growth, thanks to their short hospital stays and broad anatomical applicability. However, the growing acceptance of patient-specific 3D-printed bioresorbable grafts signals a shift toward personalized reconstruction and fewer long-term foreign-body concerns. Manufacturers leverage polymer chemistry breakthroughs, surface engineering, and embedded sensor concepts to extend patency, curb infection, and supply real-time performance data. Regionally, high procedure volumes in North America sustain the region's global leadership, but the Asia-Pacific's investment in cardiovascular infrastructure and local production capacity is reshaping competitive dynamics. Momentum is reinforced as regulators approve data-driven medical devices that supplement graft therapy with algorithmic patient selection and post-implant monitoring, further embedding graft technology within intelligent cardiovascular care pathways.
Key Report Takeaways
- By product type, endovascular stent grafts led with a 53.60% revenue share in 2025, while 3D-printed bioresorbable grafts are projected to expand at a 7.58% CAGR through 2031, underscoring the duality of volume leadership and innovation-driven growth.
- By material, ePTFE held 46.65% of the vascular graft market share in 2025. Biosynthetic materials are expected to grow at an 7.92% CAGR through 2031, as clinicians favor grafts that integrate with native tissue.
- By application, aortic and peripheral aneurysm repair accounted for a 61.55% share of the vascular graft market size in 2025. In contrast, hemodialysis access is projected to advance at an 8.21% CAGR through 2031, reflecting the divergent needs of high-volume and high-growth segments.
- By end user, hospitals and surgical centers captured 68.85% revenue share in 2025, while ambulatory surgical centers are set to increase at an 8.24% CAGR between 2026 and 2031 as outpatient vascular care expands.
- By geography, North America commanded a 38.70% share of the vascular graft market in 2025; however, the Asia-Pacific region is poised to accelerate at a 9.12% CAGR from 2025 to 2031, driven by demographic and economic tailwinds.
Note: Market size and forecast figures in this report are generated using Mordor Intelligence’s proprietary estimation framework, updated with the latest available data and insights as of 2026.
Global Vascular Graft Market Trends and Insights
Driver Impact Analysis*
| Driver | (~) % Impact on CAGR Forecast | Geographic Relevance | Impact Timeline |
|---|---|---|---|
| Rising prevalence of cardiovascular diseases | +1.80% | Global, with highest impact in aging populations of North America and Europe | Long term (≥ 4 years) |
| Growing number of minimally-invasive endovascular interventions | +1.40% | Global, led by developed markets with advanced surgical infrastructure | Medium term (2-4 years) |
| Technological advances in synthetic graft materials | +1.20% | North America and Europe for R&D, Asia-Pacific for manufacturing scale | Medium term (2-4 years) |
| Expanding adoption of off-the-shelf endovascular stent-grafts | +0.90% | Global, with rapid uptake in emerging markets with limited surgical expertise | Short term (≤ 2 years) |
| Surge in clinical trials for cell-seeded bio-engineered grafts | +0.80% | North America and Europe, with selective trials in Asia-Pacific | Long term (≥ 4 years) |
| Emergence of 3-D-printed patient-specific vascular conduits | +0.70% | North America and Europe initially, expanding to Asia-Pacific manufacturing hubs | Medium term (2-4 years) |
| Source: Mordor Intelligence | |||
Rising Prevalence of Cardiovascular Diseases
Escalating cardiovascular morbidity sustains steady procedure volumes despite plateauing growth in some mature markets. Earlier onset linked to diabetes and chronic renal disease has increased the proportion of complex, multi-vessel presentations that often require hybrid combinations of graft types. Surgeons weigh lifetime patency more heavily than initial implant cost, steering demand toward biosynthetic or drug-eluting constructs that resist thrombosis and infection. As these high-risk subpopulations expand, the vascular graft market maintains momentum even when overall surgical rates stabilize. This demographic pressure supports long-term capacity planning and encourages R&D partnerships aimed at next-generation polymer blends and endothelial-mimicking surfaces.
Growing Number of Minimally-Invasive Endovascular Interventions
Advances in imaging, delivery system flexibility, and simulation training have shortened the learning curve for percutaneous repairs, unlocking anatomies that were once limited to open surgery. Hospitals favor these approaches because shorter admissions lower the cost per case, while patients benefit from quicker recovery and same-day discharge in many peripheral procedures. Robust survival data from pulmonary embolism thrombectomy further validate safety, reinforcing payer confidence and widening clinical indications[1]Source: James M. Horowitz, “Mechanical Thrombectomy for High-Risk Pulmonary Embolism: Insights From the FLASH Registry,” Journal of the Society of Cardiovascular Angiography and Interventions,. As ambulatory settings increasingly undertake more complex vascular procedures, device manufacturers are focusing on grafts that can be delivered through smaller sheaths without compromising radial strength, thereby fueling additional adoption.
Technological Advances in Synthetic Graft Materials
Polymer scientists now tailor degradation rates to match tissue-healing kinetics, enabling bioresorbable scaffolds that disappear once remodeling is complete. Surface coatings loaded with antimicrobials or anticoagulants address historic failure modes, while nanofiber layers improve endothelialization. Embedded microsensors that report flow or pressure changes show promise for proactive complication management, although regulatory frameworks for such smart grafts are still being developed. Production via 3D printing and electrospinning allows patient-specific geometry, an advantage in pediatric and tortuous anatomies. Together, these innovations set the stage for differentiated value propositions beyond commodity graft supply.
Expanding Adoption of Off-the-Shelf Endovascular Stent-Grafts
Standardized sizing matrices enable hospitals to stock a limited set of SKUs while covering most emergency and elective anatomies, thereby reducing inventory overhead and enhancing trauma response times. Clinical data generated by early entrants raise approval hurdles for latecomers, concentrating share among vendors that already hold post-market surveillance portfolios. As supply-chain resilience becomes a procurement priority, manufacturers with global warehousing and just-in-time restocking gain preference. The trade-off is that fully customizable grafts may experience slower uptake when off-the-shelf options suffice, prompting innovators to demonstrate superior clinical and economic outcomes.
Restraint Impact Analysis*
| Restraint | (~) % Impact on CAGR Forecast | Geographic Relevance | Impact Timeline |
|---|---|---|---|
| High average selling price of next-generation grafts | -1.10% | Global, with highest impact in price-sensitive emerging markets | Medium term (2-4 years) |
| Post-implant infection & graft thrombosis risk | -0.80% | Global, with regional variations in infection control protocols | Long term (≥ 4 years) |
| Procurement bottlenecks for biological/allograft tissue | -0.60% | North America and Europe primarily, limited impact in Asia-Pacific | Short term (≤ 2 years) |
| Stringent long-term patency evidence required by payers | -0.50% | North America and Europe with mature reimbursement systems | Long term (≥ 4 years) |
| Source: Mordor Intelligence | |||
High Average Selling Price of Next-Generation Grafts
Premium price points challenge payers that have not yet embedded long-term patency benefits into reimbursement algorithms. Large health-system purchasing alliances negotiate aggressively, eroding early profit margins and extending the time required to recoup R&D investments. In elective procedures, cost-effectiveness thresholds often favor established devices unless randomized evidence shows clear superiority, delaying widespread substitution. Emergency settings tolerate higher prices, but these account for a minority of total graft volume. Consequently, producers must balance margin expectations with tiered portfolios that serve both value-oriented and performance-driven segments.
Post-Implant Infection & Graft Thrombosis Risk
Although the absolute incidence of infection is low, the consequences can be catastrophic, prompting conservative graft selection in multimorbid patients. Rising antimicrobial resistance heightens concern, particularly in regions where stewardship programs lag. Hemodialysis conduits remain a particular pain point; recent studies record early hemorrhage and thrombosis incidences of 32.3% and 30.8% respectively, in dialysis patients, underscoring the need for surface improvements. Vigilance over these complications imposes additional device evaluation and surveillance costs, tempering enthusiasm for unproven materials
*Our forecasts treat driver/restraint impacts as directional, not additive. The impact forecasts reflect baseline growth, mix effects, and variable interactions.
Segment Analysis
By Product Type: Endovascular Dominance Meets Bioengineering Innovation
Endovascular stent grafts accounted for the largest share of the vascular graft market, reaching USD 1.01 billion in 2025, driven by entrenched procedural familiarity and broad insurance coverage. Their platform advantage is reinforced by continuing design refinements that improve seal integrity in complex aortic arches. Nonetheless, 3D-printed bioresorbable grafts, although representing a smaller revenue base, present the most substantial upside, as they address pediatric and small-caliber niches where lifelong implant avoidance is desirable. The vascular graft market continues to balance high-volume, standardized devices with bespoke solutions that leverage the efficiencies of additive manufacturing.
Growing clinical evidence for bio-resorbable constructs draws regulatory momentum, but stringent long-term data requirements slow wide release. Peripheral vascular grafts sustain mid-single-digit growth thanks to rising diabetes prevalence, while coronary artery bypass grafts witness subdued demand as percutaneous interventions encroach on surgical indications. Hemodialysis access devices benefit from the escalating prevalence of end-stage renal disease and command premium pricing due to the high cost of access failure. Manufacturers prioritize modular delivery systems that allow intraoperative length adjustment, reducing inventory redundancy and simplifying supply logistics across diverse care settings.


By Material: ePTFE Leadership Challenged by Biosynthetic Innovation
ePTFE continues to dominate revenues, contributing almost half of the vascular graft market share in 2025 due to its predictable handling characteristics and established clinical data. Polyester (Dacron) remains the go-to material for large-diameter aortic repairs due to its woven architecture and burst-pressure resilience. Yet biosynthetic hybrids, advancing at 7.92% CAGR, increasingly converge structural strength with biologic integration, capturing surgeon interest where long-term patency is crucial.
Cost considerations currently favor legacy materials, but hospital value-analysis teams are receptive to infection-resistant coatings and bio-integrative surfaces when downstream savings are demonstrable. Polyurethane-based options hold a niche role in mobile anatomical territories where flex-fatigue failure threatens rigid polymers. Regulatory pathways reward incremental improvements on familiar substrates, so innovators often layer antimicrobial or antiproliferative features onto ePTFE backbones to expedite clearance. As outcome data accumulate, hospitals may recalibrate cost–benefit analyses, unlocking broader substitution of biosynthetic options in routine indications.
By Application: Aneurysm Repair Drives Volume While Dialysis Access Accelerates
Aortic and peripheral aneurysm repair accounted for 61.55% of demand in 2025, underscoring the centrality of grafts in addressing life-threatening large-vessel pathology. Procedure counts rise steadily as screening programs for abdominal aortic aneurysms gain traction and device profiles allow treatment of ever more challenging anatomies. In contrast, hemodialysis access applications, although representing a smaller portion of the absolute spend, experience the fastest expansion at an 8.21% CAGR, as the escalating prevalence of chronic kidney disease multiplies access revisions over a patient’s lifetime.
Peripheral vascular disease interventions experience a moderate uplift as smoking and metabolic syndrome persist. At the same time, coronary artery bypass surgery wrestles with substitution by drug-eluting stents except in triple-vessel or diabetic cases. Clinical practice increasingly favors hybrid approaches blending surgical and endovascular techniques, compelling device makers to ensure cross-compatibility among graft categories. The economic burdens of graft failure differ sharply by indication, making premium pricing most defensible in dialysis conduits and high-risk aortic repairs, where revision carries significant morbidity and cost.

By End User: Hospital Concentration Faces ASC Disruption
Hospitals and integrated surgical centers maintained a 68.85% revenue share in 2025, while ambulatory surgical centers (ASCs) are expanding their procedural scope as anesthesia protocols and imaging platforms make same-day discharge viable for many peripheral and dialysis interventions. The vascular graft market size for ASCs is expected to climb steadily alongside payer incentives that favor lower-cost outpatient venues.
Physician-owned vascular clinics run high-throughput models that reward devices offering quick deployment and low complication rates, nudging suppliers to streamline packaging and support services. Hospitals, meanwhile, continue to handle complex aortic and multivessel surgeries, sustaining demand for large-diameter polyester grafts and branched stent systems. Group purchasing organizations inside large health systems rationalize vendor lists, pressuring manufacturers to furnish outcome evidence and total-cost-of-care analytics.
Geography Analysis
North America held a 38.70% stake in the vascular graft market in 2025, driven by widespread reimbursement, established clinical pathways, and a sizable aging population. Academic centers nurture first-in-human trials, creating a robust pipeline of innovation that migrates rapidly into community hospitals. Large integrated delivery networks negotiate bulk procurement but reward vendors that can support enterprise-wide standardization and data capture initiatives. As a result, graft makers couple product supply with analytics dashboards that track failure trends and readmission costs.
The Asia-Pacific region is the fastest-growing territory, with a 9.12% CAGR projected to 2031. Policymakers focus on cardiovascular disease as an economic and social priority, unlocking funding for catheterization labs, hybrid operating theaters, and surgeon training. Domestic manufacturers leverage proximity to lower-cost supply chains, while multinationals establish regional production facilities to sidestep import tariffs and expedite regulatory approval. Cultural attitudes toward xenografts influence material selection, creating micro-segment opportunities across sub-regions. Urban–rural disparity prompts tiered product strategies: high-spec grafts for tertiary centers and cost-sensitive lines for district hospitals.
Europe registers steady low-single-digit growth guided by value-based procurement and stringent evidence demands. The vascular graft market here prioritizes long-term outcome publications, prompting suppliers to sponsor post-authorization studies that meet the requirements of national health-technology assessment bodies. Currency volatility tied to macro-economic shifts shapes inventory hedging policies, particularly for UK-based distributors navigating post-Brexit trade procedures. Latin American markets progress unevenly; pockets such as Brazil and Colombia invest in endovascular infrastructure, yet funding cycles and currency fluctuations delay device approvals. The Middle East and Africa remain small but strategically important, with select Gulf states commissioning cardiovascular centers of excellence that specialize in premium grafts and attract medical tourists.
Mordor Intelligence provides coverage of the vascular graft market across other key regional markets, including North America, each with their regulatory frameworks and demand patterns.

Competitive Landscape
The vascular graft market exhibits moderate fragmentation, with a small cadre of diversified multinationals coexisting alongside numerous material specialists and regional producers. Top-tier firms, such as Medtronic, Boston Scientific, Terumo, and W. L. Gore, leverage global distribution, broad portfolios, and substantial clinical evidence budgets. Mid-tier challengers focus on biosynthetic and sensor-enabled grafts, pairing device R&D with software algorithms now recognized by regulators. By March 2025, the United States Food and Drug Administration had cleared 1,016 AI/ML-enabled medical devices, opening up new performance-monitoring opportunities [2]Source: U.S. Food and Drug Administration, “Artificial Intelligence and Machine Learning (AI/ML)-Enabled Medical Devices,” fda.gov.
Strategic collaborations between device vendors and hospital networks create value-based procurement models where graft cost ties directly to patency guarantees. Vertical integration into textile extrusion and polymer compounding ensures control over critical inputs, insulating leading producers from supply chain disruptions and quality fluctuations. On the innovation front, tissue-engineering firms pursue living grafts seeded with autologous cells, while additive-manufacturing start-ups print patient-specific scaffolds for rare or pediatric anatomies. Regulatory burdens surrounding sterility and durability hinder these newcomers, allowing incumbents time to develop hybrid offerings that combine established materials with incremental bioactive layers.
Market entry barriers differ by segment: endovascular stent grafts require capital-intensive clinical trials and complex delivery hardware, whereas peripheral or dialysis conduits face lower regulatory thresholds but encounter fierce price competition. Consequently, some specialists relinquish direct sales to larger partners post-clearance in exchange for manufacturing royalties. Price erosion in legacy lines accelerates consolidation, yet white-space opportunities remain in infection-resistant coatings, automated surveillance platforms, and grafts tuned for low-resource settings.
Vascular Graft Industry Leaders
Abbott Laboratories
Cook Medical
W.L. Gore & Associates Inc
LeMaitre Vascular Inc
Terumo Medical Corporation
- *Disclaimer: Major Players sorted in no particular order


Recent Industry Developments
- March 2025: The United States FDA authorized 1,016 AI/ML-enabled medical devices, paving the way for intelligent graft-monitoring systems and algorithmic patient selection that could influence material design and clinical workflow.
- August 2024: Cresilon’s plant-based hemostatic agent, Traumagel, has obtained 510(k) clearance, promising improved hemorrhage control during vascular graft implantation.


Research Methodology Framework and Report Scope
Market Definitions and Key Coverage
Our study defines the vascular graft market as the global sales value of synthetic, biological, and hybrid conduits implanted to reroute or replace diseased blood vessels in open or endovascular procedures. The value pool captures grafts used in aortic and peripheral aneurysm repair, peripheral vascular disease, coronary artery bypass, and hemodialysis access across all care settings in 17 major and minor geographies.
Scope exclusion: temporary catheters, vascular patches, and closure devices are left outside the present calculation.
Segmentation Overview
- By Product Type
- Endovascular Stent Grafts
- Peripheral Vascular Grafts
- Hemodialysis Access Grafts
- Coronary Artery Bypass Grafts
- Others
- By Material
- ePTFE
- Polyester (Dacron)
- Polyurethane
- Biosynthetic (PET/Collagen etc.)
- Biological (Allograft, Xenograft)
- By Application
- Aortic & Peripheral Aneurysm Repair
- Peripheral Vascular Disease
- Hemodialysis Access
- Coronary Artery Bypass Surgery
- By End User
- Hospitals & Surgical Centers
- Ambulatory Surgical Centers
- Specialty Vascular Clinics
- By Geography
- North America
- United States
- Canada
- Mexico
- Europe
- Germany
- United Kingdom
- France
- Italy
- Spain
- Rest of Europe
- Asia-Pacific
- China
- Japan
- India
- South Korea
- Australia
- Rest of Asia-Pacific
- South America
- Brazil
- Argentina
- Rest of South America
- Middle East and Africa
- GCC
- South Africa
- Rest of Middle East and Africa
- North America
Detailed Research Methodology and Data Validation
Primary Research
Mordor analysts interviewed vascular surgeons, interventional radiologists, hospital supply managers, and material science experts across North America, Europe, and Asia-Pacific. These discussions validated prevalence assumptions, typical graft mix by indication, and post-pandemic procurement shifts, allowing us to reconcile desk findings with frontline realities before final triangulation.
Desk Research
We begin with publicly available, high-integrity statistics such as WHO cardiovascular mortality dashboards, CDC National Center for Health Statistics, United States Renal Data System dialysis census, OECD Health Data, Eurostat surgical discharge files, and trade association briefs from bodies such as the Society for Vascular Surgery and the European Society of Cardiology. Company 10-Ks, device pre-market approval dossiers, customs shipment panels, and press releases enrich unit flow and average selling price signals. Where deeper financials are required, our team accesses D&B Hoovers and Dow Jones Factiva. The sources listed illustrate the breadth of material; many more were reviewed during data gathering and sense-checking.
Market-Sizing & Forecasting
A top-down prevalence-to-procedure build first scales target candidate pools (aneurysm cases, dialysis cohort, CABG volumes) and then applies procedure penetration and graft utilization ratios. Select bottom-up roll-ups of leading supplier revenues and sampled ASP × unit checks test and tune the totals. Key model drivers include annual abdominal aortic aneurysm incidence, CKD Stage V population growth, elective cardiac surgery backlog clearance rates, inflation-adjusted stent-graft ASPs, and regional reimbursement shifts. Multivariate regression on these variables, supplemented by scenario analysis for technology adoption, generates the 2025-2030 forecast curve.
Data Validation & Update Cycle
Each draft model passes two analyst reviews, variance scans against independent hospital billing benchmarks, and outlier flagging. We refresh every twelve months, with mid-cycle updates if regulatory recalls, disruptive approvals, or currency swings above five percent occur. Before release, an analyst conducts a last-mile news sweep so clients receive the most current outlook.
Why Our Vascular Grafts Baseline Commands Reliability
Published market values often diverge because firms choose different product baskets, price anchors, and refresh cadences. Our disciplined scoping and dual-track modeling curb these gaps.
Benchmark comparison
| Market Size | Anonymized source | Primary gap driver |
|---|---|---|
| USD 1.89 B (2025) | Mordor Intelligence | - |
| USD 5.98 B (2024) | Global Consultancy A | Includes peripheral vascular devices and tissue patches; employs list-price ASPs |
| USD 3.60 B (2024) | Trade Journal B | Adds OEM contract manufacturing revenue and hybrid accessory kits |
| USD 1.70 B (2023) | Industry Research House C | Excludes bio-resorbable grafts and uses an older base year |
The comparison shows that scope breadth, ASP treatment, and base-year choice largely explain numeric spread. By selecting clinically accepted graft categories, blending transaction ASPs, and updating annually, Mordor Intelligence delivers a balanced, transparent baseline that decision-makers can replicate and stress-test with modest effort.


Key Questions Answered in the Report
What is the current size of the vascular graft market?
The vascular graft market size is USD 2.02 billion in 2026 and is projected to reach USD 2.83 billion by 2031.
Which product segment dominates revenue?
Endovascular stent grafts lead the vascular graft market with 53.60% revenue share in 2025, supported by broad procedural use and minimally-invasive delivery.
Which application is expanding fastest?
Hemodialysis access grafts post the quickest growth, advancing at an 8.21% CAGR through 2031 thanks to rising chronic kidney disease prevalence.
Why are 3D-printed bio-resorbable grafts gaining attention?
They dissolve once healing concludes, reducing lifelong foreign-body risk, and are forecast to grow at a 7.58% CAGR to 2031 due to personalization advantages.
Which region offers the greatest growth potential?
Asia-Pacific is the fastest-growing region with a 9.12% CAGR as healthcare infrastructure investment meets rising cardiovascular disease burden.
Page last updated on:


