
Bone Growth Stimulator Market Size and Share
Market Overview
| Study Period | 2020 - 2031 |
|---|---|
| Market Size (2026) | USD 1.44 Billion |
| Market Size (2031) | USD 1.86 Billion |
| Growth Rate (2026 - 2031) | 5.19 % |
| Fastest Growing Market | Asia Pacific |
| Largest Market | North America |
| Market Concentration | Medium |
Major Players
*Disclaimer: Major Players sorted in no particular order Image © Mordor Intelligence. Reuse requires attribution under CC BY 4.0. |
|
Bone Growth Stimulator Market Analysis by Mordor Intelligence
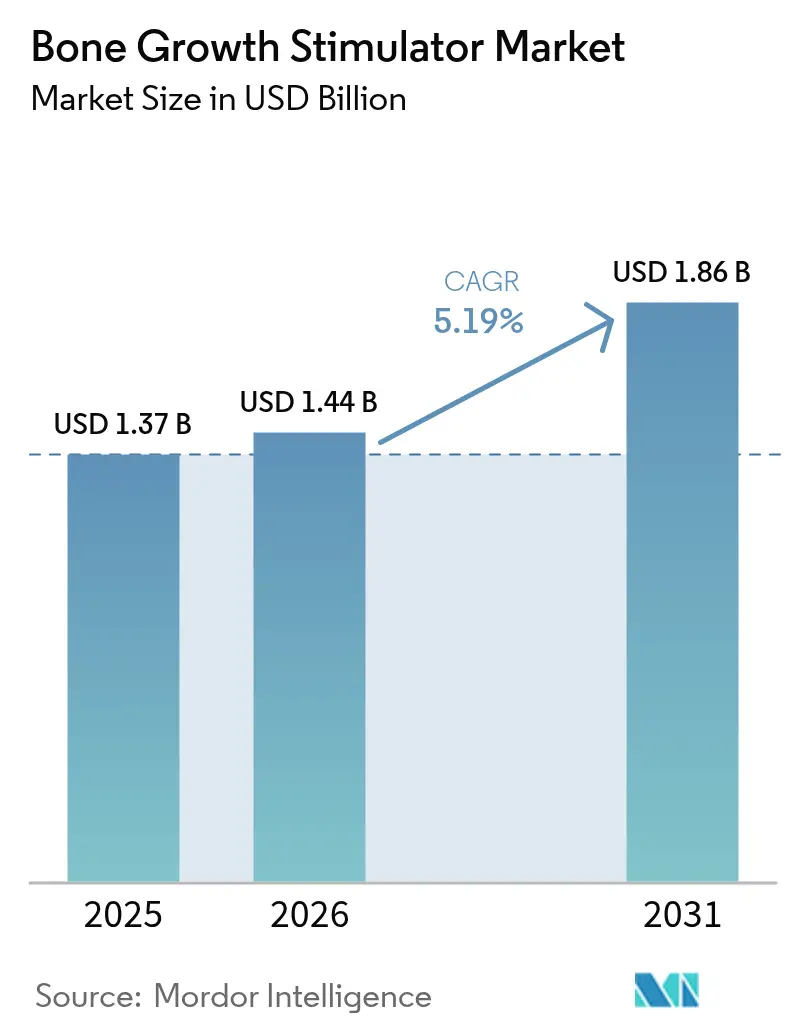
Bone growth stimulator market size in 2026 is estimated at USD 1.44 billion, growing from 2025 value of USD 1.37 billion with 2031 projections showing USD 1.86 billion, growing at 5.19% CAGR over 2026-2031. Demand expansion is rooted in the steady rise of musculoskeletal disorders, longer life expectancy, and higher obesity prevalence, all of which increase the clinical need for accelerated fracture healing therapies. Technology is moving beyond stand-alone external stimulators into smart, sensor-rich implants that transmit healing data in real time and into biologically active agents that complement mechanical stimulation. Payer policy in the United States is moving from broad coverage to prior-authorization triage, signaling both market maturity and a call for stronger evidence packages. Similar scrutiny is starting in Europe, while large emerging economies are rolling out fast-track approvals for innovative devices to expand domestic access. These shifts collectively build a supportive environment for device makers that can supply robust clinical data and cost-of-care arguments.
Key Report Takeaways
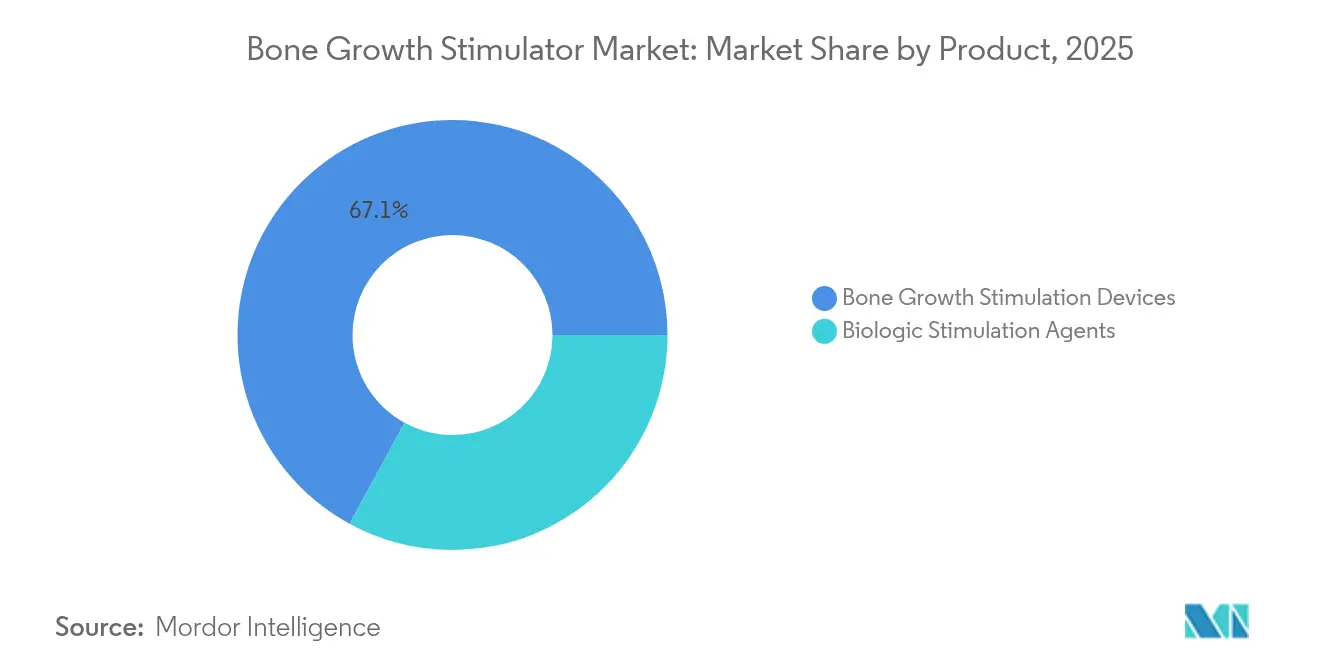
- By product, bone growth stimulation devices led with 67.05% of bone growth stimulator market share in 2025, while biologic stimulation agents are projected to expand at a 5.96% CAGR through 2031.
- By application, spinal fusion surgeries accounted for 56.92% of demand in 2025; oral and maxillofacial procedures are advancing at a 6.05% CAGR to 2031.
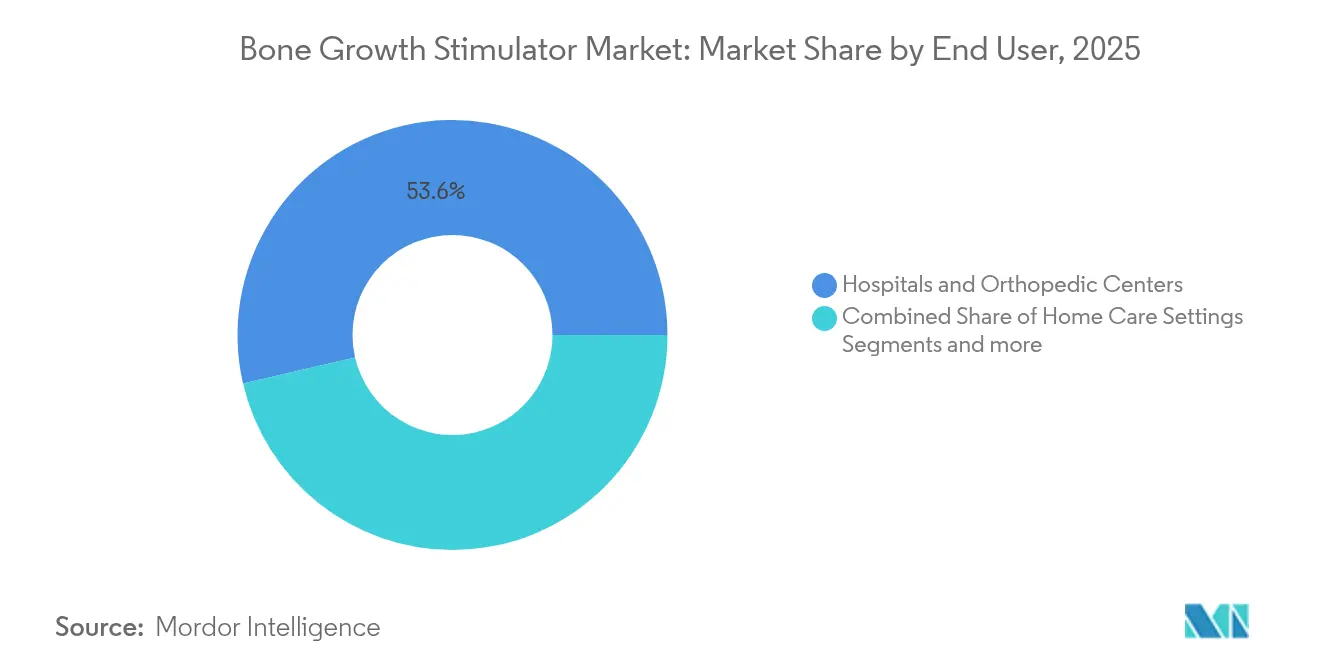
- By end user, hospitals and orthopedic centers held 53.62% of the bone growth stimulator market size in 2025, whereas home-care use is forecast to grow at a 5.88% CAGR through 2031.
- By geography, North America dominated with 44.05% revenue share in 2025; Asia-Pacific is poised to accelerate at a 6.18% CAGR toward 2031.
Note: Market size and forecast figures in this report are generated using Mordor Intelligence’s proprietary estimation framework, updated with the latest available data and insights as of 2026.
Global Bone Growth Stimulator Market Trends and Insights
Drivers Impact Analysis*
| Driver | (~) % Impact on CAGR Forecast | Geographic Relevance | Impact Timeline |
|---|---|---|---|
| Rising prevalence of musculoskeletal disorders | +1.2% | Global, highest impact in North America and Europe | Long term (≥ 4 years) |
| Growing preference for non/minimally-invasive orthopedic interventions | +0.9% | North America & EU, expanding to APAC | Medium term (2-4 years) |
| Increasing geriatric & obese population with delayed bone healing | +1.1% | Global, particularly developed markets | Long term (≥ 4 years) |
| Expansion of reimbursed spinal-fusion indications | +0.7% | North America, selective EU markets | Medium term (2-4 years) |
| Wearable, app-linked stimulators enabling remote compliance monitoring | +0.8% | North America & EU, early adoption in urban APAC | Short term (≤ 2 years) |
| Military & elite-sports funding for accelerated recovery technologies | +0.4% | North America, selective global military partnerships | Medium term (2-4 years) |
| Source: Mordor Intelligence | |||
Rising Prevalence of Musculoskeletal Disorders
Non-union fractures still occur in as many as 10% of all long-bone breaks, keeping clinical demand for non-surgical healing adjuncts high [1]Marcel G. Brown, "Stem Cells and Acellular Preparations in Bone Regeneration/Fracture Healing: Current Therapies and Future Directions," MDPI, mdpi.com. Clinical literature shows that mesenchymal stem cell therapy combined with electromagnetic stimulation yields healing rates above 90% at nine months, outpacing conventional fixation approaches. Pulsed electromagnetic field devices deliver 73-91% consolidation in difficult fractures, which translates into fewer revision surgeries and shorter rehabilitation courses. These outcomes reinforce hospital protocols and payer coverage rationales, further enlarging the bone growth stimulator market.
Growing Preference for Non/Minimally-Invasive Orthopedic Interventions
Capacitively coupled and combined magnetic field stimulators avoid surgical implantation and thereby reduce perioperative risks. FDA approval of a low-energy spine fusion stimulator in 2024 exemplifies this shift and demonstrated 79% fusion success versus 61% for placebo in a randomized study [2]Food and Drug Administration, “Xstim Spine Fusion Stimulator,” fda.gov . Insurers such as Cigna now reimburse specific protocols for high-risk fractures, which encourages outpatient centers to adopt the technology and lifts patient acceptance. The trend supports the development of wearable systems that sync with clinician dashboards for adherence monitoring—a capability that further widens the bone growth stimulator market.
Increasing Geriatric & Obese Population with Delayed Bone Healing
Age-related osteopenia, diabetes, and obesity impair endogenous osteogenesis. Low-intensity pulsed ultrasound has restored osteoblast activity in diabetic models to near-normal levels, providing a non-pharmacologic solution for compromised healing. Government research funding, exemplified by a USD 40 million Defense Health Agency grant to Wake Forest Institute for Regenerative Medicine, is catalyzing novel materials and delivery platforms aimed at these high-risk cohorts [3]Yingying Wang, "Evaluate the effects of low-intensity pulsed ultrasound on dental implant osseointegration under type II diabetes," Frontiers in Bioengineering and Biotechnology, frontiersin.org. Such support accelerates translation from lab to clinic and reinforces long-run adoption curves in the bone growth stimulator market.
Expansion of Reimbursed Spinal-Fusion Indications
Medicare’s nationwide prior-authorization requirement for osteogenesis stimulators became effective in November 2024. Although the rule adds an administrative layer, it standardizes coverage criteria and reassures device makers that compliant claims will clear. Magnetic-field lumbar fusion devices show 97% success compared with 62% for surgery alone, compelling payers to add or preserve coverage for high-risk cervical and multi-level fusions. Europe is following with incremental reimbursement wins tied to national health-technology assessments, which slowly broadens access and enlarges the bone growth stimulator market footprint.
Restraints Impact Analysis*
| Restraint | (~) % Impact on CAGR Forecast | Geographic Relevance | Impact Timeline |
|---|---|---|---|
| High device cost & limited reimbursement outside the US | −0.8% | Global, particularly emerging markets and selective EU regions | Medium term (2-4 years) |
| Safety & efficacy concerns around BMP/PRP biologics | −0.6% | Global, heightened scrutiny in North America and EU | Long term (≥ 4 years) |
| Low patient adherence to long-duration stimulation protocols | −0.5% | Global, higher impact in home-care settings | Short term (≤ 2 years) |
| Emerging EMF-exposure limits constraining device field strength | −0.3% | North America & EU, potential global expansion | Medium term (2-4 years) |
| Source: Mordor Intelligence | |||
High Device Cost & Limited Reimbursement Outside the US
Advanced stimulators can exceed USD 5,000 per unit, putting them beyond reach for many health systems without robust insurance. Global harmonization of device regulations is also lengthening approval times and raising compliance costs, pushing small innovators out of price-sensitive markets. China’s fast-track pathway mitigates this barrier somewhat, yet reimbursement remains sparse, delaying broad uptake. Over time, cost curves should bend downward as production scales and more clinical-outcome evidence convinces payers to cover the technology.
Safety & Efficacy Concerns Around BMP/PRP Biologics
Recombinant human BMP-2 has logged adverse events ranging from ectopic bone formation to postoperative pain, with 62 FDA reports linked to nonspinal indications. Variable platelet-rich plasma preparation further clouds efficacy, with meta-analyses showing inconsistent fusion improvements. Regulators now demand tighter manufacturing controls and longer-term surveillance, delaying market entry for biologic products and tempering short-run growth in the bone growth stimulator market.
*Our forecasts treat driver/restraint impacts as directional, not additive. The impact forecasts reflect baseline growth, mix effects, and variable interactions.
Segment Analysis
By Product: Devices Lead While Biologics Accelerate
Revenue from stimulation devices captured 67.05% of bone growth stimulator market share in 2025. Combined magnetic field, pulsed electromagnetic field, and capacitive coupling technologies dominate because they align with outpatient workflows and deliver robust fusion rates across fracture classes. Embedded sensor packages now report compliance metrics, thereby supporting reimbursement documentation and strengthening provider confidence. Internal stimulators occupy niche indications where external fields cannot penetrate, such as deep-pelvic fractures, and are benefiting from miniaturized battery systems that extend service life.
Biologic stimulation agents represent the fastest growing cohort, expanding at a 5.96% CAGR. Formulations that blend recombinant growth factors with mesenchymal stem cells and scaffold matrices promise synergistic osteoinduction. Recent clinical trials recorded 91% radiographic union at 12 months in recalcitrant non-union cases, surpassing historical benchmarks. Artificial intelligence now guides donor-cell selection and dose scheduling, improving consistency and accelerating regulatory review. The combined momentum positions the biologic segment to command a larger slice of the bone growth stimulator market size over the next decade.



By Application: Spinal Dominance Meets Dental Innovation
Spinal fusion accounted for 56.92% of bone growth stimulator market demand in 2025 because solid arthrodesis remains critical to pain relief and neural decompression success. Surgeons increasingly prescribe adjunct stimulators for multi-level cervical and high-risk lumbar cases, confident in randomized evidence showing 30-point gains in radiographic fusion scores relative to controls. Hospitals are embedding stimulation protocols into enhanced recovery pathways, trimming length of stay and lowering readmissions, which raises the perceived value of the therapy.
Oral and maxillofacial indications register the highest forward CAGR at 6.05%. Dental implantology leans on low-intensity ultrasound and capacitive coupling to maintain crestal bone height, reducing implant failure in smokers and diabetic patients. Platelet-rich fibrin matrices are advancing alveolar ridge preservation, producing a 12 percentage-point increase in vital bone volume versus conventional grafting. These gains spur adoption among periodontists and oral surgeons and enlarge the bone growth stimulator market in office-based dentistry.
By End User: Hospitals Anchor While Home Care Expands
Hospitals and orthopedic centers retained 53.62% of global revenue in 2025 because complex trauma, poly-fracture management, and multilevel spinal fusions are still concentrated in tertiary settings. Multidisciplinary teams and on-site imaging make hospitals the logical first adopter of high-capability internal stimulators and AI-linked devices.
Home-based therapy is the fastest growing channel at a 5.88% CAGR, enabled by lighter wearables and secure data portals that let clinicians monitor adherence remotely. Osteoboost’s prescription wearable for osteopenia, cleared by FDA in 2024, is the first non-pharmaceutical device to target systemic bone loss and underscores how consumer-style design can unlock chronic-care markets. Ambulatory surgery centers stand between hospital and home, offering bundled fracture care with lower facility fees, and are increasingly installing loaner device programs to support same-day discharge.
Geography Analysis
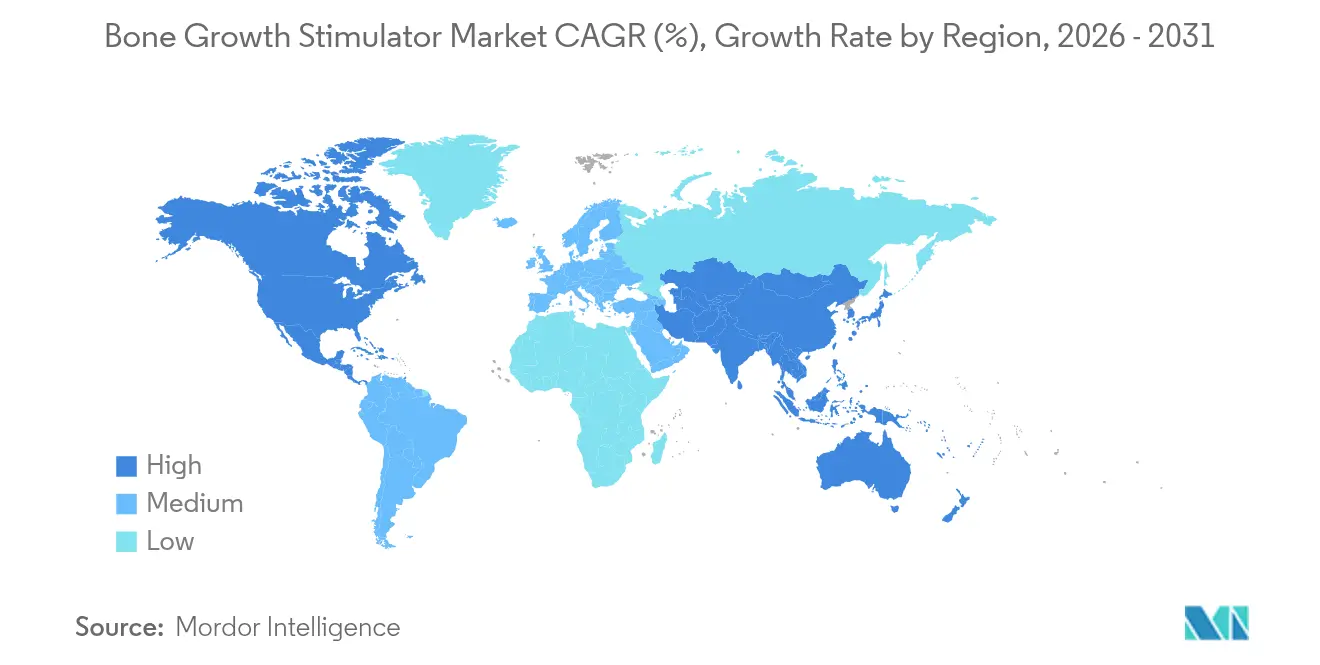
North America controlled 44.05% of global revenue in 2025. Medicare coverage, broad commercial insurance adoption, and a dense roster of level-I trauma centers support high procedural volumes and rapid technology refresh cycles. The Defense Health Agency has earmarked USD 40 million for regenerative medicine platforms, creating an innovation flywheel that benefits domestic suppliers. Regulatory tightening, such as the 2024 nationwide prior-authorization mandate for osteogenesis stimulators, introduces documentation burdens but also codifies long-term reimbursement certainty, sustaining the bone growth stimulator market.
Europe remains a mature but opportunity-rich region. Medical Device Regulation transition periods run until December 2027, allowing incumbents to market legacy products while updating clinical dossiers for future certificates. Germany, France, and Italy anchor regional demand thanks to well-established orthopedic infrastructures, while Scandinavian payers pilot outcome-based contracts that reimburse stimulators only when union is confirmed radiographically. The approach encourages vendors to supply connectivity modules that feed fusion progress automatically into insurer dashboards, enhancing transparency and patient engagement.
Asia-Pacific is on the steepest expansion path at a 6.18% CAGR through 2031. China’s National Medical Products Administration has accelerated device approvals and is drafting separate guidelines for electromagnetic field exposure limits, creating clarity for importers. Japan’s PMDA classification for regenerative therapies allows expedited filing for cell-enhanced biomaterials that pair with external stimulators, lifting launch activity. India’s growing trauma caseload and burgeoning private insurance sector propel hospital procurement of mid-range stimulators, while Australia and South Korea continue to adopt top-tier devices through public-hospital tender cycles. These dynamics collectively expand the bone growth stimulator market size across diverse healthcare spending brackets.

Regulatory Landscape
In the United States, oversight for bone growth stimulators is centered on FDA device classification and quality-system compliance. On April 16, 2026, the FDA issued a final order reclassifying non-invasive bone growth stimulators (product codes LOF and LPQ) from Class III to Class II, moving market access to the 510(k) pathway and tying clearance to defined special controls (including biocompatibility and performance testing, plus specific labeling requirements). In parallel, the FDA Quality Management System Regulation (QMSR) became effective in February 2026, incorporating ISO 13485:2016 and tightening expectations around manufacturer quality documentation used across global supply chains.
In Europe, products that incorporate medicinal substances fall under drug-device combination frameworks aligned to the Medical Device Regulation (MDR), with the principal mode of action (PMOA) determining whether the submission proceeds primarily as a medical device or a medicinal product. EMA guidance on the medical device and medicinal product interface, including combination-product coordination, emphasizes early PMOA alignment and evidence planning for device-led stimulators that include ancillary biologic components. For implantable and non-active implant-adjacent components used in some stimulation solutions, ISO 14630:2024 provides an updated baseline for safety and performance expectations referenced during conformity assessment.
Competitive Landscape
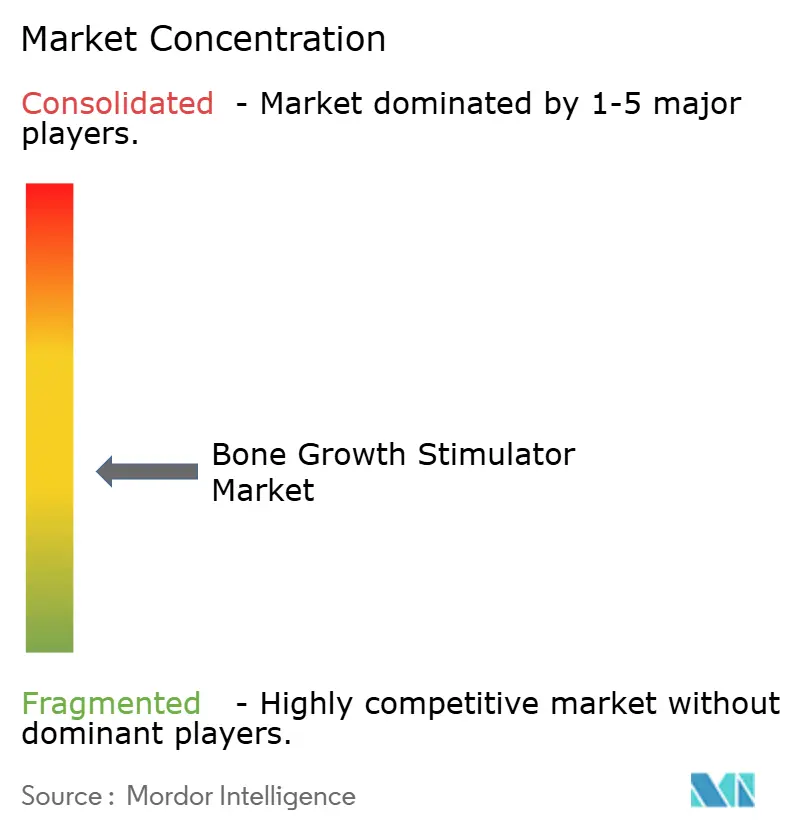
The bone growth stimulator market exhibits a moderately concentrated profile. Five multinationals—Medtronic, Bioventus, Orthofix, Zimmer Biomet, and Stryker—collectively hold a significant portion of global revenue. They leverage scale, surgeon-education programs, and bundled spine-surgery portfolios to keep contract positions in major hospital networks. Orthofix’s merger with SeaSpine in 2024 created a spine-to-stimulator continuum that allows cross-selling and shared R&D, tightening the moat around its US accounts.
Mid-tier specialists are carving defensible niches. IGEA S.p.A. focuses on pulsed electromagnetic field platforms with proprietary compliance sensors, while Theragen builds capacitive coupling stimulators engineered for lower-back ergonomics. Stimwave Technologies concentrates on fully implantable wireless systems that avoid percutaneous leads and cut infection risk. These companies compete by winning physician champions and publishing targeted clinical series that highlight workflow savings rather than headline fusion metrics.
Start-ups and digital-health entrants eye home care and chronic insufficiency fractures. Osteoboost integrates inertial sensors and cloud analytics in a wrist-worn device for systemic bone density management, signaling convergence between orthopedic hardware and consumer health electronics. Universities such as Pittsburgh have 3D-printed metamaterial implants with embedded triboelectric generators that power onboard telemetry modules, illustrating how mechanical energy harvesting can one day remove batteries from internal stimulators. Such breakthroughs portend heightened competitive churn and present acquisition targets for incumbents seeking differentiated IP.
Bone Growth Stimulator Industry Leaders
-
Medtronic Plc
-
Zimmer Biomet
-
Orthofix International NV
-
Johnson and Johnson (DePuy Synthes)
-
Bioventus LLC
- *Disclaimer: Major Players sorted in no particular order

Market Opportunities and Future Outlook
The April 2026 FDA reclassification of non-invasive bone growth stimulators (LOF and LPQ) from Class III to Class II creates a clearer whitespace for companies to broaden line extensions and compete through the 510(k) route, provided they can meet special controls around biocompatibility, energy-output performance testing, and labeling. This shift aligns with the February 2026 QMSR transition that incorporates ISO 13485:2016, favoring manufacturers that can run a single, harmonized quality system across North America and other regulated markets while keeping design controls audit-ready for connected and wearable compliance features.
Reimbursement and coding execution remain a practical focus, with CMS updates affecting non-invasive bone growth stimulator billing tied to HCPCS codes E0747, E0748, and E0760 in mid-2026. This environment supports commercial value for devices and software workflows that simplify documentation for prior authorization and improve claims integrity, particularly in the United States where payer scrutiny has intensified. On the innovation side, 2026 academic work on ultrasound-activated piezoelectric scaffolds and bionic periosteum concepts highlights a pipeline opportunity for hybrid approaches that combine physical stimulation with biodegradable, osteoinductive structures, supporting longer-duration local therapy without creating additional implant maintenance complexity.
Recent Industry Developments
- July 2026: Orthofix filed a Form 8-K outlining CMS reimbursement guidance changes affecting non-invasive bone growth stimulators, including HCPCS codes E0747, E0748, and E0760. The update underscored how quickly billing policy can shift during 2026 and reinforced the importance of payer-ready documentation and coding support for bone stimulation adoption.
- July 2025: Enovis launched the Manafuse bone growth stimulator using low-intensity pulsed ultrasound (LIPUS) technology. The launch broadened competitive intensity in ultrasound-based stimulation and expanded the product mix available for home-use and outpatient workflows.
- July 2024: Orthofix announced 510(k) clearance and the first implant of its Fitbone transport and lengthening system. While not a stimulator, the clearance and early clinical use supported Orthofixs broader orthopedic reconstruction platform strategy, which can influence downstream demand for adjunct bone-healing therapies in complex cases.


Research Methodology Framework and Report Scope
Market Definition and Coverage
This market is defined as the revenue generated from bone growth stimulation solutions used to support bone healing in clinical and home settings, including device-based stimulators and biologic stimulation agents, measured in USD across major regions.
Scope exclusions: purely supportive orthopedic braces, general physical therapy equipment, and surgical implants that do not deliver bone growth stimulation are not counted.
Segmentation Overview
-
By Product
-
Bone Growth Stimulation Devices
-
External Bone Growth Stimulators
- Combined Magnetic Field (CMF) Devices
- Capacitive Coupling (CC) Devices
- Pulsed Electromagnetic Field (PEMF) Devices
- Implanted Bone Growth Stimulators
- Ultrasonic Bone Growth Stimulators
-
External Bone Growth Stimulators
-
Biologic Stimulation Agents
- Bone Morphogenetic Proteins (BMP)
- Platelet-Rich Plasma (PRP)
- Cell-based Osteogenic Matrices
-
Bone Growth Stimulation Devices
-
By Application
- Spinal Fusion Surgeries
- Delayed & Non-union Fractures
- Oral & Maxillofacial Procedures
- Trauma Surgeries
- Other Applications
-
By End User
- Hospitals and Orthopedic Centers
- Ambulatory Surgical Centers
- Home Care Settings
- Others
-
By Geography
-
North America
- United States
- Canada
- Mexico
-
Europe
- Germany
- United Kingdom
- France
- Italy
- Spain
- Rest of Europe
-
Asia-Pacific
- China
- Japan
- India
- Australia
- South Korea
- Rest of Asia-Pacific
-
Middle East and Africa
- GCC
- South Africa
- Rest of Middle East and Africa
-
South America
- Brazil
- Argentina
- Rest of South America
-
North America
Data Sources, Market Sizing, and Validation
Desk Research
Desk work starts by building the clinical and reimbursement backdrop and then mapping it to demand indicators. We review public sources such as the US FDA device databases, the US CDC injury statistics, the OECD Health Statistics, the World Bank population and health spend series, and World Health Organization health system indicators to ground incidence, procedure volumes, and care access patterns.
To anchor the commercial side, we also rely on company filings and investor presentations, relevant orthopedic society publications, peer reviewed clinical journals for adoption signals, and reputable press coverage for regulatory and reimbursement changes. Where needed, a paid subscription source for company financials and news is used to cross-check revenue direction and pricing commentary, and a patent database is used to track technology activity. The specific desk sources listed here are illustrative, and many other public references are also consulted for data collection, validation, and research clarification.
Primary Interviews and Surveys
Primary inputs are taken through expert discussions and structured surveys with manufacturers, distributors, orthopedic clinicians, and payer knowledgeable stakeholders, so the pricing and adoption story matches what is seen in day to day practice. Coverage is balanced across APAC, EMEA, and the Americas, and the conversations are used to confirm procedure level usage, typical therapy duration, and the real net selling price after common discounts.
Distribution of primary research fieldwork respondents
| Company type | Respondent position | Region |
|---|---|---|
| Top tier: 39% | CXOs: 17% | APAC: 40% |
| Mid tier: 43% | Functional/Unit leaders: 40% | EMEA: 34% |
| Smaller Players: 18% | Managers: 43% | Americas: 26% |
Market-Sizing & Forecasting
Sizing starts with a top-down build where treated patient pools and procedure counts are converted into addressable demand. We link spinal fusion volumes, delayed and non-union fracture incidence, the share of cases where stimulators are prescribed, and typical therapy duration to arrive at annual unit demand, which is then valued using region specific average selling prices (ASPs).
Those totals are then checked with selective bottom-up approximations, such as rolling up a sample of supplier revenues by region and running channel checks on product mix, before final numbers are adjusted. Key inputs that move the model include reimbursement coverage direction, outpatient and home care adoption, clinical guideline preferences by indication, and pricing trends between electrical and ultrasound technologies. Forecasting is done using scenario analysis supported by simple regression style relationships between procedure volumes, aging trends, and healthcare spending, and then refined through expert consensus on how prescribing and ASPs may change over time. When parts of the chain lack clean data, we use conservative assumptions and widen validation through additional interviews in that geography.
Data Validation & Update Cycle
Outputs are validated by comparing the final market values with independent signals like procedure growth, device utilization feedback from clinicians, and the implied spend per treated case by region. Variances are reviewed step by step, and if a number looks off, the assumptions behind volume, mix, or ASP are reopened, and respondents may be re-contacted to confirm what changed.
Before sign-off, the model and logic go through multi person analyst review so calculation errors and scope leakage are caught early. The report is refreshed annually, and interim updates are made when material events occur, such as major reimbursement changes or notable regulatory actions. Right before delivery, we run a fresh data pass so clients receive the latest updated view.
Mordor Intelligence's Bone Growth Stimulator Market Size Versus Other Published Estimates
Published market sizes for bone growth stimulators can look far apart, even when the topic sounds identical. The differences usually come from what is counted as a stimulator solution, which year is used as the anchor, and how pricing and procedure volumes are translated into revenue.
A refresh-led gap is also common because FX timing, list price versus net ASP, and the pace of reimbursement changes do not move in a straight line. When pricing is updated with region-level discount patterns and then rechecked against procedure signals close to the publication window, the total tends to land differently, which is the cadence choice applied by Mordor Intelligence.
Benchmark comparison
| Source | Market Size | Gaps in Research Methodology |
|---|---|---|
| Mordor Intelligence | USD 1.44 B (2026) | |
| Global Consultancy A | USD 1.87 B (2024) | Uses an earlier base year and may apply a higher blended ASP without fully normalizing for regional discounting and currency timing, which can inflate the value when procedure growth is backcasted. |
| Industry Research Group B | USD 1.07 B (2023) | Anchors on an older pricing and utilization picture and may undercount biologic stimulation agents or home care uptake, which can compress the revenue pool in markets with faster reimbursement expansion. |
The spread across sources mainly traces back to timing and what gets included in the revenue pool, followed by how ASPs are kept current across regions. By tying the model to procedure-linked demand and routinely revalidating net pricing assumptions, the final estimate stays traceable to inputs that can be checked and repeated.


Key Questions Answered in the Report
What is the current value of the bone growth stimulator market?
The market is valued at USD 1.44 billion in 2026 and is projected to reach USD 1.86 billion by 2031 at a 5.19% CAGR.
Which product category dominates sales?
External and implanted stimulation devices captured 67.05% of global revenue in 2025.
Which application segment is growing fastest?
Oral and maxillofacial procedures lead growth at a 6.05% CAGR through 2031 due to rising dental implant volumes and advanced bone-grafting techniques.
Why is Asia-Pacific the fastest-growing region?
Rapid healthcare infrastructure build-out, regulatory reforms that speed device approvals, and large aging populations push regional CAGR to 6.18% through 2031.
How are payers influencing adoption in North America?
Medicare’s national prior-authorization program standardizes evidence requirements, ensuring coverage continuity but demanding rigorous documentation from providers.
What technological trends could reshape competition?
Smart implants with self-powered telemetry, AI-guided therapy personalization, and wearables for home care are converging to create next-generation solutions.
Page last updated on:


 Your data is secure and never sold or shared.


