
Bone Grafts And Substitutes Market Size and Share
Market Overview
| Study Period | 2020 - 2031 |
|---|---|
| Market Size (2026) | USD 4.41 Billion |
| Market Size (2031) | USD 5.75 Billion |
| Growth Rate (2026 - 2031) | 5.45 % |
| Fastest Growing Market | Asia Pacific |
| Largest Market | North America |
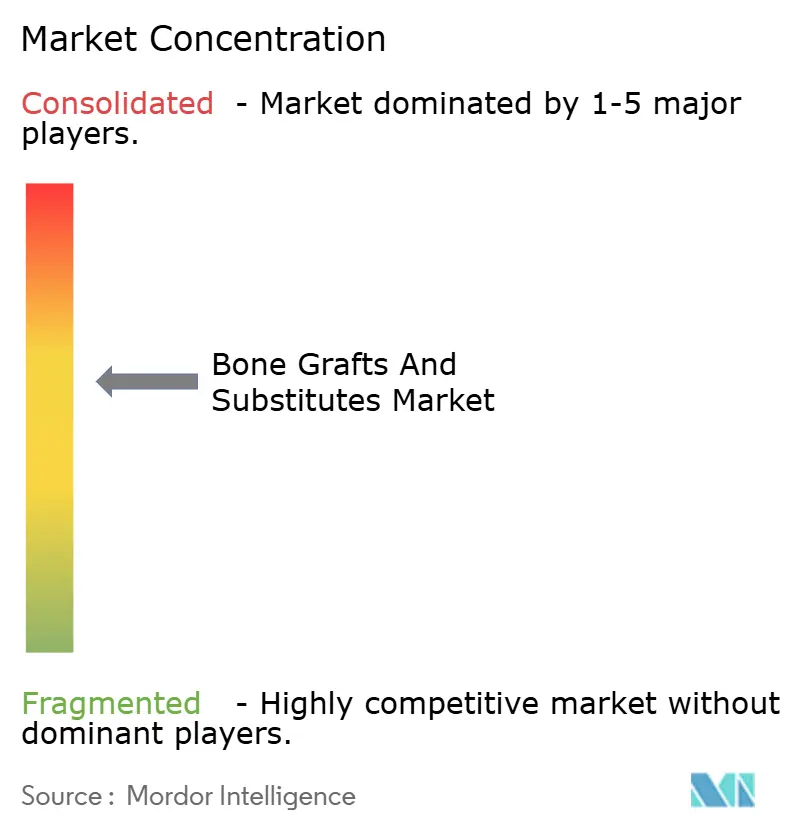
| Market Concentration | Medium |
Major Players *Disclaimer: Major Players sorted in no particular order Image © Mordor Intelligence. Reuse requires attribution under CC BY 4.0. | |
Bone Grafts And Substitutes Market Analysis by Mordor Intelligence
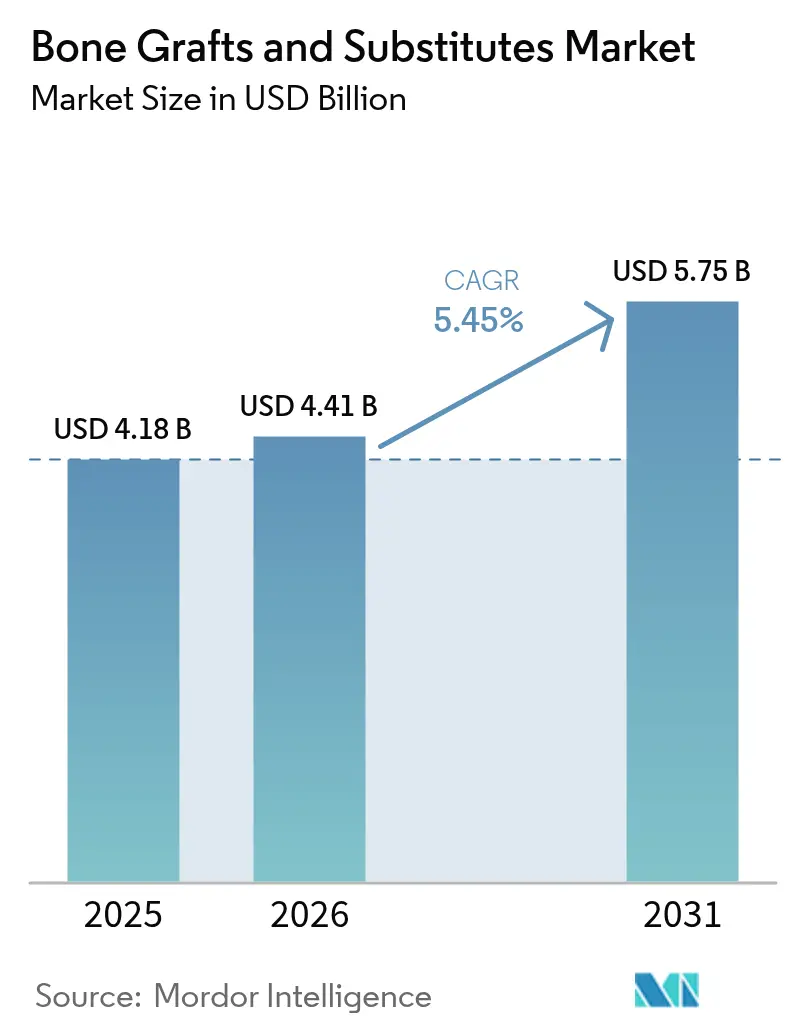
The bone grafts and substitutes market size in 2026 is estimated at USD 4.41 billion, growing from 2025 value of USD 4.18 billion with 2031 projections showing USD 5.75 billion, growing at 5.45% CAGR over 2026-2031. Rapid progress in nanoscale 3-D printing, breakthroughs in bioactive glass and calcium-phosphate ceramics, and wider acceptance of cell-based matrices are shifting surgeon preference away from traditional autografts toward precision-engineered alternatives. Procedure volumes in spinal fusion and joint reconstruction continue expanding, with minimally invasive techniques enabling earlier interventions that drive steady product demand. Regulatory support is also accelerating innovation; FDA breakthrough designations awarded to new grafts shorten commercialization timelines while signaling clinical value. Industry participants layer competitive advantages around proprietary surface technologies, porous architectures, and patient-specific design—all aimed at faster fusion, lower complication rates, and more predictable healing.
Key Report Takeaways
- By product type, allografts held 42.10% of bone grafts and substitutes market share in 2025 and are expanding at a 6.05% CAGR to 2031.
- By material, calcium-phosphate ceramics commanded 44.00% share of the bone grafts and substitutes market size in 2025, while bioactive glass is set to advance at a 6.32% CAGR through 2031.
- By application, spinal fusion accounted for 54.55% of the bone grafts and substitutes market size in 2025 and is forecast to widen at a 6.55% CAGR to 2031.
- By end user, hospitals controlled 60.70% of bone grafts and substitutes market share in 2025, whereas ASCs post the highest projected CAGR at 6.80% through 2031.
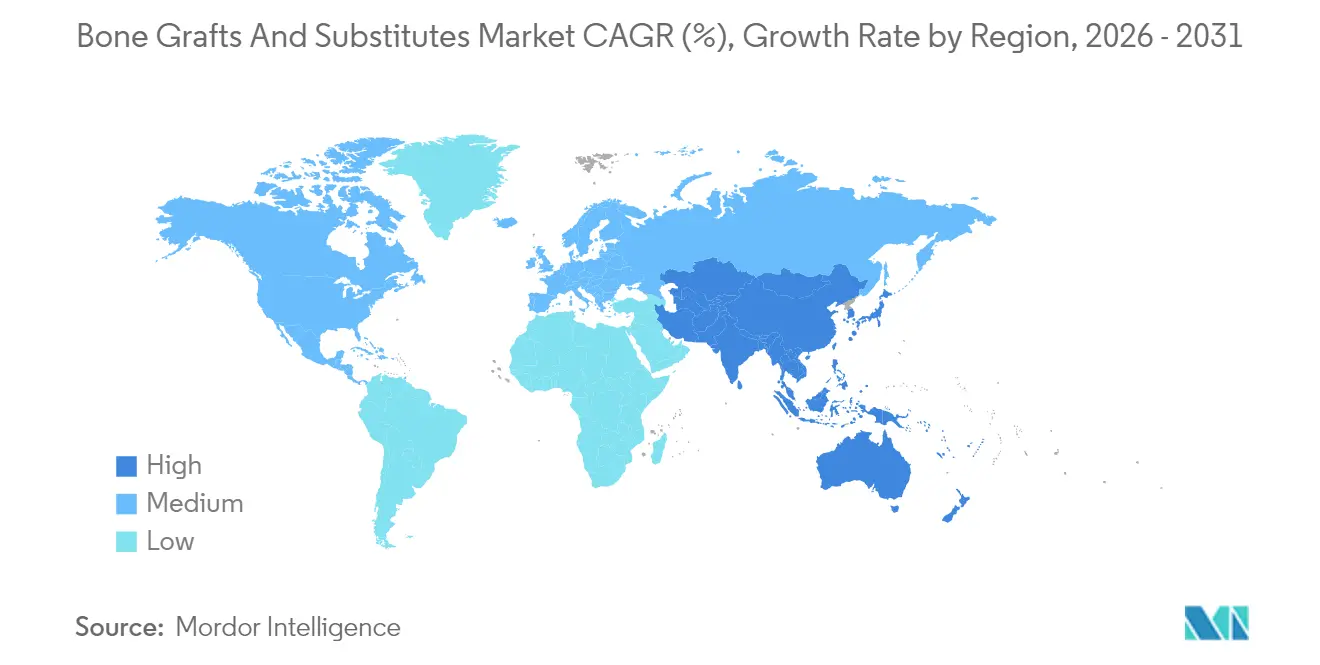
- By geography, North America commanded 41.85% of 2025 global revenue, whereas Asia-Pacific is rising at a 7.05% CAGR through 2031.
Note: Market size and forecast figures in this report are generated using Mordor Intelligence’s proprietary estimation framework, updated with the latest available data and insights as of 2026.
Market Trends and Insights
Drivers Impact Analysis of Bone Grafts And Substitutes Market*
| Driver | (~) % Impact on CAGR Forecast | Geographic Relevance | Impact Timeline |
|---|---|---|---|
| Increasing spinal-fusion & joint-reconstruction volumes | +1.2% | Global, with concentration in North America & Europe | Medium term (2-4 years) |
| Rising geriatric population with osteoporosis & trauma risk | +1.8% | Global, particularly APAC and North America | Long term (≥ 4 years) |
| Technological advances in synthetic & cell-based matrices | +0.9% | North America & Europe, expanding to APAC | Medium term (2-4 years) |
| Shift from autografts to off-the-shelf substitutes | +0.7% | Global, led by North America and Europe | Short term (≤ 2 years) |
| 3-D printed, patient-specific scaffolds enable complex reconstructions | +0.6% | North America & Europe | Long term (≥ 4 years) |
| Ambulatory-surgery-center demand for minimally-invasive delivery kits | +0.5% | North America, expanding to Europe and APAC | Medium term (2-4 years) |
| Source: Mordor Intelligence | |||
Increasing Spinal-Fusion & Joint-Reconstruction Volumes
Posterior cervical fusions for deformity grew at a 16.5% CAGR versus 9.7% for standard cases, confirming surgeon confidence to tackle complex anatomy with modern implants. ASCs expect orthopedic outpatient cases to climb 13% this decade, making rapid-setting grafts essential to same-day discharge targets. High throughput combined with heightened complexity shifts purchasing toward bone graft substitutes that reduce harvest-site morbidity, shorten operating time, and integrate seamlessly with interbody cages. Surgeons increasingly treat graft substitutes not as secondary fillers but as frontline enablers of workflow efficiency and enhanced patient recovery.
Rising Geriatric Population with Osteoporosis & Trauma Risk
Projected lower-limb arthroplasties in Colombia illustrate global momentum, rising to 39,270 procedures by 2050 at a 5.54% CAGR, driven primarily by aging female cohorts. Elderly patients present diminished osteogenic capacity and higher infection risk, raising the bar for graft bioactivity and antimicrobial performance. Medicare joint-arthroplasty reimbursements slid substantially from 2013 to 2021 despite higher beneficiary counts, forcing health systems to prioritize cost-effective grafts that outperform autografts without inflating episode costs, according to a September 2024 analysis of the Medicare Part B database published in the Journal of Orthopaedic Experience & Innovation.
Calcium-doped titanium surfaces show promise in minimizing infection by modulating fibrinogen adsorption and bacterial adherence, which is vital in older populations with compromised immunity. Together these demographic and clinical pressures propel demand for bone graft substitutes that pair osteoinductivity with robust antimicrobial defenses.
Technological Advances in Synthetic & Cell-Based Matrices
Coral-inspired grafts created at Swansea University heal in 2-4 weeks and dissolve fully over 6-12 months, mirroring natural bone remodeling. University of Sydney scientists pushed nanoscale 3-D printing to replicate grain size and porosity of cancellous bone, achieving mechanical strength akin to native tissue. Cell-viable matrices such as Osteocel Plus demonstrate improved fusion but await FDA clarity for engineered MSC content, which could unlock next-level biologics once regulatory pathways settle. Material science gains are increasingly married to additive manufacturing, enabling tailored stiffness, degradation, and bioactive signaling that exceed autograft benchmarks. These converging capabilities cement a technology-driven growth arc for the bone grafts and substitutes market.
3-D Printed, Patient-Specific Scaffolds Enable Complex Reconstructions
Use of individualized hydroxyapatite implants in maxillofacial repair delivered favorable outcomes across 13 patients, highlighting clinical maturation of patient-specific grafts. Dual-thermal, shape-memory composites permit minimally invasive delivery that expands in situ and offers photothermal tumor ablation, serving both reconstructive and oncologic objectives. High-porosity (>50%) scaffolds with 300-400 µm pore sizes maximize nutrient diffusion, accelerating osteogenesis across long-bone defects. Tri-element-doped constructs add antibacterial potency while preserving osteoconduction, reducing postoperative infection risk. Patient-specific designs thus redefine the art of reconstruction by combining perfect anatomical fit with multifunctional biological performance.
Restraints Impact Analysis of Bone Grafts And Substitutes Market*
| Restraint | (~) % Impact on CAGR Forecast | Geographic Relevance | Impact Timeline |
|---|---|---|---|
| High cost & patchy reimbursement for premium grafts | -0.8% | Global, particularly acute in emerging markets | Short term (≤ 2 years) |
| Disease-transmission / immune-response risk with allo- & xenografts | -0.5% | Global, with regulatory variations by region | Medium term (2-4 years) |
| Medical-grade calcium-phosphate supply bottlenecks | -0.4% | Global, concentrated in manufacturing hubs | Short term (≤ 2 years) |
| Nano-ceramic-particle inflammation triggering tougher regulation | -0.3% | North America & Europe, expanding globally | Long term (≥ 4 years) |
| Source: Mordor Intelligence | |||
High Cost & Patchy Reimbursement for Premium Grafts
Basic synthetic materials cost USD 46.2–140, while premium grafts exceed reimbursement caps, leading facilities to limit use to complex cases. Coverage for stem-cell-enhanced products remains conditional, intensifying uncertainty for innovators navigating evidence-based reimbursement hurdles. Regional variability compounds the issue; U.S. Northeast saw the steepest payment declines despite the highest baseline rates, underscoring geographic inconsistency in economic viability.
Disease-Transmission / Immune-Response Risk with Allo- & Xenografts
FDA records list 62 adverse BMP-related events—nearly half requiring revision surgery—driving heightened scrutiny of biological grafts. Reviews investigating BMP-2 carcinogenicity produce mixed conclusions, sustaining clinical caution despite lack of definitive evidence of tumor initiation. Tissue banks employ advanced viral-inactivation protocols, yet fear of immune response and transmission keeps synthetic alternatives attractive. Xenografts undergo extensive deproteinization to curb immunogenicity but still face regulatory headwinds. Collectively, safety concerns reinforce preference for ceramics, composites, and emerging synthetic matrices in the bone grafts and substitutes market.
*Our forecasts treat driver/restraint impacts as directional, not additive. The impact forecasts reflect baseline growth, mix effects, and variable interactions.
Bone Grafts And Substitutes Market Segment Analysis
By Product Type:
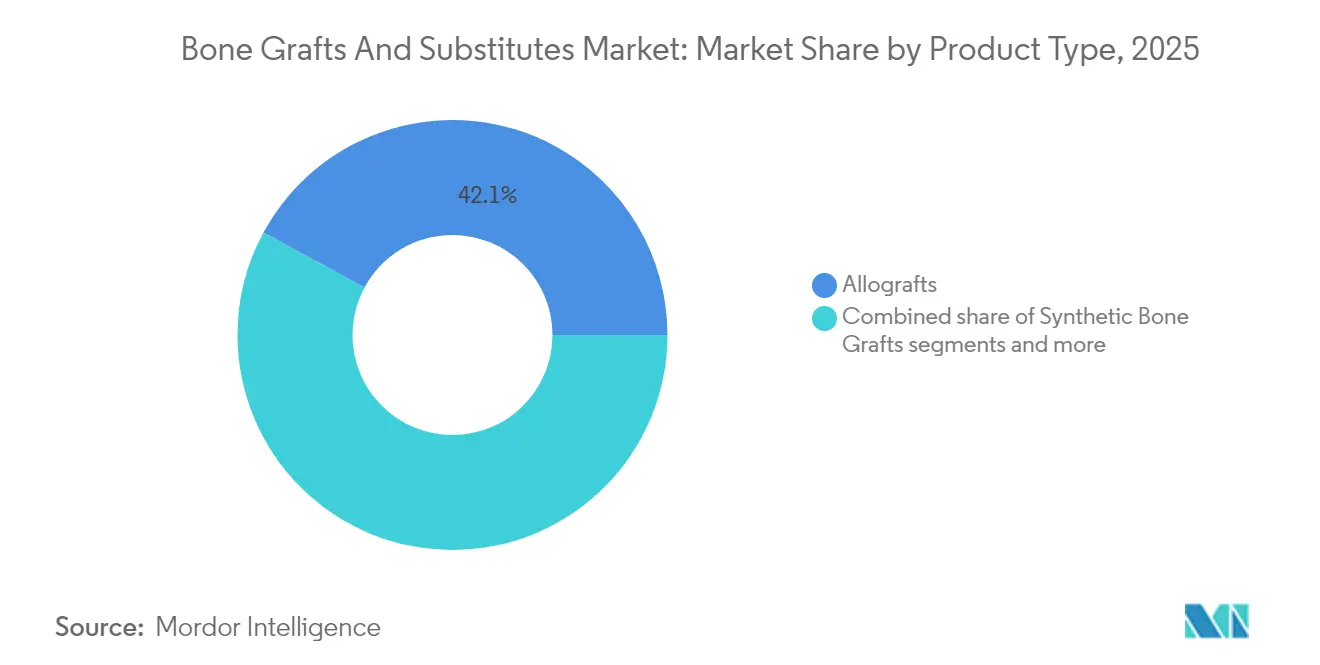
Allografts Maintain Leadership Despite Synthetic InnovationAllografts captured the largest slice of bone grafts and substitutes market share at 42.10% in 2025, supported by clinician familiarity and strong osteoinductive profiles. Hospitals value their supply predictability, while tissue banks refine processing to safeguard biologic potency and viral safety. The bone grafts and substitutes market size for allografts is projected to rise steadily, propelled by fiber-based demineralized matrices that deliver improved handling and minimal donor-site morbidity. Synthetic grafts are closing the gap through nano-engineered surfaces and controlled degradation, and cell-based matrices post the fastest growth as regulatory clarity improves.
Competitive dynamics center on differentiation by specific procedure. Xenografts hold niche traction in dental indications that benefit from non-resorbable properties. Novel non-resorbable allografts extend longevity, easing revision anxiety in load-bearing zones. Cryopreserved viable bone matrices target premium clinical segments after Enovis and Ossium Health linked distribution reach with biologic innovation. Each product category therefore positions itself around a discrete clinical need set—safety, biological potency, or ease of use.



By Material:
Calcium-Phosphate Ceramics Lead While Bioactive Glass AcceleratesCalcium-phosphate ceramics represented 44.00% of bone grafts and substitutes market share in 2025 thanks to predictable biocompatibility and established regulatory paths. Advances in porosity tuning and silicon doping improve mechanical strength while accelerating osseointegration. The bone grafts and substitutes market size attached to bioactive glass grows fastest as newer formulations manage degradation kinetics and heighten osteostimulation. Polymer-based options remain in early adoption, valued for elasticity and drug-release potential in trauma settings. Composite matrices combining hydroxyapatite and collagen now rival iliac crest graft fusion rates while eliminating harvest pain. Supply reliability also shapes material selection; calcium sulfate modifications attempt to slow resorption without sacrificing structural integrity.
By Application:
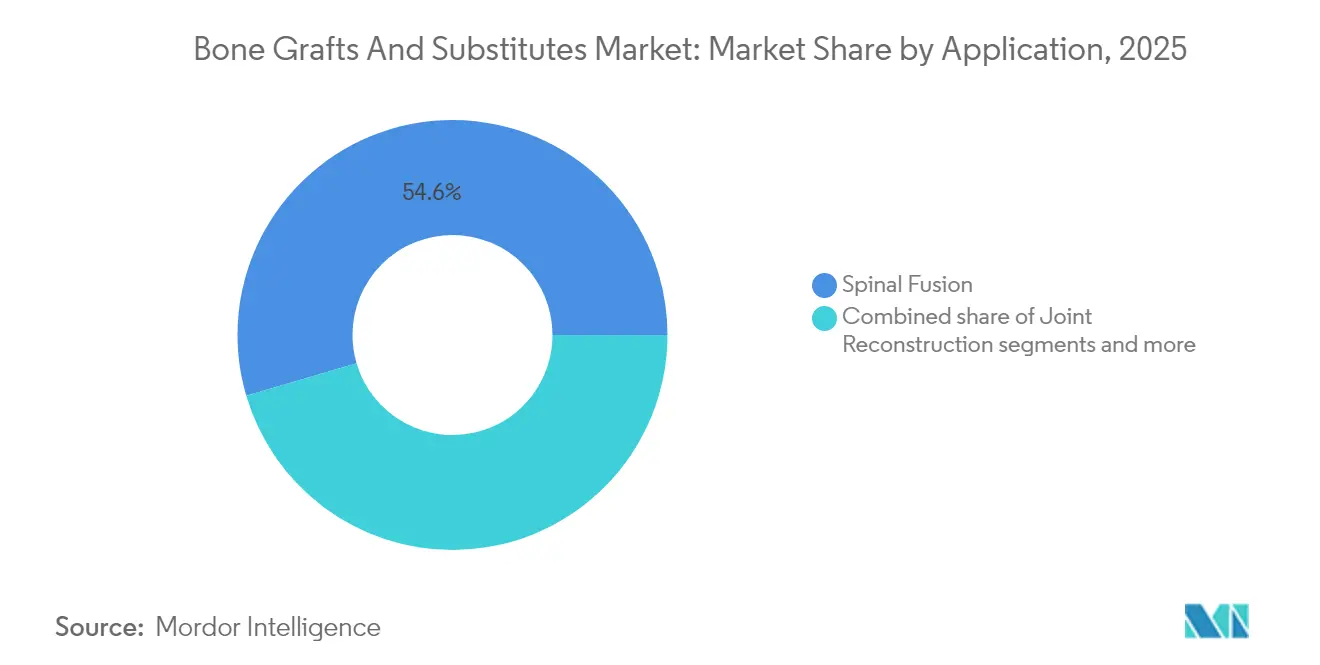
Spinal Fusion Dominance Drives Innovation FocusSpinal fusion remained the largest application, covering 54.55% of bone grafts and substitutes market size in 2025. The segment attracts the bulk of R&D funding as companies chase materials that shorten fusion times and fit minimally invasive cages. Synthetic peptide-based grafts such as i-Factor achieved 69% success in cervical fusions, surpassing autograft outcomes and accelerating clinical adoption. Trauma and craniomaxillofacial follow, buoyed by 3-D printed implants that conform to complex geometries, while dental grafting sustains steady uptake through rising implant volumes and needs for predictable resorption.
By End User:
Hospitals Lead While ASCs Gain MomentumHospitals controlled 60.70% of bone grafts and substitutes market share in 2025, benefiting from multidisciplinary teams and capacity for complex orthopedics. Yet ASCs chart the most rapid expansion as outpatient protocols reshape payer incentives. Grafts optimized for syringe delivery and rapid handling allow surgeons to maintain throughput without compromising union quality. Specialty orthopedic clinics tailor procurement to standardized protocols, whereas dental clinics lean toward alloplastics like OsteoGen to circumvent donor-derived risks.
Geography Analysis
North America Bone Grafts and Substitutes Market
North America held 41.85% share in 2025, anchored by high procedure volumes, broad insurance coverage, and high surgeon comfort with premium products. Posterior cervical fusions for deformity continue to outpace other segments, underscoring demand for grafts that perform in challenging biomechanics. FDA breakthrough programs, such as Renovos’s gel, channel innovation swiftly into operating rooms.
Europe Bone Grafts and Substitutes Market
Europe stands second, characterized by rigorous evidence requirements and a penchant for ceramic and composite solutions. Germany and the United Kingdom invest heavily in biomaterials research, seeding a pipeline of glass-ceramic hybrids with controlled degradation profiles. Southern Europe’s aging demographics sustain demand even as cost containment exerts downward price pressure.
APAC Bone Grafts and Substitutes Market
Asia-Pacific records the fastest CAGR at 7.05%, driven by China’s hospital expansion, India’s burgeoning medical tourism, and Japan’s super-aged populace. Governments increase orthopedic funding, while local manufacturers scale additive-manufacturing capacity to lower import dependency. Wider insurance penetration and surgeon training programs further lift adoption of next-generation bone graft substitutes.

Regulatory Landscape
Regulation of bone grafts and substitutes is shaped by device-classification decisions, special controls, and tissue and biocompatibility requirements that vary by region and product composition. In the United States, many bone void fillers and dental bone grafting materials follow Class II pathways with 510(k) submissions, while products that incorporate therapeutic biologics can move into higher-risk pathways. FDA also continues to formalize product-specific expectations through guidance, including final guidance issued in August 2025 on animal study recommendations for dental bone grafting material devices to support 510(k) submissions.
In 2026, regulators added more product-specific structure for bone substitute categories. Effective June 5, 2026, FDA classified certain resorbable calcium salt bone void fillers that contain a single approved aminoglycoside antibacterial as Class II devices with special controls, tightening the performance and labeling framework while keeping an accessible route to market. In Europe, the Medical Device Regulation (MDR) remains the core framework for implantables. Commission Delegated Regulation (EU) 2026/1359 (published June 29, 2026) expanded the list of Class IIb implantable devices, including bone substitutes, that are exempt from systematic technical documentation assessment by Notified Bodies, reflecting a more streamlined approach for well-established technologies.
Value Chain Analysis
The value chain spans raw-material and tissue sourcing, processing and manufacturing, quality and regulatory compliance, and distribution into hospital, ASC, and dental channels. Upstream inputs include high-purity calcium-phosphate precursor powders and specialty bioceramic feedstocks for synthetics, as well as human tissue for allografts and bovine or porcine sources for xenografts. These inputs require controlled sourcing, traceability, and validated sterilization.
Manufacturing bottlenecks cluster around repeatable porosity and architecture control (especially for advanced ceramics and 3D-structured scaffolds), sterilization validation (for example, gamma or EtO methods), and compliance processes spanning ISO 13485 quality systems and biocompatibility testing expectations aligned with ISO 10993-1. Midstream players include graft and substitute manufacturers (synthetic, allograft/DBM, xenograft, and emerging cell-based matrices), alongside specialized service providers such as tissue banks and contract manufacturing organizations that support additive manufacturing and coating and surface processes. How products are classified also shapes the chain, since bone grafting materials are commonly regulated as Class II devices in the United States unless they incorporate a therapeutic biologic component, which increases evidence requirements and can reshape sourcing, release testing, and supplier qualification. On the supply side, scale-up efforts for advanced calcium-phosphate chemistries, including octacalcium phosphate volume production capability, support availability and can reduce lead times for high-throughput spine and reconstructive use cases.
Competitive Landscape
Market leadership remains with diversified device majors, Medtronic, Stryker, and Johnson & Johnson, each leveraging bundled portfolios and global distribution. Medtronic’s Adaptix Interbody System, enabled by Titan nanoLOCK surface microtopography, exemplifies in-house advancement combined with targeted M&A. Stryker’s Augment rhPDGF-BB product enhances ankle fusion, illustrating niche innovation that extends beyond spine.
Challenger firms pursue specialization: Renovos targets injectable gels; Cerapedics focuses on peptide-mineral constructs; Enovis partners for cryopreserved cell-viable matrices. Strategic collaboration intensifies as incumbents scout acquisition candidates with additive manufacturing or biologics expertise. Pricing competition remains secondary to performance differentiation, though hospital value-analysis committees increasingly weigh long-term fusion success against upfront graft cost.
Bone Grafts And Substitutes Industry Leaders
Medtronic Plc
Zimmer Biomet
Stryker Corporation
Johnson and Johnson
Smith+Nephew
- *Disclaimer: Major Players sorted in no particular order
Bone Grafts And Substitutes Market Companies Covered in this Report
- Medtronic
- Stryker
- Johnson & Johnson
- Zimmer Biomet
- Baxter International Inc. (Advanced Surgery)
- Integra LifeSciences Holdings Corp.
- Orthofix
- NuVasive
- Smith+Nephew plc
- RTI Surgical
- Geistlich Pharma
- Dentsply Sirona
- Biocomposites Ltd.
- Straumann Group
- Collagen Matrix
- SeaSpine Holdings Corp.
- Kuros Biosciences AG
- OsteoMed LLC
- AlloSource Inc.

Market Opportunities and Future Outlook
A near-term opportunity is in indication expansion and segment-specific solutions, where regulatory clearances directly widen addressable procedure pools. In April 2026, FDA 510(k) clearance for Stryker Spine's Vitoss Bone Graft Substitute expanded posterolateral spine indications to pediatric patients aged 6 years and older, and it reinforces a pathway for other suppliers to pursue age- and anatomy-specific labeling in spine. Similar momentum exists in dental, where FDA animal-study guidance finalized in August 2025 clarified the evidentiary bar for 510(k) submissions in dental bone grafting materials, creating whitespace for manufacturers to standardize preclinical packages and accelerate line extensions.
Technology-driven whitespace is increasingly defined by grafts that move beyond passive osteoconduction toward controlled bioactivity, infection-risk management, and workflow fit for outpatient care. The market already reflects demand for off-the-shelf substitutes that reduce harvest-site morbidity and integrate with minimally invasive delivery, particularly as ambulatory surgery centers expand orthopedic outpatient volumes and require consistent handling and set times. On the R&D side, published advances around immunomodulatory scaffolds, stage-adaptive barrier membranes for cranial defects, and localized biofactor delivery concepts (for example, BMP-7 mRNA-activated fibrin-CaP scaffolds) point to innovation routes that product developers can translate into differentiated synthetics and composites, especially in complex reconstructions where predictable healing and complication reduction drive adoption decisions.
Recent Industry Developments in Bone Grafts And Substitutes Market
- June 2026: SDIP Innovations announced FDA 510(k) clearance for the JAZBI Bone Void Filler, positioning its proprietary JAZBI biomaterial for commercial use as a resorbable graft substitute. The clearance adds another competitor in synthetics where performance, handling, and regulatory special controls shape purchasing decisions across orthopedic and trauma settings.
- May 2026: DePuy Synthes (Johnson & Johnson) entered an exclusive distribution agreement with CGBIO for NOVOSIS in the United States, Canada, and Australia. The deal broadens NOVOSIS commercial reach through a major orthopaedics channel and tightens competitive dynamics in surgeon-facing graft portfolios bundled alongside implant systems.
- October 2025: Bone Solutions received FDA 510(k) clearance expanding Mg OSTEOCRETE and Mg OSTEOINJECT for pediatric use in patients aged six and older, and for intervertebral body disc space use. The expanded labeling supports adoption in specialized spine and pediatric workflows where indication breadth and evidence packages influence hospital value analysis decisions.


Bone Grafts And Substitutes Market Report Scope and Research Methodology
Market Definition and Coverage
This market covers implantable bone grafts and bone-graft substitute materials used to fill bone voids, support fusion, and support bone healing in orthopedic and dental procedures. Our sizing is based on the value of products sold for these clinical uses across major geographies.
Scope exclusions: We exclude non-graft orthopedic implants, general wound-care biologics not intended for bone regeneration, and procedure service revenue.
Segments Covered in This Report
- By Product Type
- Allografts
- Synthetic Bone Grafts
- Demineralized Bone Matrix (DBM)
- Cell-based Matrices
- Xenografts
- By Material
- Calcium-phosphate ceramics
- Bioactive glass
- Polymer-based grafts
- Composite materials
- By Application
- Spinal Fusion
- Trauma & Craniomaxillofacial
- Joint Reconstruction
- Dental Bone Grafting
- Foot & Ankle
- Others
- By End User
- Hospitals
- Specialty Clinics
- Ambulatory Surgical Centers
- Dental Clinics
- By Geography
- North America
- United States
- Canada
- Mexico
- Europe
- Germany
- United Kingdom
- France
- Italy
- Spain
- Rest of Europe
- Asia-Pacific
- China
- India
- Japan
- South Korea
- Australia
- Rest of Asia-Pacific
- South America
- Brazil
- Argentina
- Rest of South America
- Middle East and Africa
- GCC
- South Africa
- Rest of Middle East and Africa
- North America
Data Sources, Market Sizing, and Validation
Desk Research
Desk research is used to build the first pass of the demand pool and to understand how procedure volumes and product mix are changing. We mainly used public healthcare statistics and clinical evidence to keep assumptions realistic, especially on where grafting is used and how usage differs by procedure type.
Sources referred to include, such as, the US CDC and National Center for Health Statistics for surgery trends, OECD health statistics for cross-country utilization signals, the US FDA database for product and regulatory classification context, and peer-reviewed orthopedic and dental journals for grafting patterns and outcomes. We also reviewed hospital and payer publications, trade association material, company filings and investor presentations, and reputable press coverage to track pricing direction and product mix shifts. For specific checks, we used paid subscriptions for company financials and intelligence, and patent databases to understand innovation intensity. These are illustrative sources only, and many other references were used for data collection, validation, and clarification.
Primary Interviews and Surveys
Primary work focused on validating where grafts are actually used, what products are preferred by indication, and how pricing moves with tendering and hospital procurement. We spoke with a mix of clinical users, distributors, procurement teams, and product specialists across major regions, so assumptions on penetration, typical units per procedure, and material mix could be corrected where desk data was not specific enough.
Distribution of primary research fieldwork respondents
| Company type | Respondent position | Region |
|---|---|---|
| Top tier: 37% | CXOs: 12% | APAC: 44% |
| Mid tier: 49% | Functional/Unit leaders: 32% | EMEA: 36% |
| Smaller Players: 14% | Managers: 56% | Americas: 20% |
Market-Sizing & Forecasting
Sizing starts with a top-down build where procedure volumes are reconstructed by country and mapped to grafting adoption in spine fusion, trauma and craniomaxillofacial, joint reconstruction, dental bone grafting, and foot and ankle. Those demand pools are then converted to value using mix-weighted pricing, adjusted by setting, because hospital pricing and dental clinic pricing tend to move differently.
To keep the totals practical, we use inputs such as annual orthopedic and dental procedure volumes, graft usage rates per procedure, mix shifts between allografts, demineralized bone matrix, synthetic grafts, xenografts, and cell-based matrices, and average selling price movement by material family. Where country data is thin, proxy ratios are applied using healthcare spend, surgeon density, and known adoption patterns discussed in interviews, then narrowed down during review.
For forecasting, we rely on scenario analysis supported by light multivariate regression on drivers like procedure growth, aging population signals, and trauma incidence, followed by expert checks on how fast synthetic and cell-based options can gain share. Selective bottom-up approximations, such as sampled ASP times estimated units by application and channel checks on distributor sales splits, are used to corroborate the top-down output and to adjust outliers.
Data Validation & Update Cycle
Validation is handled through a series of checks that compare model outputs with independent signals, including procedure trend lines, published clinical utilization ranges, and import-export patterns where relevant for specific materials. When a country or application line shows an unusual jump, it is flagged, assumptions are revisited, and interviews are re-opened with the most relevant respondent type before sign-off.
Each deliverable goes through multi-step analyst review, including cross-region consistency checks and currency conversion timing checks so year-to-year comparisons stay clean. The report is refreshed annually, and interim updates are made when material events occur, such as regulatory changes or major pricing shifts. Right before delivery, a final pass is completed so clients receive the latest updated view.
Mordor Intelligence's Bone Grafts and Substitutes Market Size Compared Against Other Published Estimates
Published market sizes for bone grafts and substitutes do not always match, mainly because the included product set and the definition of what counts as a substitute can change between studies. Differences also come from how procedure volumes are estimated, how pricing is averaged across hospital and dental channels, and whether the stated year is an actual measured year or a forward estimate.
In practice, the largest gaps usually show up when adjacent categories are folded in, such as broader orthopedic biomaterials or non-bone surgical biologics, and when adoption rates are assumed without cross-checking by application. Some sources also use faster ASP escalation or a longer forecast window to back-calculate a larger present-year value, and currency timing can further widen the spread, with a graft-by-application build that rechecks mix assumptions close to publication being the key difference applied by Mordor Intelligence.
Benchmark comparison
| Source | Market Size | Gaps in Research Methodology |
|---|---|---|
| Mordor Intelligence | USD 4.41 B (2026) | |
| Global Consultancy A | USD 3.79 B (2026) | Uses a narrower counted basket and appears to apply more conservative graft adoption per procedure, which can reduce the value in spine and trauma where grafting rates vary widely. |
| Industry Publisher B | USD 4.55 B (2026) | Focuses on substitutes only and may include higher-priced regenerative options more broadly, which can lift the blended ASP even when procedure volumes are similar. |
Overall, the spread is explained by what is included in the product basket and how usage per procedure is translated into value through pricing and mix. Our approach stays traceable because each major application is sized from procedure demand, then corrected using interview feedback on adoption and realistic ASP movement, which helps keep totals repeatable across countries.


Key Questions Answered in the Report
What is the projected value of the bone grafts and substitutes market by 2031?
Forecasts place the market at USD 5.75 billion by 2031, reflecting a 5.45% CAGR from 2026.
Which product type currently leads sales of bone graft substitutes?
Allografts lead with 42.10% share in 2025 due to surgeon familiarity and reliable osteoinductive performance.
Why are ambulatory surgical centers important to future demand?
ASCs are projected to grow orthopedic outpatient volumes 13% this decade, requiring grafts that support same-day discharge and streamlined handling.
Which region is expanding the fastest for bone graft substitutes?
Asia-Pacific shows the highest CAGR at 7.05% through 2031, driven by aging populations and widening healthcare access.
How are new technologies improving graft performance?
Nanoscale 3-D printing, bioactive glass innovation, and cell-based matrices enable patient-specific scaffolds with faster fusion and reduced complication risk.
Page last updated on:





