
Market Overview
| Study Period | 2020 - 2031 |
|---|---|
| Forecast Data Period | 2026 - 2031 |
| Historical Data Period | 2020 - 2024 |
| Market Size (2026) | USD 1.54 Billion |
| Market Size (2031) | USD 1.92 Billion |
| Growth Rate (2026 - 2031) | 4.52 % |
| Market Concentration | Medium |
Major Players *Disclaimer: Major Players sorted in no particular order Image © Mordor Intelligence. Reuse requires attribution under CC BY 4.0. | |

South Korea Dental Devices Market Analysis by Mordor Intelligence
The South Korea Dental Devices Market size is estimated at USD 1.54 billion in 2026, and is expected to reach USD 1.92 billion by 2031, at a CAGR of 4.52% during the forecast period (2026-2031).
Softer headline growth belies a structural pivot toward digitally enabled workflows, as intraoral scanners, CAD/CAM milling units, and chairside 3-D printers displace analog equipment across metro clinics. Fast-track approvals introduced by the Ministry of Food and Drug Safety in 2025 shorten time-to-market for AI-powered imaging platforms, while an aging population and high dentist density sustain procedure volumes despite tight household budgets. Domestic champions defend share through vertical integration, yet premium entrants leverage challenger brands and open-platform software to chip away at price-sensitive segments. Persistent reimbursement gaps, escalating compliance duties under phased UDI rules, and emerging sustainability mandates moderate overall momentum, forcing manufacturers to balance innovation with cost containment.
Key Report Takeaways
- By product category, General & Diagnostic Equipment led with 48.55% of the South Korea dental devices market share in 2025. Digital-Dentistry Systems are forecast to expand at a 12.25% CAGR to 2031.
- By treatment type, Implantology captured 35.53% revenue share in 2025. Prosthodontic procedures are advancing at an 8.85% CAGR through 2031.
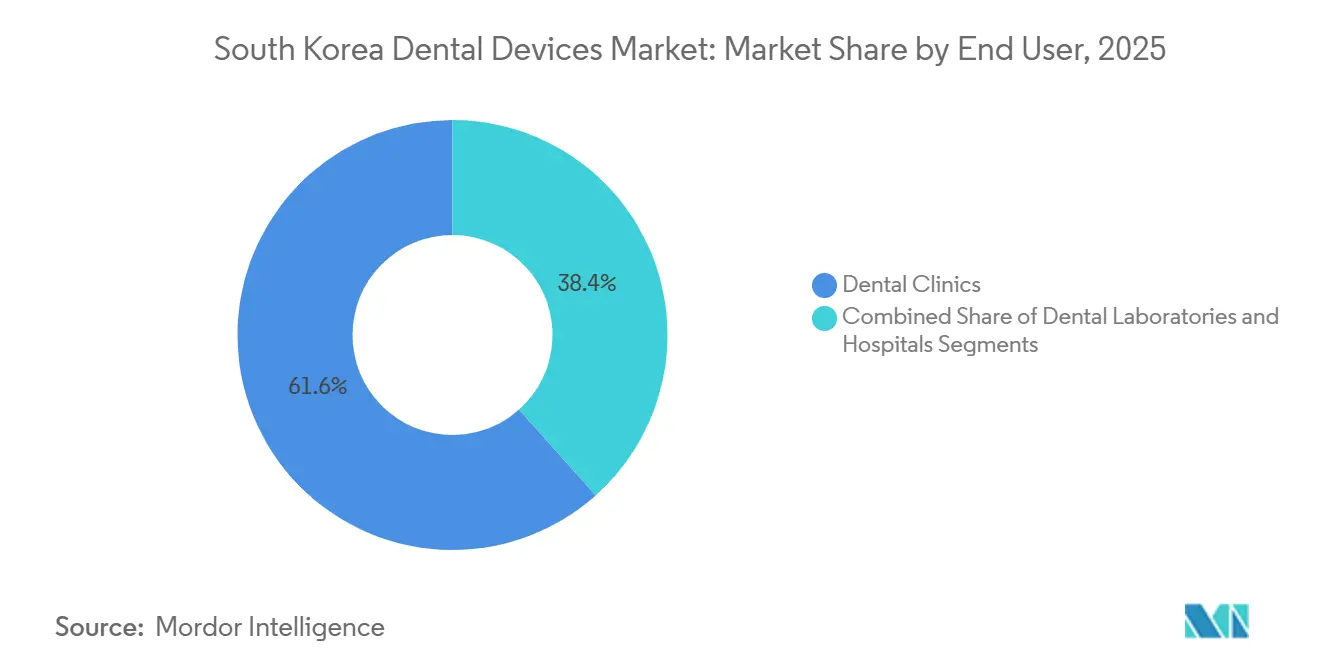
- By end user, Dental Clinics accounted for 61.63% of 2025 revenue. Dental Laboratories are projected to grow at a 9.87% CAGR through 2031.
Note: Market size and forecast figures in this report are generated using Mordor Intelligence’s proprietary estimation framework, updated with the latest available data and insights as of January 2026.
South Korea Dental Devices Market Trends and Insights
Drivers Impact Analysis*
| Driver | (~) % Impact on CAGR Forecast | Geographic Relevance | Impact Timeline |
|---|---|---|---|
| Government reforms streamlining MFDS approvals | +0.8% | National, focused in Seoul-Incheon biotech corridor | Short term (≤ 2 years) |
| High dentist density and cosmetic-dentistry boom | +0.7% | Nationwide, premium clusters in Gangnam, Seoul | Medium term (2–4 years) |
| Rapid adoption of digital dentistry | +1.2% | Nationwide, early uptake in metropolitan laboratories | Medium term (2–4 years) |
| Aging population and rising edentulism | +0.9% | National, acute in rural Gangwon and Jeolla | Long term (≥ 4 years) |
| AI-software reimbursement pilot | +0.4% | National, pilot sites in Seoul tertiary hospitals | Medium term (2–4 years) |
| Dental-tourism packages with K-beauty visas | +0.5% | Seoul, Busan, Jeju Island | Short term (≤ 2 years) |
| Source: Mordor Intelligence | |||
Government Reforms Streamlining MFDS Approvals
The April 2025 fast-track pathway trims review times by up to 40%, channeling AI imaging tools and next-generation implant surfaces into clinics sooner than legacy cycles allowed. Osstem Implant secured accelerated clearance for its AI implant-identification module in September 2025, enabling same-day revision planning and reinforcing domestic leadership. Third-party ISO/IEC 17025 labs now handle biocompatibility testing, clearing a backlog that delayed 18% of Class III submissions in 2023. The policy excludes Class IV devices, preserving rigorous oversight for life-sustaining implants. Early beneficiaries translate speed-to-approval into shorter payback periods on R&D, sharpening competitive cycles inside the South Korea dental devices market.
High Dentist Density & Cosmetic-Dentistry Boom
With one dentist per 1,800 residents in 2024, competition fuels service differentiation through cosmetic offerings, particularly clear aligners and veneers. Medit’s partnership with Graphy integrates shape-memory thermoplastics, cutting aligner fabrication time to five days and catering to patients who value discretion and speed over cost.[1]Medit Corp., “Medit i900 Intraoral Scanner,” meditlink.com. Gangnam’s 12% share of clinics delivered USD 180 million in aesthetic revenue in 2024, yet unmet restorative need among seniors dwarfs elective demand, creating parallel growth paths inside the South Korea dental devices market.
Rapid Adoption of Digital Dentistry
Government R&D grants totaling USD 70 million in 2023 seeded roughly 400 dental 3-D-printing start-ups, accelerating open-architecture workflows nationwide. Medit’s i900 scanner priced at USD 18,000 undercuts incumbents and achieved 15% penetration within nine months, while Arum Dentistry’s 5-axis milling units deliver zirconia crowns in 12 minutes, elevating chairside economics. ISO/TC 261 hosted its additive-manufacturing summit in Seoul in 2023, confirming Korea’s bid to shape global standards and reinforcing the digital trajectory powering the South Korea dental devices market.
Aging Population & Rising Edentulism
Seniors now constitute 20.6% of citizens and will approach 46.4% by 2070, pushing complete tooth loss to 12.6% and partial loss to 62.3% among elders. This demographic drives implant-supported overdentures that blend stability with affordability, explaining an 8.85% prosthodontic CAGR against a broader South Korea dental devices market CAGR of 4.52%. Clinics respond by bundling same-day crown workflows that cut visit counts for mobility-challenged patients.
Restraints Impact Analysis*
| Restraint | (~) % Impact on CAGR Forecast | Geographic Relevance | Impact Timeline |
|---|---|---|---|
| High out-of-pocket costs and NHIS gaps | -0.6% | National, acute in rural provinces | Long term (≥ 4 years) |
| Stringent MFDS post-market surveillance & UDI | -0.3% | Nationwide, heavier on SMEs | Medium term (2–4 years) |
| Single-use-plastic sustainability rules | -0.2% | National, early enforcement in Seoul | Medium term (2–4 years) |
| Shortage of CAD/CAM-skilled technicians | -0.3% | National, severe in Daegu-Gyeongbuk laboratory hub | Short term (≤ 2 years) |
| Source: Mordor Intelligence | |||
High Out-of-Pocket Costs & NHIS Coverage Gaps
NHIS caps implant reimbursement for seniors at two units for life with 30% co-pays, leaves cosmetic and adult orthodontics uncovered, and reimburses dentures at 70% - policies that pushed 24.5% of adults to delay care in 2023. Rural incomes trail Seoul by 35%, and travel distances exceed 50 km for specialist visits, widening access disparities. A proposal to expand coverage to three implants and lower co-pays to 20% has stalled until at least 2027 amid funding shortfalls. Persistent gaps temper volume growth inside the South Korea dental devices market.
Stringent MFDS Post-Market Surveillance & UDI Rules
Phased GS1 barcode mandates require Class IV devices to comply from 2024, cascading to Class I by 2027, with compliance costs reaching USD 150,000 for midsized firms[2]Korea Medical Device Industry Association, “SME Compliance Costs,” kmdia.or.kr. Adverse-event reports must be filed within 15 days, and implant makers must track devices for their lifespan, adding data-management overhead that disproportionately hits the SME cohort responsible for 78% of manufacturers. Compliance delays already postponed Neobiotech product launches by six months, tightening development cycles in the South Korea dental devices market.
*Our forecasts treat driver/restraint impacts as directional, not additive. The impact forecasts reflect baseline growth, mix effects, and variable interactions.
Segment Analysis
By Product: Digital Systems Accelerate While Legacy Platforms Plateau
General & Diagnostic Equipment accounted for 48.55% of 2025 revenue but is growing below 5% as replacement cycles stretch to 10–12 years. Within this mature bracket, panoramic X-ray and CBCT upgrades hinge on AI-software compatibility rather than outright hardware swaps, a nuance that moderates the South Korea dental devices market size allocated to capital equipment. Dental consumables remain resilient, buoyed by Osstem’s 22% domestic implant hold, yet premium titanium-surface treatments and custom abutment systems command healthy margins.
Digital-Dentistry Systems are expanding at a 12.25% CAGR to 2031, far outpacing overall sector growth, and now represent the strategic battleground shaping the South Korea dental devices market. Medit’s open-STL i900 scanner cut entry costs to USD 18,000, while Arum’s 5-axis mills deliver chairside zirconia in 12 minutes, compressing lab turnarounds by 65%. ISO 13485 accreditation streamlines EU and U.S. exports, signaling global ambitions for Korean digital device makers and bolstering the South Korea dental devices market share commanded by the country’s tech-leaning cohort.




By Treatment: Prosthodontics Gains Momentum Over Implantology
Implantology held a 35.53% revenue share in 2025, locking in its status as the largest treatment category within the South Korea dental devices market. Straumann’s challenger brands, priced 30% below flagship lines, seek to erode domestic incumbents’ hold on value-oriented clinics, while Osstem’s tie-ups with ZimVie preserve export corridors into China and the Middle East.
Prosthodontic workflows are advancing at an 8.85% CAGR, buoyed by chairside crown fabrication and implant-supported overdentures that blend stability with cost efficiency. The South Korea dental devices market size attributed to prosthodontics is projected to expand faster than orthodontics, reflecting seniors’ preference for functional restoration over aesthetic alignment. Medit’s SmartX All-on-X protocol slashes full-arch delivery to 48 hours, creating crossover synergies that sustain premium pricing while reducing patient visit counts, a critical advantage for mobility-limited elders.
By End User: Laboratories Race Ahead in Digital Transformation
Dental Clinics generated 61.63% of 2025 revenue and remain the core revenue engine in the South Korea dental devices market. However, capital-intensive digital tools and technician shortages propel outsourcing, funneling growth toward laboratories that already post a 9.87% CAGR through 2031.
Laboratories embrace 24-hour milling centers and ISO 13485 certification to capture export orders, lifting the South Korea dental devices market size for lab-bound equipment and materials. Hospitals, although the smallest end-user slice, pioneer integrated digital ecosystems such as Dentsply Sirona’s DS Core at Seoul National University Dental Hospital, validating technology that later diffuses into high-volume clinics.
Geography Analysis
Seoul, Busan, and the Osong Bio-Health Science Complex form an innovation triangle housing 65% of manufacturing and 80% of R&D, anchoring the South Korea dental devices market. Gangnam alone hosts 12% of cosmetic clinics and generated USD 180 million aesthetic revenue in 2024, while Busan’s Haeundae leverages cruise-terminal access to capture 40% of dental-tourism cases. Subsidized access to 5-axis CNC mills and ISO 17025 labs inside cluster accelerators lowers start-up barriers and sustains local device pipelines.
Rural Gangwon, Jeolla, and Gyeongsang provinces lag urban centers in both income and clinic density, forcing cost-sensitive patients to favor removable dentures over implants. NHIS data reveal seniors in these regions are 2.3 times likelier to choose dentures, reshaping regional procedure mix and highlighting latent demand that balanced reimbursement could unlock.
Internationally, Korea exported USD 520 million in dental devices in 2023, mainly to Vietnam, Indonesia, and Thailand, while importing USD 380 million of premium implants, CAD/CAM suites, and infection-control consumables. Osstem’s 2025 training center in Abu Dhabi signals an export-plus-education strategy to secure downstream consumables revenue, whereas the Chungbuk Free Economic Zone lures multinationals with tax holidays and expedited permits, enriching the South Korea dental devices market with foreign expertise.
Regulatory Landscape
Dental devices in South Korea are governed primarily under the Medical Devices Act and administered by the Ministry of Food and Drug Safety (MFDS), with pathway requirements differentiated by risk class. In practice, Class I and II devices are typically handled through certification bodies such as the National Institute of Medical Device Safety Information (NIDS) or the Medical Device Information and Technology Assistance Center (MDITAC). Class III and IV products require MFDS approval, which raises the evidence and review burden for implant systems and advanced imaging platforms.
In early 2026, MFDS Notice 2026-6 revised the Regulation on Medical Device Approval, Notification, and Review to better align with IMDRF expectations, including updates to classification rules and more formalized pre-submission review mechanics. MFDS also published updated Medical Device GMP regulations in February 2026 covering general devices, IVDs, and digital medical devices, tightening quality-system expectations for both domestic manufacturers and importers. In March 2026, Administrative Notice 2026-167 opened additional amendments for public comment, including expanded recognition of real-world evidence for clinical data and removal of notarization requirements for non-English translations, which reduces administrative friction for foreign documentation while keeping post-market surveillance and traceability requirements in focus.
Competitive Landscape
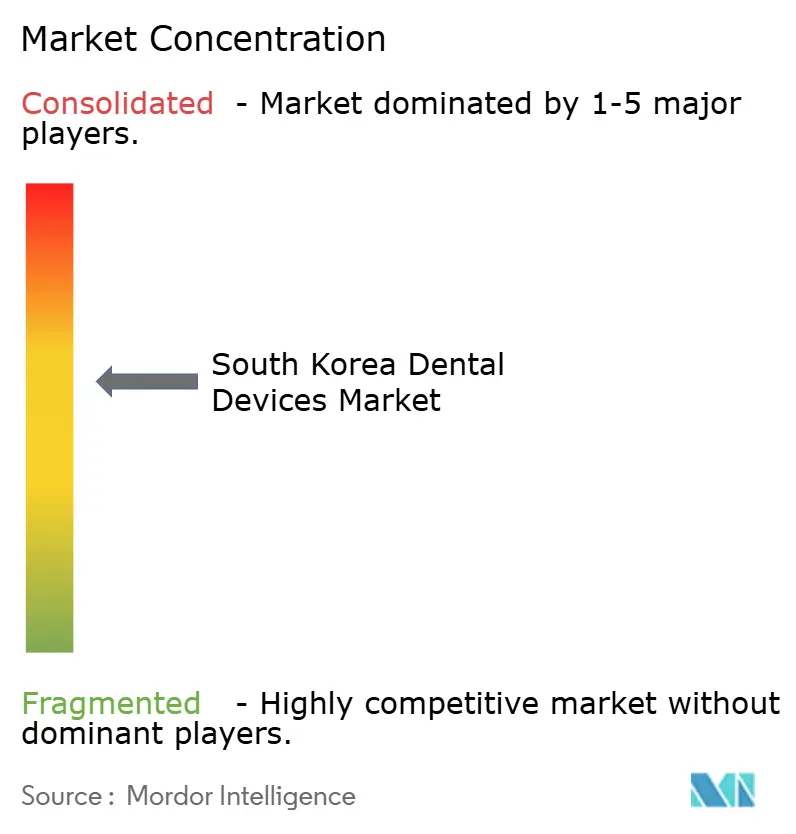
The South Korea dental devices market is moderately concentrated: the top players, Osstem Implant Co. Ltd, DIO Corp., Dentium, Straumann Group, and Dentsply Sirona, command significant share. Osstem’s vertical integration from titanium machining to surface treatment secures 38% gross margins, while Straumann’s multi-tier pricing uses Neodent and Anthogyr to target clinics purchasing fewer than 50 implants annually.
Technology openness shapes rivalry. Medit’s STL-export strategy has seized 15% of the scanner segment in only 18 months, pushing closed-loop incumbents to decouple hardware and software licensing. Neobiotech leverages 51 patents on patient-specific titanium membranes, commanding 40% price premiums and demonstrating a pivot from cost competition to IP-led value.
Emerging disruptors include Graphy’s shape-memory aligner resin and Vuno’s AI radiograph reader, both cleared under MFDS fast-track rules and poised to capitalize once NHIS finalizes AI reimbursement in 2027. Compliance with ISO 13485 and MFDS UDI mandates adds fixed costs that favor scale players, nudging SMEs toward niche biologics, resins, and design software layers inside the South Korea dental devices market.
South Korea Dental Devices Industry Leaders
Osstem Implant Co. Ltd
DIO Corp.
Dentium
Straumann Group
Dentsply Sirona
- *Disclaimer: Major Players sorted in no particular order

Market Opportunities and Future Outlook
Digital dentistry creates a clear whitespace for manufacturers and service providers that can package intraoral scanning, CAD/CAM, 3-D printing, and software into clinic-ready workflows, especially as the market pivots toward AI-enabled imaging and treatment planning. Dentech-Asia, held in May 2026 at Seoul National Universitys Siheung Campus Bio Hub, centered on digital dentistry and AI partnerships, pointing to active collaboration channels between clinics, academia, and technology suppliers. For vendors, this supports interoperable-platform opportunities (open file formats, cloud case management, and AI decision support), along with training and service models that help address technician capability gaps.
Capacity build-outs and export-oriented manufacturing footprints are also changing the competitive set for implants and restorative consumables. In July 2026, Shinheung MST signed an agreement to invest KRW 102.3 billion in a new Wonju plant to lift monthly implant capacity from 50,000 sets to 1 million sets, expanding domestic sourcing headroom and intensifying price and availability competition. Korean implant makers are simultaneously expanding production capacity in China, including DIOs plan for full operation of its Sichuan plant in 2026, reflecting how procurement dynamics such as Chinas volume-based purchasing encourage localization while maintaining access to large overseas implant markets.
Recent Industry Developments
- July 2026: Shinheung MST signed an agreement to invest KRW 102.3 billion in a new Wonju plant aimed at scaling implant output. The planned ramp raises monthly production capacity from 50,000 sets to 1 million sets, lifting domestic supply headroom. This expansion increases competitive pressure on implant pricing and delivery lead times for clinics and distributors in South Korea.
- December 2025: Leaders Dental Laboratory opened a 300-pyeong digital production facility to increase throughput for complex prosthetics serving both domestic and export demand. The added capacity supports higher utilization of CAD/CAM and digital case workflows across laboratories. It also strengthens labs bargaining position as clinics outsource more work amid technician constraints and faster-turnaround expectations.
- August 2025: Medit unveiled the i900 Mobility intraoral scanner, adding battery-powered wireless capture to streamline chairside scanning. The product move supports more flexible operatory workflows and reduces setup constraints for high-volume clinics. Greater scanner convenience reinforces adoption of digital restorative pathways that pull demand through to CAD/CAM, 3-D printing, and compatible software ecosystems.


Research Methodology Framework and Report Scope
Market Definition and Coverage
This market includes dental instruments, equipment, and consumables sold for use in South Korea across dental clinics, hospitals, and dental laboratories, covering both routine diagnosis and treatment needs, as well as newer digital dentistry workflows.
Scope exclusions: We exclude purely cosmetic non-dental products, non-medical retail items, and services revenue from dental procedures that is billed by providers.
Segmentation Overview
- By Product
- General & Diagnostic Equipment
- Dental Lasers
- Radiology Equipment
- Dental Chairs & Units
- Other Diagnostic Equipment
- Dental Consumables
- Dental Biomaterials
- Dental Implants
- Crowns & Bridges
- Other Consumables
- Digital-Dentistry Systems
- Intra-oral Scanners
- CAD/CAM Milling Units
- 3-D Printers & Resins
- General & Diagnostic Equipment
- By Treatment
- Implantology
- Orthodontic
- Endodontic
- Periodontic
- Prosthodontic
- By End User
- Hospitals
- Dental Clinics
- Dental Laboratories
Data Sources, Market Sizing, and Validation
Desk Research
Desk research was used to anchor the model with consistent public signals on demand, procedure volumes, and technology adoption in South Korea, then to cross-check the direction of pricing and category mix. We typically refer to sources such as the Korea Statistical Information Service (KOSIS), Korea Customs Service trade statistics, the Ministry of Food and Drug Safety (MFDS) public notices and device listings, and OECD health statistics for a broader oral health and spending baseline.
On top of that, we reviewed manufacturer and distributor disclosures such as annual reports, investor presentations, and product catalogs, along with publications from dental associations and reputable news coverage. This helped track how quickly clinics are adopting chairside digitization and how implant demand has been moving over the study period. For calibration, paid subscriptions were used selectively for company financials and intelligence, patent lookups, and shipment-level import-export checks when publicly reported totals were not granular enough. These desk sources are not exhaustive, and many other public materials were also used for data collection, validation, and clarification during the study.
Primary Interviews and Surveys
Primary work focused on validating what is actually being purchased and installed in South Korea, and how buying patterns shift between consumables, capital equipment, and digital systems. We spoke with a mix of manufacturers, importers, distributors, dental lab operators, and clinic procurement contacts. We then re-checked replacement cycles, utilization rates, and typical price bands across the country using those inputs.
Distribution of primary research fieldwork respondents
| Company type | Respondent position |
|---|---|
| Top tier: 31% | CXOs: 14% |
| Mid tier: 54% | Functional/Unit leaders: 35% |
| Smaller Players: 15% | Managers: 51% |
Market-Sizing & Forecasting
Sizing was built using a top-down and bottom-up combined logic, where national demand is reconstructed from treatment activity and equipment adoption, and then checked against supplier-side signals. For the top-down track, we translated procedure and chairside activity into demand pools for core categories, then applied realistic penetration for digital workflows and implantology to arrive at value by year.
A few inputs that shaped the model (illustrative) were the installed base of dental chairs and imaging units, replacement cycles for capital equipment, typical consumables usage per procedure, the mix shift toward CAD/CAM and intraoral scanning, and import reliance seen through customs flows for key device groups. Where bottom-up data was incomplete, we filled gaps using sampled average selling prices multiplied by estimated unit volumes from channel checks, and then adjusted totals only when the two views did not reconcile.
For forecasting, scenario analysis was used so growth could be flexed based on how fast clinics upgrade to digital systems, how implant demand trends, and how pricing moves with currency timing and procurement behavior. Assumptions were kept simple and were re-tested during expert calls so the forward curve stayed practical and explainable.
Data Validation & Update Cycle
Outputs were validated through multiple checks so one data point did not drive the final number. We compared the model to independent signals like trade movement, category adoption in clinics and labs, and the implied equipment replacement pace. When variances were large, we investigated the drivers before sign-off.
A second analyst review was completed to confirm scope alignment and math consistency. We then performed targeted re-contacts when outliers appeared or when a key assumption shifted. Reports are refreshed annually, and interim updates are made when material events change the expected demand or pricing environment. Before delivery, the latest public updates are reviewed again so clients receive the most current view that we can support.
Mordor Intelligence's South Korea Dental Devices Market Sizing Compared With Other Published Estimates
Published market values for dental devices in South Korea often differ because the scope lines are drawn differently, and because analysts use different ways to convert demand signals into revenue. Differences also show up when one estimate emphasizes a faster digital shift, while another stays closer to historical replacement cycles.
The main gap comes from whether digital dentistry systems and related materials are counted as part of dental devices. Mordor Intelligence treats items like intraoral scanners and chairside CAD/CAM as in-scope only when they are purchased for clinical or lab dental use, and it does not blend in broader medical imaging or general 3D printing revenue.
Benchmark comparison
| Source | Market Size | Gaps in Research Methodology |
|---|---|---|
| Mordor Intelligence | USD 1.54 B (2026) | |
| Industry Publisher A | USD 0.71 B (2025) | Uses an earlier base year window and appears to apply a narrower revenue basket, with more conservative inclusion of capital equipment and a different timing for price conversion, which can pull the near-term value down. |
| Syndicated Source B | USD 1.41 B (2024) | Anchors the total to a shorter forecast frame and may weight consumables and clinic spend differently, which changes the implied device-to-service split and affects how fast digital categories scale in the model. |
Across the three figures, the spread is mostly explained by what is counted inside the device basket and how quickly the digital mix is assumed to grow, along with year timing. By keeping the scope tied to dental-use equipment, consumables, and digital systems, and then cross-checking the totals against trade signals and real purchasing behavior, the estimate stays traceable to clear inputs and repeatable steps.


Key Questions Answered in the Report
What is the current value of the South Korea dental devices market?
The market was valued at USD 1.54 billion in 2026 and is projected to reach USD 1.92 billion by 2031.
Which product segment is growing fastest in South Korea?
Digital-Dentistry Systems, including intraoral scanners and 3-D printers, are forecast to grow at a 12.25% CAGR through 2031.
How significant is implantology in procedure revenue?
Implantology held 35.53% of treatment revenue in 2025, making it the largest single treatment category.
What reimbursement gaps affect patient access?
NHIS caps seniors to two subsidized implants in a lifetime and excludes adult orthodontics and cosmetic veneers, resulting in 24.5% of adults delaying care due to cost.
Which regions attract most dental tourists?
Seoul's Gangnam district and Busan's Haeundae area together host 80% of clinics serving inbound dental tourists, supported by streamlined M-Visa processing.
How will AI tools impact Korean dental practices?
MFDS-cleared AI imaging software awaits NHIS reimbursement, but a pilot starting in 2027 could double adoption to 60% of practices by 2030 if cost-saving targets are met.
Page last updated on:


 Your data is secure and never sold or shared.


