Dental Articulators Market Size and Share
Market Overview
| Study Period | 2019 - 2030 |
|---|---|
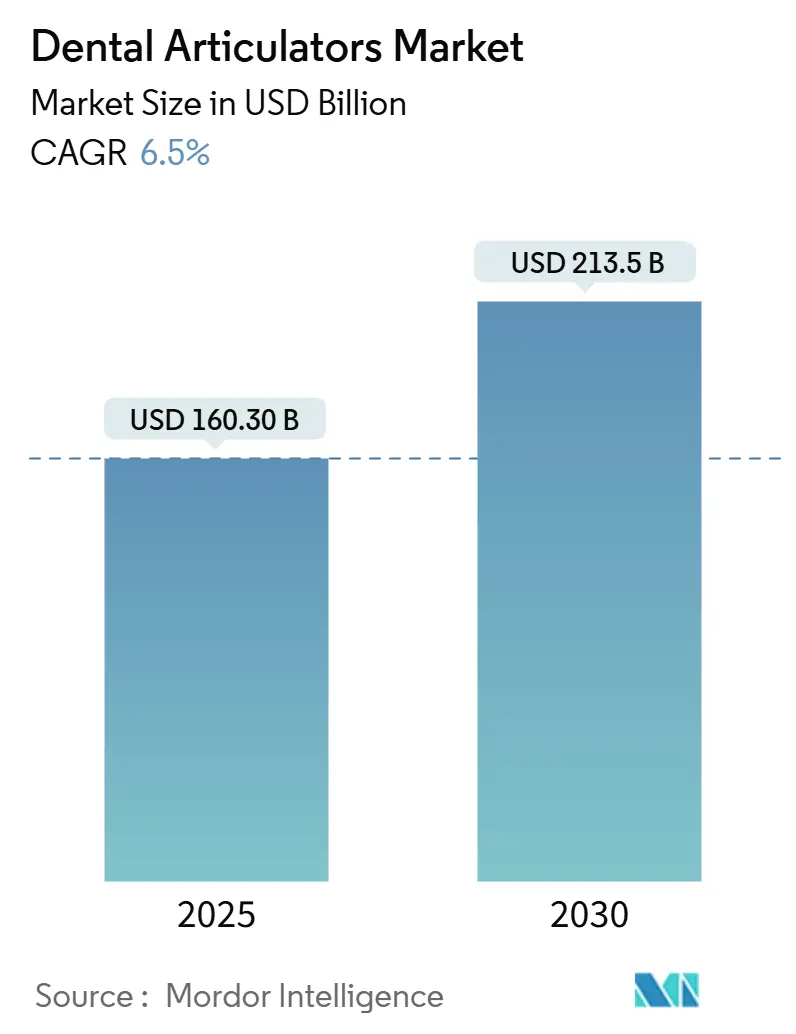
| Market Size (2025) | USD 160.30 Billion |
| Market Size (2030) | USD 213.5 Billion |
| Growth Rate (2025 - 2030) | 6.50% CAGR |
| Fastest Growing Market | Asia Pacific |
| Largest Market | North America |
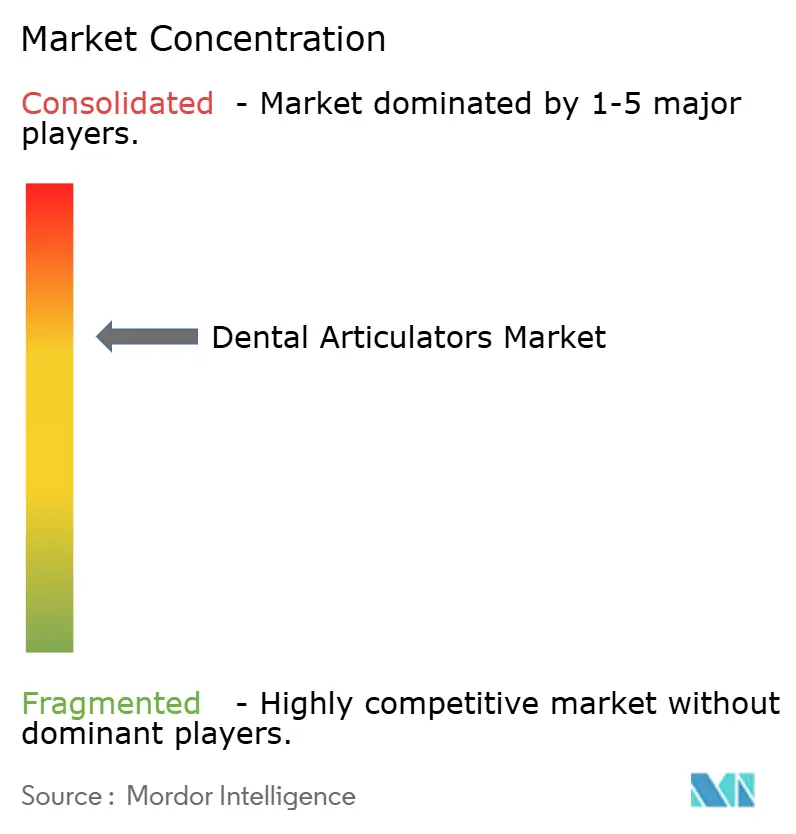
| Market Concentration | Medium |
Major Players *Disclaimer: Major Players sorted in no particular order Image © Mordor Intelligence. Reuse requires attribution under CC BY 4.0. | |
Dental Articulators Market Analysis by Mordor Intelligence
The dental articulators market size stands at USD 160.3 million in 2025 and is forecast to reach USD 213.5 million by 2030, advancing at a 6.5% CAGR over the period. Steady demand originates from an aging patient base that requires complex prosthodontic rehabilitation, while laboratories accelerate their pivot to fully digital workflows that link articulators to CAD/CAM and virtual‐patient modules. Laboratories also benefit from aluminum and polymer innovations that lighten devices without sacrificing stability, further encouraging capital upgrades. Regulatory clarity around ISO calibration standards and the FDA’s Class I classification lowers entry barriers for emergent suppliers, though premium pricing and supply-chain uncertainty for precision alloys temper adoption in cost-sensitive clinics. Competitive intensity rises as incumbents embed software hooks that keep users inside proprietary ecosystems, while digital-native start-ups court laboratories with open-architecture alternatives. Together, these forces underpin a healthy but measured expansion path for the dental articulators market.
Key Report Takeaways
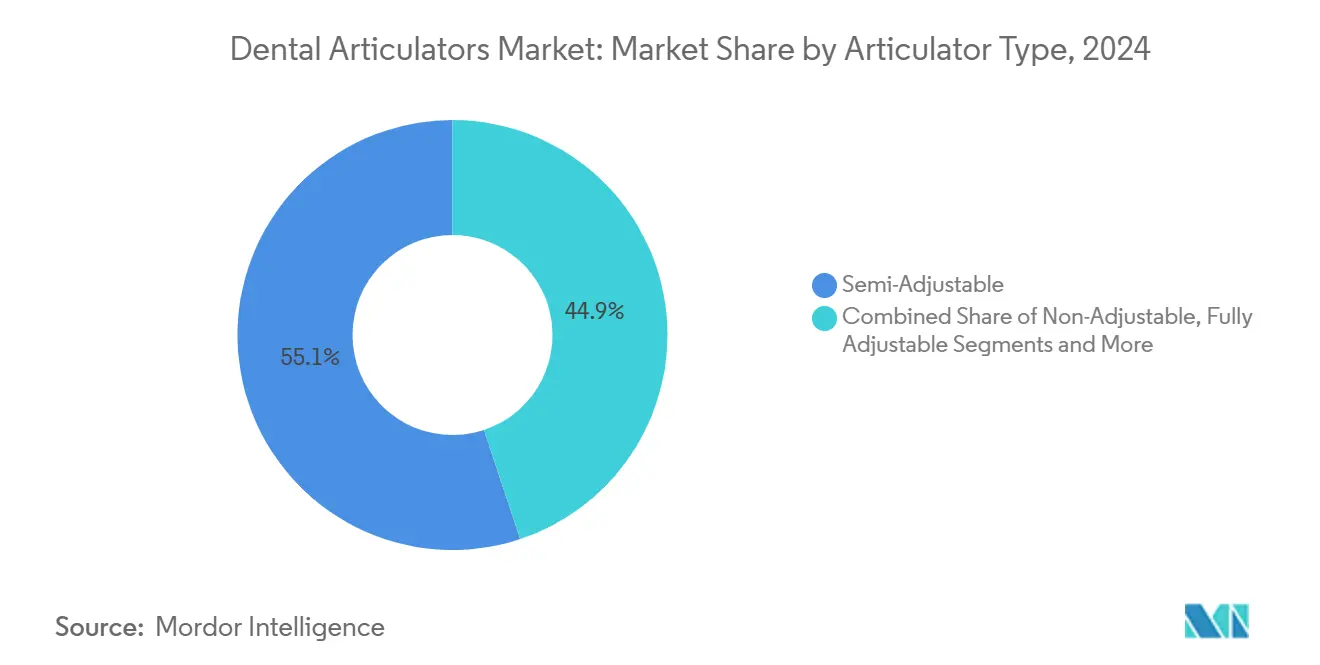
- By articulator type, semi-adjustable systems led with 55.1% revenue share in 2024; virtual/digital platforms are projected to expand at an 11.5% CAGR through 2030.
- By material, aluminum-based frames accounted for 46.3% of the dental articulators market size in 2024, whereas resin/polymer constructions are set to grow at a 9.8% CAGR over the forecast horizon.
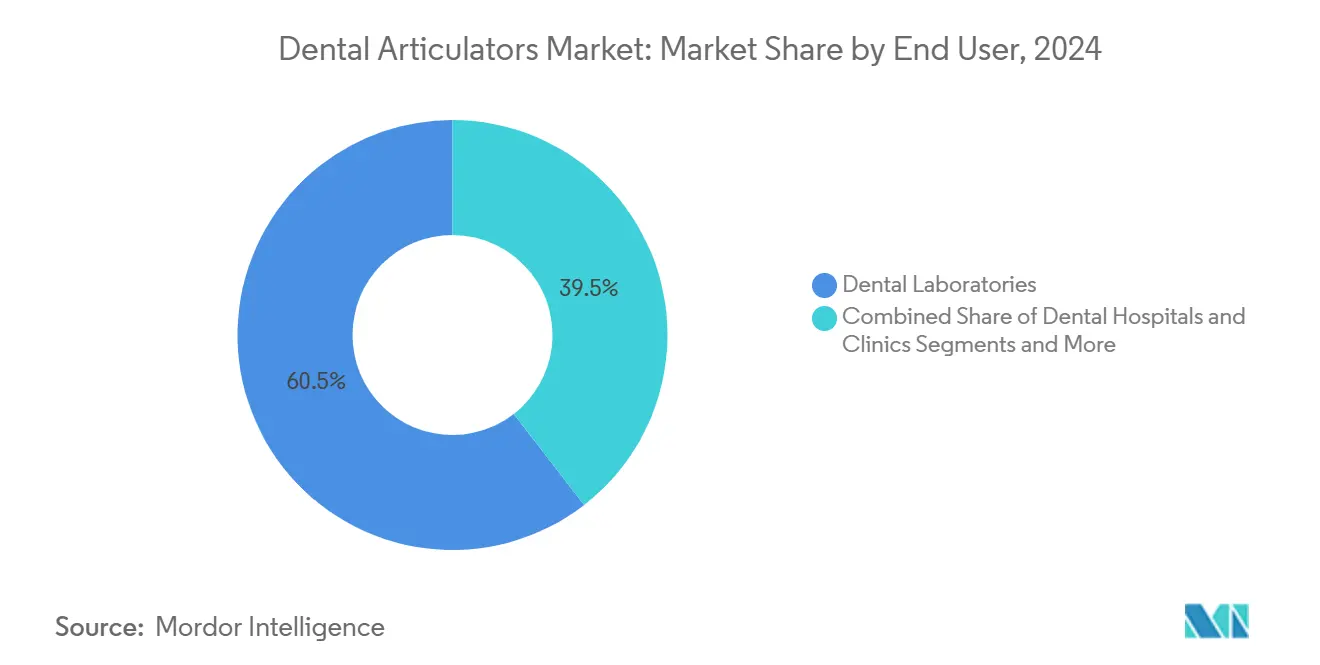
- By end user, dental laboratories captured 60.5% of revenue in 2024; academic and research institutes record the highest projected CAGR at 8.6% through 2030.
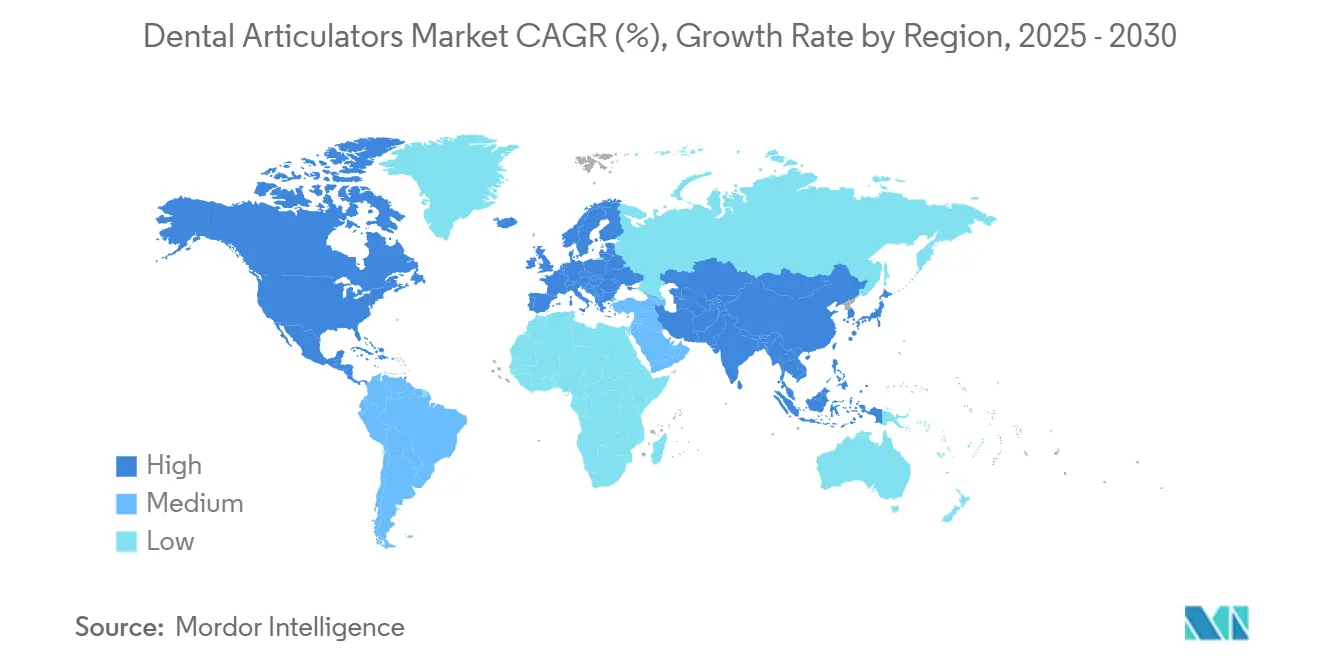
- By geography, Europe controlled 35.8% of 2024 sales; Asia-Pacific is tracking the fastest regional CAGR at 7.1% to 2030.
Global Dental Articulators Market Trends and Insights
Drivers Impact Analysis*
| Driver | (~) % Impact on CAGR Forecast | Geographic Relevance | Impact Timeline |
|---|---|---|---|
| Aging population driving prosthodontic procedures | +1.80% | Global—North America & Europe focus | Long term (≥ 4 years) |
| Rapid CAD/CAM adoption accelerating demand for digital articulators | +1.20% | Global—APAC & North America lead | Medium term (2-4 years) |
| Expansion of dental laboratory outsourcing in Asia & LatAm | +0.90% | APAC core; Latin America spill-over | Medium term (2-4 years) |
| Increasing dental school intake & simulation-based curricula | +0.70% | Global—emerging markets surge | Long term (≥ 4 years) |
| 3-D printed, patient-specific articulator components | +0.60% | North America & EU; APAC emerging | Short term (≤ 2 years) |
| New calibration regulations for lab equipment | +0.30% | Global—jurisdiction dependent | Medium term (2-4 years) |
| Source: Mordor Intelligence | |||
Aging Population Driving Prosthodontic Procedures
A growing cohort of adults aged 65 and older undergoes full-arch restorations and complex fixed denture work at far higher rates than younger patients, ensuring a durable baseline of case volume for the dental articulators market.[1]Digital Dentistry and Technology, American Dental Association, ada.org Longer life expectancy amplifies the cumulative number of prostheses each individual will require, while patient preference for fixed over removable solutions raises precision demands on articulators. Clinics, therefore, gravitate toward semi-adjustable or fully adjustable devices that replicate condylar pathways more faithfully than basic hinge models. Government-funded oral-health programs in Europe subsidize geriatric care, sustaining capital budgets for high-specification equipment. Collectively, these demographic and policy trends elevate unit demand and encourage upgrades to more sophisticated systems, cementing long-run growth prospects for the dental articulators market.
Rapid CAD/CAM Adoption Accelerating Demand for Digital Articulators
Dental laboratories integrate intraoral scanners, design engines, and chairside mills to compress turnaround times, yet these workflows must still align digital jaw simulations with reality. Virtual articulators embed within CAD modules, letting technicians toggle occlusal parameters on-screen rather than manually adjusting analog knobs. File-to-mill accuracy rises and remake rates fall, producing a clear ROI that offsets software licensing costs. Early adopters in North America report 15% throughput gains once physical mounting steps are eliminated, prompting competitive labs in Europe and APAC to follow suit. Equipment suppliers bundle scanners, design suites, and articulator software under subscription models, deepening customer lock-in while accelerating unit sales of complementary hardware. The virtuous circle between digital dentistry and the dental articulators market speeds revenue growth above historical mechanical averages.
Expansion of Dental Laboratory Outsourcing in Asia & Latin America
High labor expenses in the United States, Canada, and Western Europe motivate clinics to route crown and bridge work to partners in China, India, and Mexico, where technician wages are 30-70% lower.[2]Threat of Limited U.S. Access to Critical Raw Materials, Department of Homeland Security, dhs.gov To maintain quality across oceans, outsourcing hubs standardize on cost-efficient yet robust semi-adjustable articulators that ensure consistent mounting protocols. Freight consolidation advantages further favor lightweight aluminum frames that minimize shipping costs. OEMs respond with bulk-discount programs tied to multi-unit orders, deepening penetration in regional production clusters. Latin American labs leverage bilingual support from U.S. distributors to secure FDA-cleared devices, reinforcing cross-border supply chains and enlarging the addressable base of the dental articulators market.
Increasing Dental School Intake & Simulation-Based Curricula
Emerging economies expand dental school capacity to correct practitioner shortages, increasing first-year enrollment by between 6% and 12% annually in India, Vietnam, and Brazil. Modern pedagogy mandates pre-clinical mastery of occlusal analysis on articulators before students treat live patients. Consequently, faculties purchase ruggedized units that tolerate intensive daily handling while retaining calibration. Global accreditation bodies prescribe a minimum articulator-to-student ratio, effectively institutionalizing baseline demand. Manufacturers cultivate relationships through discounted academic pricing and train-the-trainer workshops, betting that brand familiarity in school will translate into loyalty once graduates open private practices. This educational flywheel steadily enlarges future buyer pools for the dental articulators market.
Restraints Impact Analysis*
| Restraint | (~) % Impact on CAGR Forecast | Geographic Relevance | Impact Timeline |
|---|---|---|---|
| High acquisition & maintenance cost of premium articulators | -0.80% | Global—price-sensitive markets | Short term (≤ 2 years) |
| Shift toward intra-oral scanners and virtual articulation | -1.10% | North America & EU; global diffusion | Medium term (2-4 years) |
| Supply-chain volatility for precision aluminum alloys | -0.60% | Global—manufacturing hubs | Short term (≤ 2 years) |
| Non-standard digital data formats hindering interoperability | -0.40% | Global—digitally advanced markets | Medium term (2-4 years) |
| Source: Mordor Intelligence | |||
High Acquisition & Maintenance Cost of Premium Articulators
Fully adjustable mechanical systems command list prices between USD 10,000 and USD 25,000, a capital hurdle that forces small labs to extend depreciation cycles beyond recommended intervals. Annual recalibration and component wear escalate the total cost of ownership, diverting funds from other digital priorities like scanners and chairside mills. Clinics in emerging markets often settle for entry-level hinge devices, constraining addressable demand for high-margin models. OEM financing options ease adoption yet lengthen payback periods, creating caution among owners in cash-constrained environments. Until manufacturing efficiencies lower sticker prices, cost will remain the dominant brake on the dental articulators market.
Shift Toward Intra-Oral Scanners and Virtual Articulation
Advanced scanners capture jaw relations directly, feeding cloud-based engines that approximate condylar paths without physical articulators.[3]Evaluation and comparison of the accuracy of three intraoral scanners, Journal of Prosthetic Dentistry, thejpd.org Progressive practices integrate fully digital restorative loops that leapfrog analog hardware, particularly for single-unit crowns and inlays. Mechanical devices thus risk relegation to complex multi-unit cases, shrinking their share of overall lab workflows. Suppliers counter by embedding VR-ready interfaces that marry physical frames to software, but the convenience of 100% virtual methods gains mindshare. This substitution effect clips incremental volumes and nudges the dental articulators market toward a bifurcated future of niche precision hardware and mainstream software licenses.
*Our forecasts treat driver/restraint impacts as directional, not additive. The impact forecasts reflect baseline growth, mix effects, and variable interactions.
Segment Analysis
By Articulator Type: Digital Innovation Challenges Mechanical Dominance
Semi-adjustable units anchored 55.1% of 2024 revenue, reflecting their unbeatable cost-to-function ratio for everyday crown, bridge, and partial denture work. This cohort of devices offers adjustable condylar inclination and Bennett angle settings adequate for most restorative scenarios, allowing mid-size laboratories to handle diverse case mixes without specialty upgrades. Non-adjustable hinge variants still circulate in pre-clinical training suites and low-volume clinics, though their simplicity restricts broader use. Fully adjustable articulators attract elite prosthodontic centers handling full-mouth rehabilitation and mandibular dysfunction cases that demand patient-level fidelity.
Virtual platforms are reshaping adoption curves by posting an 11.5% CAGR that far outpaces hardware averages. These cloud-linked engines import intraoral scans, layer muscle vectors onto CT data, and simulate occlusion across dynamic chewing cycles, then export milling directives straight to five-axis units. Europe and Japan favor hybrid models in which a physical frame mirrors the digital state for chairside verification, while U.S. laboratories increasingly trust screen-only analysis. As file interoperability improves, virtual penetration is expected to chip away at mechanical unit growth but also enlarge total user counts by making advanced articulation affordable via subscription. The interplay keeps the dental articulators market contested between reliability and digital convenience.


By Material: Aluminum Dominance Faces Polymer Innovation
Aluminum frames captured 46.3% of 2024 sales thanks to their unbeatable rigidity-to-weight ratio, resistance to corrosion, and thermal neutrality that preserves calibration in variable laboratory climates. CNC milling of aircraft-grade blocks produces micrometer accuracy in condylar tracks, giving anodized aluminum systems lifespan ratings exceeding 10 years without major drift. Yet casting and finishing costs rise in tandem with global energy tariffs, prompting OEMs to explore recyclable alloys and lean billet geometries.
Polymer and resin builds post a breakneck 9.8% CAGR as additive manufacturing matures. Stereolithography allows nested production of yoke assemblies, condylar housings, and incisal pins in a single print run, shrinking lead times from weeks to hours. Custom color coding eases case identification in high-throughput labs, while lattice infills cut mass by up to 50%. Early doubts around wear resistance fade as carbon-fiber-reinforced blends achieve modulus numbers rivaling metals. Stainless steel maintains a foothold where maximum durability trumps weight, especially in teaching clinics that endure daily student misuse, while titanium finds limited use in research prototypes investigating implant-borne prosthesis dynamics. Overall, material diversification widens buyer choice and adds elasticity to the dental articulators market.
By End User: Laboratory Dominance Meets Educational Growth
Dental laboratories consumed 60.5% of articulator shipments in 2024 because every fixed prosthesis demands accurate mounting before milling or pressing. Consolidation within the laboratory sector concentrates purchases among multi-site networks that negotiate volume discounts and favor vendors capable of integrating articulators into end-to-end digital systems. These groups implement centralized quality assurance protocols that standardize on a single articulator family, inflating repeat orders for compatible accessories such as mounting plates and face-bow adapters.
Universities and research institutes, clocking an 8.6% CAGR, leverage public grants and philanthropic funds to modernize simulation clinics. Each first-year cohort now requires personal bench setups for pandemic-era distancing, triggering bulk procurements. Faculty also employ virtual articulator modules to teach occlusal principles via immersive VR, complementing but not replacing physical devices. Hospital-based dental departments maintain steady renewal cycles for in-house laboratories that tackle complex oncology and trauma reconstructions, but many defer larger investments by outsourcing commodity crowns to low-cost regional labs. This mosaic of user profiles propagates varied buying criteria, yet all funnel demand back into the dental articulators market.
Geography Analysis
Europe retained leadership with a 35.8% revenue share in 2024, propelled by universal health insurance systems that reimburse advanced prosthodontic interventions and by strict EN ISO 7787 standards that elevate premium device uptake. Germany anchors regional sales through extensive laboratory chains that pioneer digital articulation, while France and Scandinavia champion aluminum–polymer hybrids to reduce repetitive strain injuries among technicians. The region’s robust network of postgraduate prosthodontic programs also guarantees recurring orders as each new intake receives upgraded bench sets. Economic uncertainties tied to energy costs and Brexit-related customs paperwork create procurement delays but have not derailed the expansion path of the dental articulators market in Europe.
Asia-Pacific logs the fastest trajectory at a 7.1% CAGR, underwritten by rising household purchasing power, government subsidies for dental tourism, and large-scale laboratory outsourcing hubs in Shenzhen, Bengaluru, and Ho Chi Minh City. China’s public–private vocational colleges mandate articulator proficiency, swelling unit demand, while India capitalizes on English-language compatibility to capture North American outsourcing flows. Price sensitivity remains higher than in OECD markets, nudging buyers toward semi-adjustable aluminum units or emerging polymer frames. Yet as local manufacturers climb the quality ladder, premium-grade offerings become attainable without hefty import tariffs, thereby enlarging the overall dental articulators market size in the region.
North America sits on mature but stable ground, buoyed by insurance-backed restorative volumes and aggressive adoption of full-digital workflows. Laboratories cross-sell virtual articulator subscriptions with scanner leases, generating recurring revenue streams. However, small U.S. practices face reimbursement compression that limits large equipment outlays, causing an uptick in refurbished sales. Latin America experiences uneven growth owing to currency volatility, but dental tourism corridors in Mexico and Costa Rica inject fresh capital into laboratory infrastructure, ensuring periodic surges in demand. Together, these geographic patterns reveal a multipolar expansion narrative for the dental articulators market.

Competitive Landscape
The competitive arena exhibits medium fragmentation: the top five producers command about 55% of global revenue, leaving ample headroom for regional specialists and software-first challengers. Amann Girrbach leverages vertical integration by bundling articulators with proprietary CAM and sintering ovens, capturing laboratories that value single-vendor accountability. KaVo Kerr concentrates on ergonomic refinements—magnesium-alloy levers and quick-release face-bows—that shave set-up minutes and appeal to high-volume practices. Whip Mix cultivates the academic channel through discounted faculty packs and lifetime service guarantees, reinforcing repeat orders as graduates enter private practice.
Digital-native entrants exploit cloud architectures to decouple physical ownership from usage, offering per-case pricing that democratizes advanced articulation for small clinics. Software-hardware alliances flourish: Exocad integrates printable articulator stubs into its DentalCAD 3.1 suite, while Formlabs validates resin profiles that meet indirect food-contact regulations. Materials suppliers such as Carpenter Technology co-develop low-burr machinable aluminum grades targeting micro-articulation scrolls, driving cooperative innovation upstream.
Corporate maneuvering intensifies as distributors merge with solution providers to offer cradle-to-chairside packages. Patterson Companies’ USD 4.1 billion acquisition by Patient Square Capital expands logistics muscle, promising faster spares delivery across North America and the UK. Henry Schein’s stake in Large Practice Sales bolsters consultative selling, positioning it to guide multi-location groups through digital conversions. The race now hinges on ecosystem completeness rather than stand-alone device specs, steering the future revenue mix of the dental articulators market toward subscription and service layers.
Dental Articulators Industry Leaders
Amann Girrbach AG
Whip Mix Corporation
KaVo Kerr (Envista)
SAM Präzisionstechnik GmbH
Ivoclar Vivadent AG
- *Disclaimer: Major Players sorted in no particular order

Recent Industry Developments
- February 2025: Patient Square Capital closed the USD 4.1 billion buyout of Patterson Companies, enhancing supply-chain reach for articulators in North America and the UK.
- July 2024: The FDA issued draft 510(k) guidances for composite resins and curing lights, streamlining submissions for ancillary restorative devices.
- March 2024: 3Shape rolled out AI-enhanced Automate services, achieving 94% acceptance on custom crown designs, reinforcing digital articulation accuracy.


Global Dental Articulators Market Report Scope
| Non-Adjustable |
| Semi-Adjustable |
| Fully Adjustable |
| Aluminium-based |
| Stainless Steel |
| Resin / Polymer |
| Titanium |
| Dental Laboratories |
| Dental Hospitals & Clinics |
| Academic & Research Institutes |
| North America | United States |
| Canada | |
| Mexico | |
| Europe | Germany |
| United Kingdom | |
| France | |
| Italy | |
| Spain | |
| Rest of Europe | |
| Asia Pacific | China |
| Japan | |
| India | |
| South Korea | |
| Australia | |
| Rest of Asia Pacific | |
| Middle East & Africa | GCC |
| South Africa | |
| Rest of Middle East & Africa | |
| South America | Brazil |
| Argentina | |
| Rest of South America |
| By Articulator Type | Non-Adjustable | |
| Semi-Adjustable | ||
| Fully Adjustable | ||
| By Material | Aluminium-based | |
| Stainless Steel | ||
| Resin / Polymer | ||
| Titanium | ||
| By End User | Dental Laboratories | |
| Dental Hospitals & Clinics | ||
| Academic & Research Institutes | ||
| By Geography | North America | United States |
| Canada | ||
| Mexico | ||
| Europe | Germany | |
| United Kingdom | ||
| France | ||
| Italy | ||
| Spain | ||
| Rest of Europe | ||
| Asia Pacific | China | |
| Japan | ||
| India | ||
| South Korea | ||
| Australia | ||
| Rest of Asia Pacific | ||
| Middle East & Africa | GCC | |
| South Africa | ||
| Rest of Middle East & Africa | ||
| South America | Brazil | |
| Argentina | ||
| Rest of South America | ||


Key Questions Answered in the Report
How large is the dental articulators market in 2025?
It is valued at USD 160.3 million and is projected to reach USD 213.5 million by 2030.
Which articulator type generates the most revenue?
Semi-adjustable systems lead with 55.1% of global sales in 2024.
What segment grows the fastest?
Virtual/digital articulators post an 11.5% CAGR through 2030.
Why is Asia-Pacific expanding so quickly?
Rising healthcare spending, dental tourism, and outsourcing hubs lift regional demand at a 7.1% CAGR.
How do 3-D printed components affect articulators?
Additive manufacturing enables lighter, patient-specific parts that shorten set-up times and improve customization.
What limits broader adoption of premium articulators?
High purchase and maintenance costs, along with competition from virtual solutions, constrain uptake in budget-sensitive settings.
Page last updated on:


