Market Overview
| Study Period | 2021 - 2031 |
|---|---|
| Forecast Data Period | 2026 - 2031 |
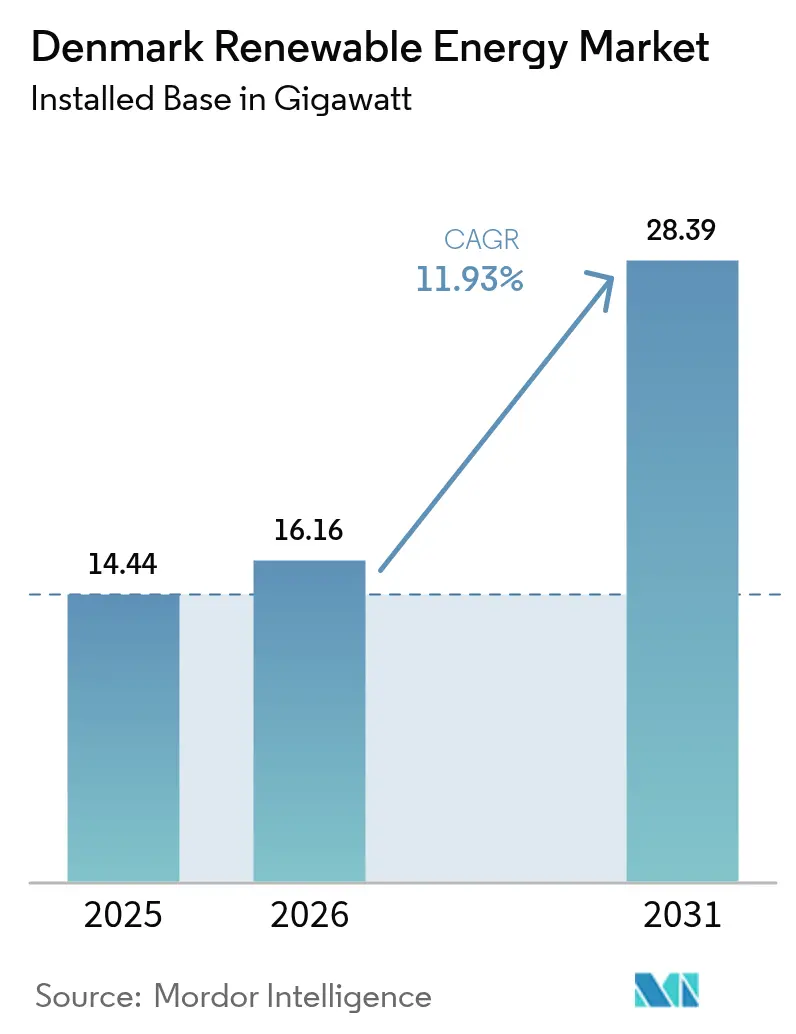
| Base Year Market Size (2025) | 14.44 gigawatt |
| Market Volume (2026) | 16.16 gigawatt |
| Market Volume (2031) | 28.39 gigawatt |
| Growth Rate (2026 - 2031) | 11.93% CAGR |
| Market Concentration | Medium |
Major Players *Disclaimer: Major Players sorted in no particular order Image © Mordor Intelligence. Reuse requires attribution under CC BY 4.0. | |
Denmark Renewable Energy Market Analysis by Mordor Intelligence
Denmark Renewable Energy Market size in 2026 is estimated at 16.16 gigawatt, growing from 2025 value of 14.44 gigawatt with 2031 projections showing 28.39 gigawatt, growing at 11.93% CAGR over 2026-2031.
The Danish renewable energy market is benefiting from binding climate law milestones that accelerate offshore wind auctions, hydrogen subsidies, and corporate power purchase agreements. A legally mandated 70% reduction in greenhouse gases by 2030, compared to 1990, underpins steady demand for utility-scale projects, even when wholesale prices fluctuate. Simultaneously, the energy-island program channels DKK 210 billion (approximately USD 30 billion) into Bornholm and North Sea hubs, providing Denmark with a renewable energy market momentum that offsets the maturation of legacy wind farms. Corporate buyers, particularly data-center operators, now sign hourly-matched PPAs that stimulate hybrid solar–wind projects and battery storage. Finally, green-bond listings in Copenhagen narrow developers’ funding costs by 20–30 basis points, adding financial depth to the Denmark renewable energy market.
Key Report Takeaways
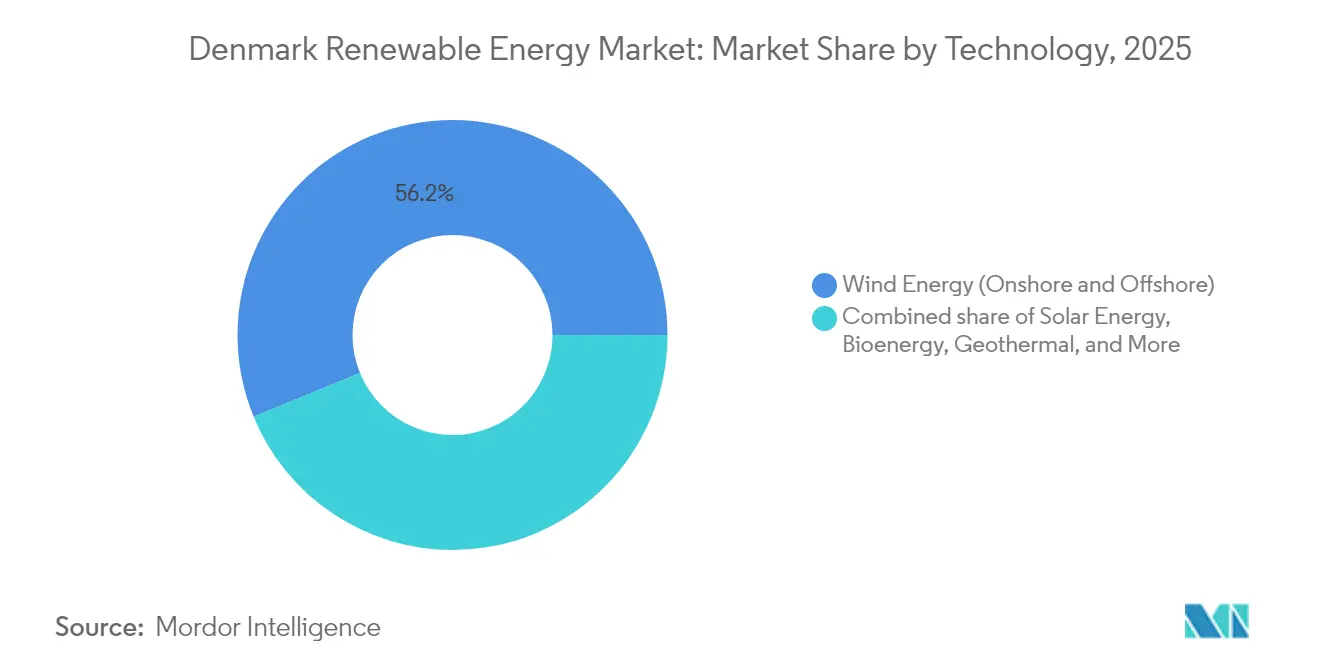
- By technology, wind energy commanded 56.20% of Denmark's renewable energy market share in 2025; geothermal capacity is forecast to expand at a 47.52% CAGR through 2031.
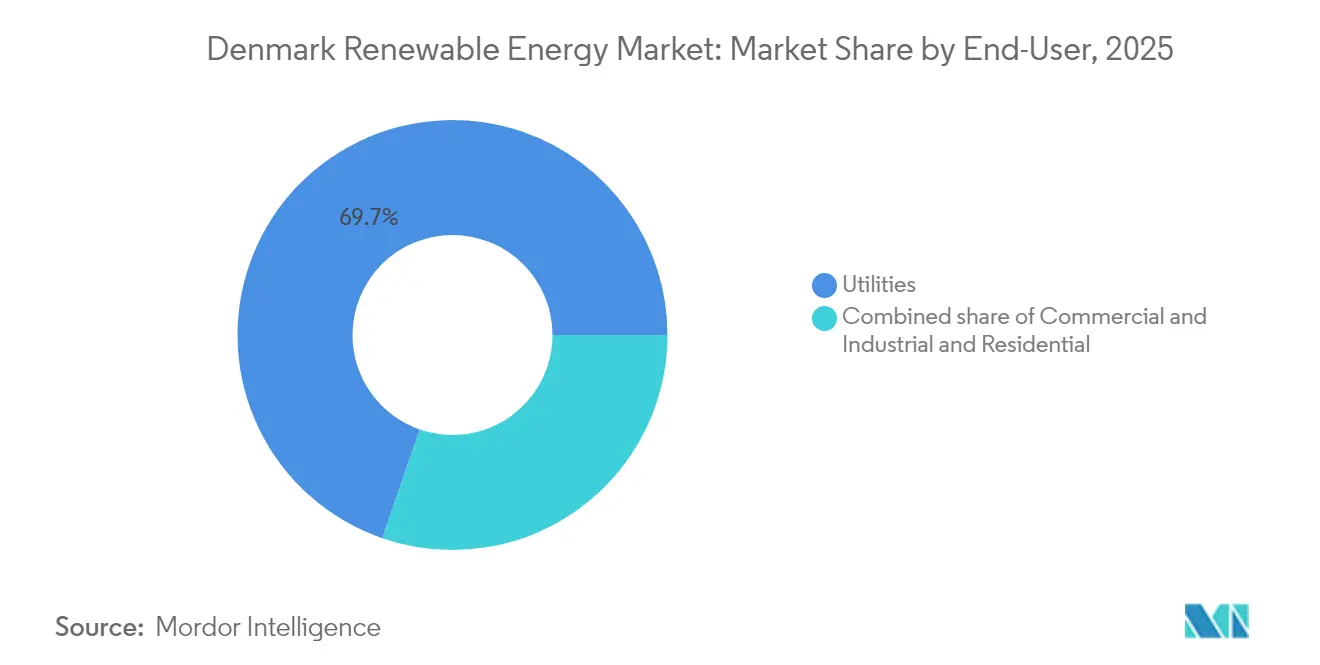
- By end user, utilities held 69.70% of Denmark's renewable energy market share in 2025, while the commercial and industrial segment is projected to grow at a 14.44% CAGR to 2031.
- Offshore wind, led by Ørsted, Copenhagen Infrastructure Partners, and Vattenfall, captured over 70.00% of the pipeline capacity in 2025.
- Ørsted, Vestas, and Copenhagen Infrastructure Partners collectively issued EUR 3.95 billion of green bonds in 2024, demonstrating strong investor demand.
Note: Market size and forecast figures in this report are generated using Mordor Intelligence’s proprietary estimation framework, updated with the latest available data and insights as of 2026.
Denmark Renewable Energy Market Trends and Insights
Drivers Impact Analysis*
| Driver | (~) % Impact on CAGR Forecast | Geographic Relevance | Impact Timeline |
|---|---|---|---|
| National 70% GHG-reduction target accelerates build-out | 2.8% | National, with offshore concentration in North Sea and Baltic zones | Medium term (2-4 years) |
| Energy-island and offshore-hub programme | 3.2% | Bornholm (Baltic), North Sea hub west of Jutland | Long term (≥4 years) |
| Power-to-X hydrogen pipeline bankability | 1.9% | Esbjerg, Fredericia industrial clusters; export corridors to Germany | Medium term (2-4 years) |
| Corporate solar and wind PPAs from data-centre cluster | 1.5% | Greater Copenhagen, Fredericia; spillover to Aarhus metro | Short term (≤2 years) |
| EU-ETS price uplift boosting biomass co-firing economics | 0.9% | National, legacy coal-plant sites (Avedøre, Studstrup) | Short term (≤2 years) |
| Green-bond capital inflows via Copenhagen listing rules | 1.4% | National, with global institutional allocations | Medium term (2-4 years) |
| Source: Mordor Intelligence | |||
National 70% GHG-Reduction Target Accelerates Build-out
The Climate Act of 2020 locks in a 70% emissions reduction mandate by 2030, pushing developers to add 8 GW of new capacity in six years. The Denmark renewable energy market gains predictability as annual compliance reviews trigger subsidy tweaks rather than policy U-turns. Sector coupling deepens the addressable load because megawatts must serve electrolysers, heat pumps, and EV chargers, increasing the marginal value of each project. Offshore wind is allocated 4.5 GW of the 2024–2030 build plan, while 1.7 GW is allocated to hybrid projects that combine wind, solar, and battery storage. Ørsted raised EUR 1.75 billion in a May 2024 green bond, signaling financiers’ confidence that statutory goals will not be diluted.[1]Ørsted, “Green Bond Prospectus,” orsted.com
Energy-Island & Offshore-Hub Programme
The Bornholm and North Sea islands amount to Denmark’s largest energy infrastructure since the Great Belt link, with 6 GW slated for completion in 2030 and modular expansion to 10 GW by 2040.[2]Danish Energy Agency, “Energy Islands Overview,” ens.dk EU Innovation Fund grants of EUR 645 million enable the construction of subsea HVDC cables to Germany and Poland, allowing for the export of surplus power while importing balancing electricity. The islands serve as grid stability anchors by clustering synchronous condensers and battery farms offshore, thereby trimming system balancing costs by 12% compared to dispersed projects. Copenhagen Infrastructure Partners committed EUR 2.3 billion to Bornholm in 2024, underlining how de-risked the scheme has become. The Denmark renewable energy market, therefore, sees the islands not only as generation assets but as modular nodes for hydrogen production and data-center colocation.
Power-to-X Hydrogen Pipeline Bankability
Denmark aims to install 4 to 6 GW of electrolysers by 2030, aligning its green hydrogen exports with Germany’s pipeline rollout. The first tender, awarded in late 2023, was valued at DKK 1.25 billion and included projects such as European Energy’s 150 MW Padborg and H2 Energy’s 1 GW Esbjerg sites. Bankability depends on sub-EUR 3 per-kg delivered hydrogen, a hurdle narrowed by Denmark’s electricity-tax exemption through 2030.[3]Danish Tax Agency, “Hydrogen Exemption 2024,” skat.dk Early evidence comes from Nature Energy’s 20 MW Holstebro plant, which produces synthetic methane. As regulation clarifies EU hydrogen certification, the Denmark renewable energy market converts policy momentum into multi-gigawatt demand for renewable electrons.
Corporate Solar & Wind PPAs from Data-center Cluster
Hyperscale operators signed more than 1 GW of renewable PPAs since 2023, led by Microsoft’s 180.6 MW hourly-matched contract with European Energy. Meta’s Odense facility now sources 730 MW through direct-wire wind farms. These corporate deals diverge from legacy PPAs: they stipulate hourly matching, impose curtailment penalties, and span 15 years. The Danish Energy Agency forecasts that data-center electricity use will climb to 8.8 TWh by 2030, securing a stable demand floor for the Danish renewable energy market. Developers thus find a creditworthy alternative to utilities, lowering merchant-price risk.
Restraints Impact Analysis*
| Restraint | (~) % Impact on CAGR Forecast | Geographic Relevance | Impact Timeline |
|---|---|---|---|
| Grid congestion and curtailment risk | -1.8% | Western Denmark (Jutland), high wind-penetration zones | Short term (≤2 years) |
| Lengthy permitting for onshore repowering | -1.2% | National, acute in coastal municipalities | Medium term (2-4 years) |
| Skilled-labour bottlenecks inflating EPC costs | -0.9% | National, offshore vessel constraints in North Sea | Short term (≤2 years) |
| Biomass sustainability-criteria uncertainty | -0.6% | National, legacy coal-plant conversion sites | Medium term (2-4 years) |
| Source: Mordor Intelligence | |||
Grid Congestion & Curtailment Risk
Western Denmark curtailed 1.4 TWh of wind output in 2023, 40% more than in 2022, largely because the 400 kV backbone cannot export surplus power from Jutland to Zealand.[4]Energinet, “Investment Plan 2024,” energinet.dk Energinet is investing DKK 40 billion through 2030 in a 600 MW Jutland–Funen link, a 1,200 MW subsea cable to Germany, and onshore upgrades. Until these assets go live, curtailment will reduce revenue for projects in high-penetration zones and deter corporate PPA buyers who are sensitive to volume penalties. Dynamic-access pilots that allow for 20% overplanting in exchange for higher curtailment may unlock 800 MW of extra capacity by 2027; however, developers still price congestion risk into bids, tempering the near-term growth of the Denmark renewable energy market.
Lengthy Permitting for Onshore Repowering
Repowering 2 MW legacy turbines with 5 MW machines promises a 30% efficiency gain, yet environmental assessments and municipal vetoes extend the timelines to three years.[5]Danish Energy Agency, “Permitting Statistics 2024,” ens.dk Coastal municipalities blocked 15% of repowering bids since 2022 despite national targets. Noise-setback rules require four times the tip height distance, disqualifying many mature sites. A 2024 fast-track scheme helps projects that reduce turbine counts while increasing capacity, but exclusion zones around Natura 2000 areas cover 18% of Danish land. Consequently, about 600 MW of repowering that could have been online by 2026 remains in limbo, nudging investment toward offshore wind and slowing the Denmark renewable energy market.
*Our forecasts treat driver/restraint impacts as directional, not additive. The impact forecasts reflect baseline growth, mix effects, and variable interactions.
Segment Analysis
By Technology: Offshore Wind Anchors, Geothermal Surges From Niche Base
Wind energy contributed 56.20% of the installed capacity and retained the largest share of the Danish renewable energy market in 2025, thanks to flagship offshore assets such as Horns Rev 3 and Kriegers Flak. Upcoming energy-island tenders will add 6 GW, while onshore repowering replaces vintage machines with 5 MW-class units powered by Vestas V236 turbines. These upgrades reduce levelized costs by 18%, further strengthening the Danish renewable energy market. Geothermal’s footprint was under 50 MW in 2024; yet, the segment is set to climb at a 47.52% CAGR through 2031 as Copenhagen and Aarhus integrate subsurface heat into their district-heating networks. Solar PV growth stems from corporate rooftops and utility parks linked to hyperscale PPAs, while bioenergy fills dispatchable gaps despite RED III sustainability scrutiny. Ocean energy remains pre-commercial, but wave-power pilots off Hanstholm may scale after 2030.
A maturing turbine supply chain and HVDC rollout underpin the Denmark renewable energy market size for offshore projects, while rooftop solar growth helps keep urban emissions in check. Bioenergy’s share could shrink if forest-biomass audits disqualify pellets, yet biogas injections from agricultural waste offer a low-carbon bridge. Overall, diversified technologies mitigate intermittency and position the Denmark renewable energy market for stable expansion even amid changing policy incentives.


By End-User: Utilities Dominate, C&I Segment Accelerates on Data-Center Demand
Utilities absorbed 69.70% of total electricity from renewables in 2025, a dominance reflecting their historical role as wholesale buyers and grid operators. However, the commercial-and-industrial segment is projected to advance at 14.44% CAGR, outpacing the overall Denmark renewable energy industry and reshaping offtake patterns. Hyperscale data-center PPAs illustrate the shift: Microsoft's 180.6 MW contract or Meta's 730 MW direct-wire supply bypasses utilities, offering developers bankable 15-year revenue streams. Residential rooftop uptake is slower because net-metering credits are valued at wholesale rates, limiting the payback appeal. Community solar pools, pioneered by Better Energy, allow households to co-own utility-scale arrays, incrementally widening participation.
Utilities will remain the largest single customer base, but their share of Denmark's renewable energy market is expected to decline as corporate contracts capture a larger share of new capacity. The resulting competitive landscape pushes utilities toward hybrid projects with batteries, while corporates push for hourly-matched guarantees, collectively broadening the Denmark renewable energy market.
Geography Analysis
Western Denmark hosts 62.00% of the installed wind capacity, leveraging North Sea resources that deliver a 50% capacity factor. However, the region also suffers the bulk of curtailment due to east-west transmission limits. Energinet’s multi-billion-dollar grid reinforcement will eventually funnel Jutland’s excess generation to Zealand’s load centers, thereby expanding the Danish renewable energy market. Bornholm is evolving into a Baltic offshore hub, with its 3 GW energy island securing EU funding and HVDC backbones to Germany and Poland, facilitating cross-border power trade. The Greater Copenhagen and Fredericia corridors exhibit the fastest C&I uptake, as hyperscale data centers consumed 2.1 TWh in 2024 and are projected to reach 8.8 TWh by 2030, underscoring their strategic importance.
Southern Denmark, around Esbjerg, is the Power-to-X nucleus; electrolysers here will convert wind surpluses into hydrogen, which will be shipped to German industry. Municipal vetoes constrain onshore wind in coastal areas, yet a 2024 fast-track law attempts to bypass stalemates when turbine counts fall but megawattage rises. Denmark’s HVDC ties with Sweden, Germany, and Norway reduce domestic balancing costs, allowing the Denmark renewable energy market to export wind surplus and import Nordic hydro when calm conditions prevail. Collectively, diversified regional roles knit a balanced national portfolio that can scale toward 2030 objectives.
Competitive Landscape
Three players, Ørsted, Copenhagen Infrastructure Partners, and Vattenfall, control over 70% of offshore pipeline capacity, giving the Denmark renewable energy market a moderately concentrated offshore tier. Onshore wind and solar are more fragmented; Better Energy, European Energy, and NRGi Renewables pursue projects with sub-EUR 200 million budgets, financed on three-year payback horizons. Ørsted’s vertical integration into hydrogen, as illustrated by its stake in the 1 GW Esbjerg Power-to-X project, captures molecule premiums in addition to electrons. Copenhagen Infrastructure Partners’ EUR 12 billion CI V fund earmarks 30% for hydrogen infrastructure, mirroring this pivot. Turbine OEMs Vestas and Siemens Gamesa wield negotiating leverage by bundling 15-year service contracts, stabilizing their margins.
Battery-storage integrators, notably HOFOR Vind and Andel Energi, fill gaps in intermittency unaddressed by incumbents due to utility ownership limits in liberalized markets. Patent filings on floating foundations and wave-energy converters suggest early-stage competition for deeper waters where fixed-bottom turbines are expensive. The Danish renewable energy market, therefore, features a tiered structure: capital-intensive offshore clusters dominated by a few giants, and nimble onshore solar niches populated by mid-sized developers that chase C&I PPAs.
Denmark Renewable Energy Industry Leaders
Vestas Wind Systems A/S
Orsted A/S
Arcon-Sunmark A/S
Vattenfall A/S
Better Energy A/S
- *Disclaimer: Major Players sorted in no particular order


Recent Industry Developments
- May 2025: Ørsted paused its Hornsea 4 UK offshore wind project, citing higher capital costs and supply chain risks, potentially redistributing resources to its Danish assets.
- May 2025: Denmark has relaunched a 3 GW offshore wind tender with two-sided Contracts for Difference (CfDs) to address the failure of the December 2024 auction round, which received no bids. The new tender, expected in autumn 2025, will offer more attractive terms, including state subsidies, to incentivize developer participation.
- March 2025: Copenhagen Infrastructure Partners (CIP) has achieved financial close on an onshore wind project, reinforcing its commitment to expanding its domestic portfolio in a specific region. This project, likely involving a partnership with a local developer, marks a significant step in CIP's strategy to invest in greenfield energy infrastructure projects.
- March 2025: RWE has awarded Global Wind Service (GWS) a contract for the installation of secondary structures on the monopile foundations at the Thor offshore wind farm in Denmark.


Denmark Renewable Energy Market Report Scope
The Danish renewable energy market report includes:
By Technology
| Solar Energy (PV and CSP) |
| Wind Energy (Onshore and Offshore) |
| Hydropower (Small, Large, PSH) |
| Bioenergy |
| Geothermal |
| Ocean Energy (Tidal and Wave) |
By End-User
| Utilities |
| Commercial and Industrial |
| Residential |
| By Technology | Solar Energy (PV and CSP) |
| Wind Energy (Onshore and Offshore) | |
| Hydropower (Small, Large, PSH) | |
| Bioenergy | |
| Geothermal | |
| Ocean Energy (Tidal and Wave) | |
| By End-User | Utilities |
| Commercial and Industrial | |
| Residential |


Key Questions Answered in the Report
What capacity target does Denmark plan to achieve by 2031?
The country plans to expand operational renewables from 14.44 GW in 2025 to 28.39 GW by 2031, reflecting a 11.93% CAGR.
Which technology currently leads electricity generation?
Offshore and onshore wind together supplied 56.20% of 2025 capacity and will remain the anchor as energy-island projects add 6 GW.
How fast is corporate renewable procurement growing?
Commercial-and-industrial demand is forecast to rise at a 14.44% CAGR to 2031, driven by data-center PPAs that already exceed 1 GW.
What is the main restraint facing new wind projects?
Grid congestion in western regions caused 1.4 TWh of curtailment in 2023, reducing revenue until new HVDC links go live around 2029.
How does the green-bond market support expansion?
Copenhagen’s exchange priced EUR 12 billion of green debt since 2023, trimming average project-finance spreads by up to 30 basis points.
Which regions will house Denmark’s first large-scale hydrogen projects?
Esbjerg and Fredericia host electrolysers totaling up to 1.3 GW, benefiting from proximity to offshore wind and export pipelines.
Page last updated on:


