
Data Warehouse As A Service Market Size and Share
Market Overview
| Study Period | 2020 - 2031 |
|---|---|
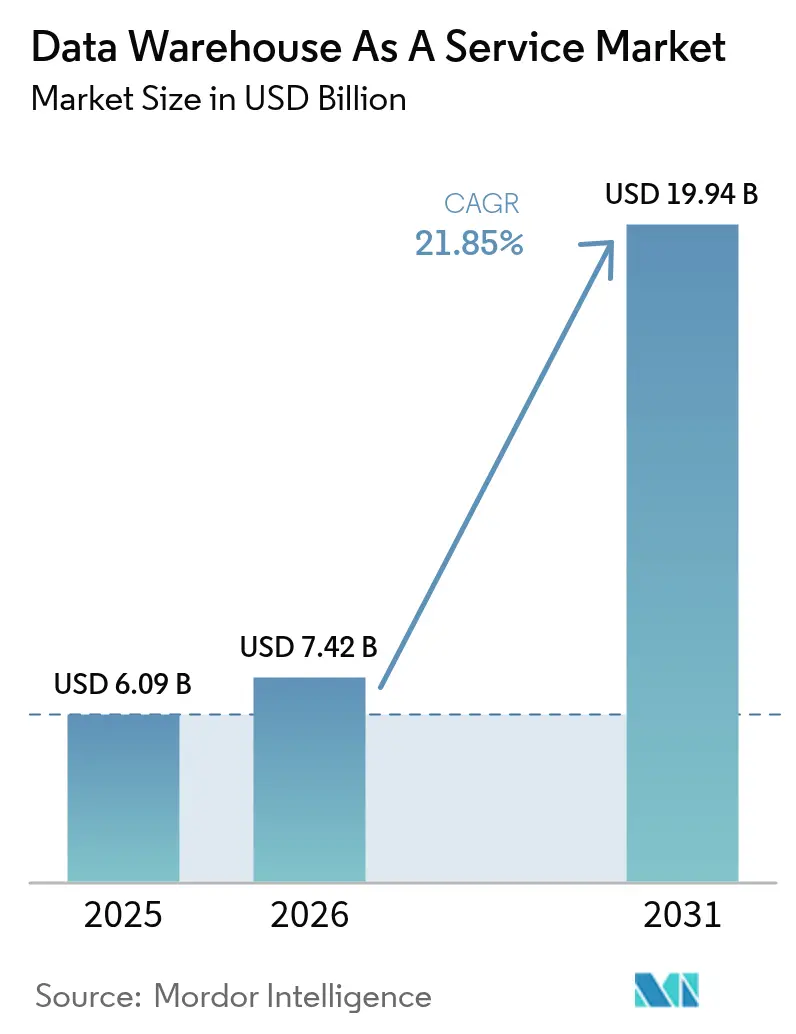
| Market Size (2026) | USD 7.42 Billion |
| Market Size (2031) | USD 19.94 Billion |
| Growth Rate (2026 - 2031) | 21.85 % |
| Fastest Growing Market | Asia Pacific |
| Largest Market | North America |
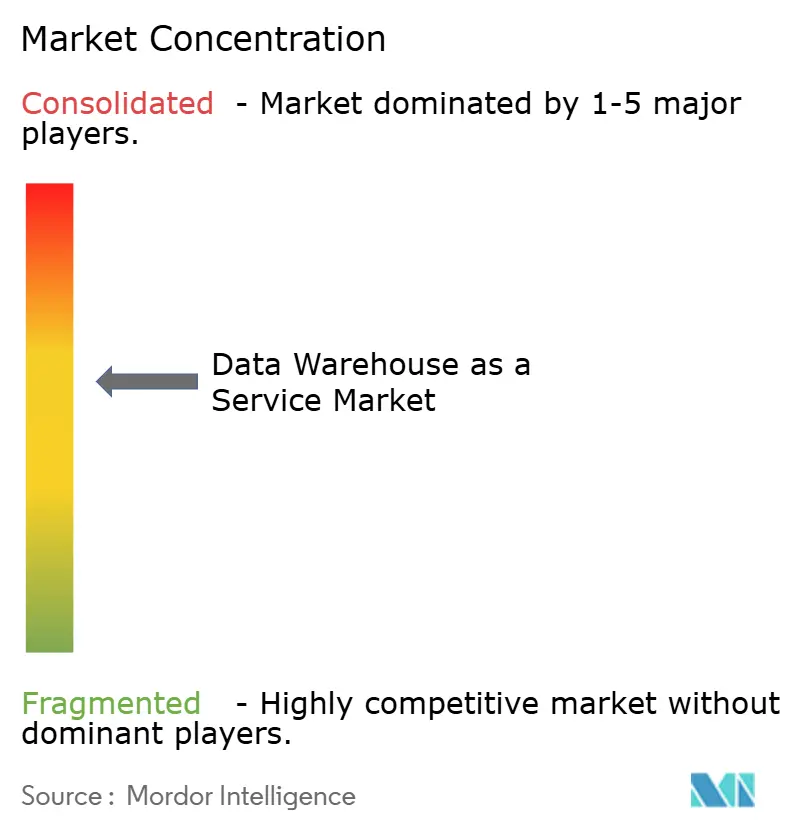
| Market Concentration | Medium |
Major Players *Disclaimer: Major Players sorted in no particular order Image © Mordor Intelligence. Reuse requires attribution under CC BY 4.0. | |
Data Warehouse As A Service Market Analysis by Mordor Intelligence
data warehouse as a service market size in 2026 is estimated at USD 7.42 billion, growing from 2025 value of USD 6.09 billion with 2031 projections showing USD 19.94 billion, growing at 21.85% CAGR over 2026-2031. Strong demand for modern, cloud-native analytics, rising enterprise artificial-intelligence workloads, and the cost efficiencies of pay-as-you-go pricing are the principal growth engines. Public-cloud platforms dominate current deployments, yet multi-cloud and hybrid architectures are outpacing overall expansion as firms hedge against lock-in while optimizing workload placement. Large enterprises still account for a majority of spending, but small and medium enterprises (SMEs) are increasing adoption rapidly as self-service tooling lowers entry barriers and serverless scaling eliminates capacity planning. Vertically, financial services set the adoption pace, whereas healthcare and life sciences log the fastest gains because unified clinical and research data accelerates precision-medicine programs. Competitive intensity remains moderate; hyperscale providers leverage integrated ecosystems while specialists differentiate through multi-cloud portability and built-in machine-learning features.
Key Report Takeaways
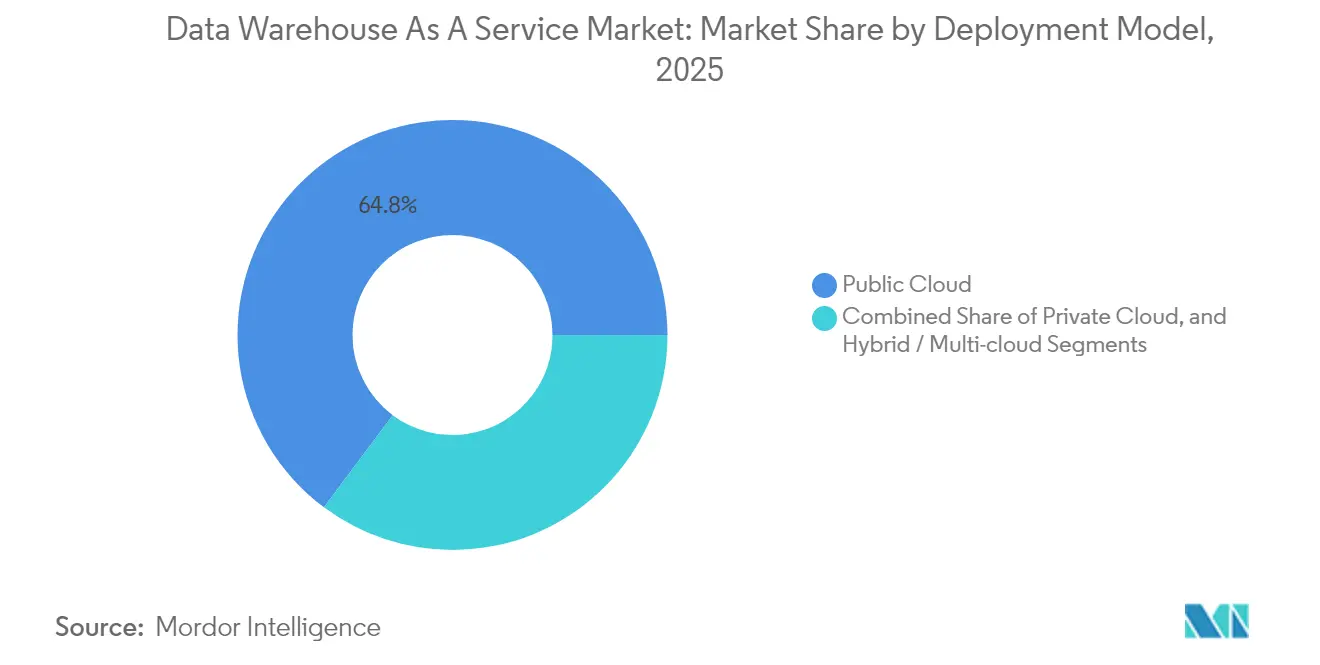
- By deployment model, the public-cloud segment commanded 64.80% of the data warehouse as a service market share in 2025, while hybrid and multi-cloud deployments are forecast to register a 23.90% CAGR through 2031.
- By enterprise size, large corporations held 61.55% share of the data warehouse as a service market size in 2025, whereas SMEs are expected to expand at a 25.60% CAGR to 2031.
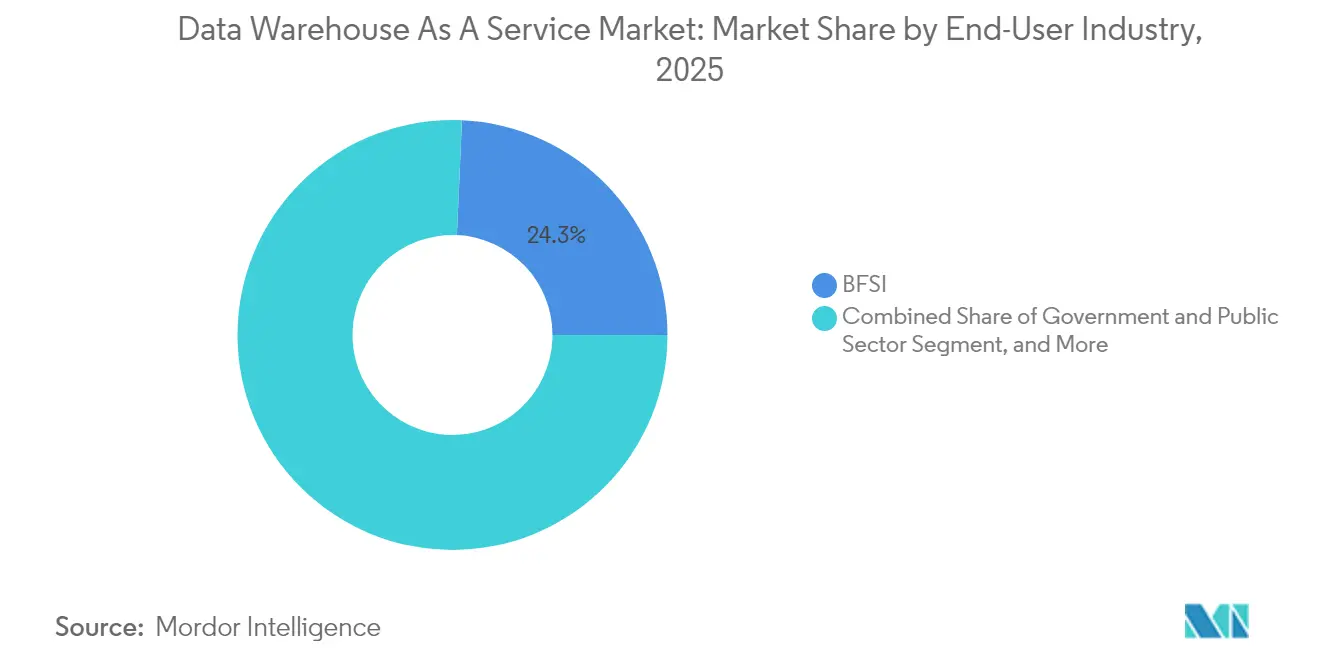
- By end-user industry, banking, financial services and insurance (BFSI) captured 24.30% revenue share in 2025; healthcare and life sciences are projected to grow at a 22.65% CAGR over the same horizon.
- By service type, enterprise DWaaS retained 41.85% of the data warehouse as a service market size in 2025, while data lakehouse as a service is set to advance at a 27.10% CAGR through 2031.
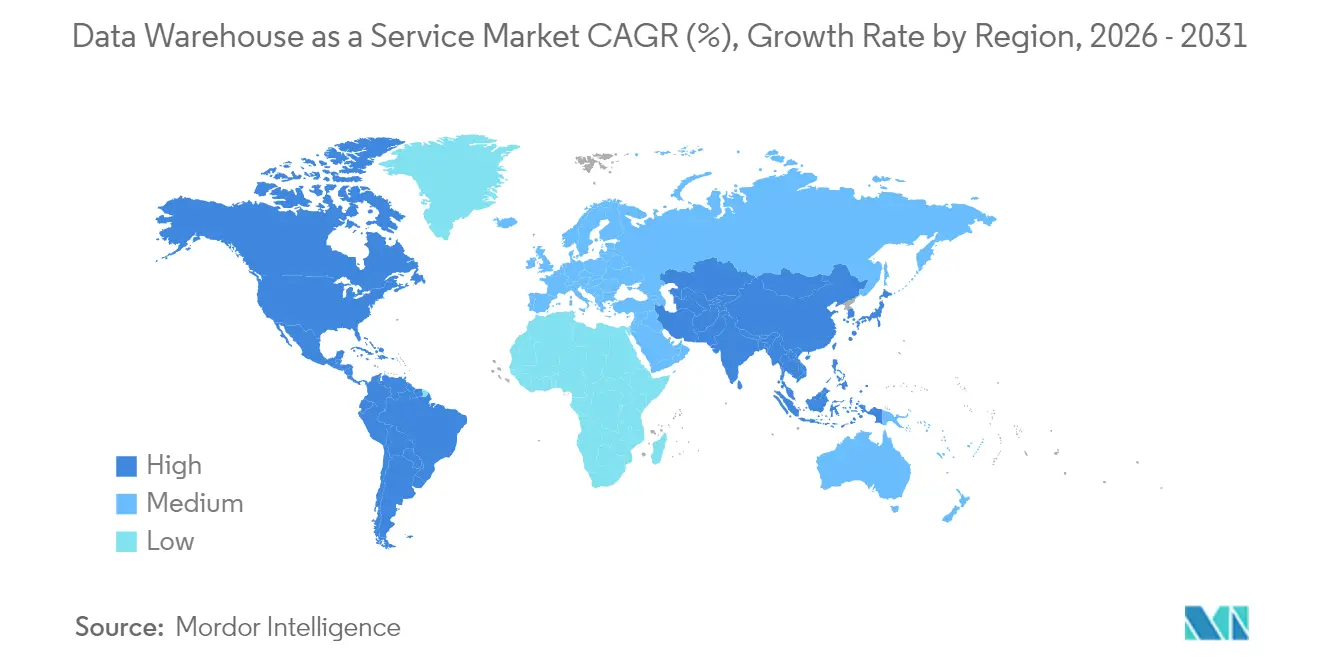
- By geography, North America commanded 38.90% of 2025 revenue, while Asia-Pacific is pacing the fastest at a 24.10% CAGR through 2031.
Note: Market size and forecast figures in this report are generated using Mordor Intelligence’s proprietary estimation framework, updated with the latest available data and insights as of 2026.
Market Trends and Insights
Drivers Impact Analysis of Data Warehouse As A Service Market*
| Driver | (~) % Impact on CAGR Forecast | Geographic Relevance | Impact Timeline |
|---|---|---|---|
| Cloud migration and real-time analytics boom | +6.2% | Global – North America and Europe leading | Medium term (2-4 years) |
| AI/ML-driven warehousing demand | +5.8% | Global – concentrated in technology hubs | Short term (≤ 2 years) |
| BFSI digital-first road-maps | +3.4% | Financial centers in North America, Europe, Asia-Pacific | Medium term (2-4 years) |
| Shift to consumption-based pricing | +2.9% | Global – SME-heavy regions | Short term (≤ 2 years) |
| Edge-to-cloud low-latency warehousing | +2.1% | Asia-Pacific North American manufacturing corridors | Long term (≥ 4 years) |
| Green warehousing and carbon reporting focus | +1.8% | Europe, North America, select Asia-Pacific markets | Long term (≥ 4 years) |
| Source: Mordor Intelligence | |||
Cloud Migration and Real-Time Analytics Boom
Enterprises are shifting from periodic batch reporting to streaming architectures that feed sub-second dashboards and predictive models. ABB consolidated data from 40 disparate ERP systems into a single Snowflake instance and unlocked multimillion-dollar savings through real-time production visibility [1]Snowflake Inc., “ABB Unifies Data from 40 ERPs,” snowflake.com. Edge gateways now filter time-sensitive telemetry close to manufacturing lines, while cloud data warehouses execute complex joins and historical trend analyses without capacity bottlenecks. These low-latency pipelines support autonomous-equipment optimization, dynamic pricing, and instantaneous fraud controls. As more connected devices proliferate, real-time analytics will remain a top spending priority, reinforcing demand for elastic DWaaS capacity that scales on ingestion rates rather than fixed nodes.
AI/ML-Driven Warehousing Demand
Modern data-warehouse layers blend structured tables with unstructured files, enabling model training inside the storage tier. Snowflake’s collaboration with NVIDIA embeds specialized GPUs alongside compute clusters so data never leaves the security perimeter during inference acceleration [2]Snowflake Inc. & NVIDIA Corp., “Full-Stack AI Platform Partnership,” snowflake.com. Databricks integrates lakehouse storage formats that let data scientists build features over petabyte-scale logs using the same SQL endpoints powering dashboards. Natural-language query assistants driven by large language models democratize analytics access for business users, fueling broader organizational adoption and increasing overall compute consumption across the data warehouse as a service market.
BFSI Digital-First Road-Maps
Banks and insurers pursue cloud data warehouses to unify risk, trading, and customer data for real-time insights while meeting stringent audit mandates. Capgemini reports that 95% of global banking executives regard cloud analytics as foundational to their digital-first strategies. High-frequency fraud-detection engines run continuous queries on billions of daily transactions, scaling elastically during market spikes. Multi-cloud deployments help firms meet data-residency laws across jurisdictions while limiting single-vendor exposure. Open-banking APIs further push warehouses toward millisecond response times to satisfy partner integrations without compromising governance.
Shift to Consumption-Based Pricing
Usage-based billing replaces fixed-capacity licenses, allowing customers to align spend with fluctuating workloads. Finout benchmarks show enterprises trimming more than 50% from total cost of ownership after migrating to serverless, consumption-oriented warehouses FINOUT.IO. SMEs particularly benefit because they can launch enterprise-grade analytics without upfront hardware buys. FinOps teams apply automated query-profiling and storage-tiering policies to prevent cost overruns, while vendors continually refine intelligent auto-scaling algorithms to right-size resources per second of demand.
Restraints Impact Analysis of Data Warehouse As A Service Market*
| Restraint | (~) % Impact on CAGR Forecast | Geographic Relevance | Impact Timeline |
|---|---|---|---|
| Cyber-security and privacy risks | -3.7% | Global – highest in regulated sectors | Short term (≤ 2 years) |
| Unpredictable cloud cost sprawl | -2.8% | Global – SMEs and cost-sensitive industries most affected | Medium term (2-4 years) |
| Vendor lock-in concerns | -2.1% | North America and Europe enterprises | Medium term (2-4 years) |
| Shortage of FinOps / data-observability skills | -1.9% | Global – acute in emerging markets | Long term (≥ 4 years) |
| Source: Mordor Intelligence | |||
Cyber-Security and Privacy Risks
General Data Protection Regulation requirements in Europe and new localization statutes in Asia restrict cross-border data movement, complicating multinational cloud strategies. Consolidating sensitive assets inside third-party clouds heightens the appeal for threat actors, forcing enterprises to deploy pervasive encryption, zero-trust access and continuous posture monitoring. The shared-responsibility security model itself can blur accountability lines, especially for teams lacking dedicated cloud-security talent, thereby extending procurement cycles and slowing adoption.
Unpredictable Cloud Cost Sprawl
While metered billing optimizes capex, volatile query volumes can cause budget overruns if governance guardrails lag behind implementation. Brooklyn Data found that mis-tuned SQL and excessive data scans doubled monthly spend for several mid-market clients until proactive monitoring was installed. Inter-region egress fees and hidden orchestration charges further obscure total economics, prompting finance and engineering teams to institute real-time dashboards and anomaly alerts before green-lighting expansive workloads.
*Our forecasts treat driver/restraint impacts as directional, not additive. The impact forecasts reflect baseline growth, mix effects, and variable interactions.
Data Warehouse As A Service Market Segment Analysis
By Deployment Model:
Public Cloud Dominance Drives Multi-Cloud InnovationPublic-cloud platforms held 64.80% of the data warehouse as a service market size in 2025 as enterprises prioritized turnkey scalability and global availability. AWS captured roughly 34% of worldwide revenue thanks to deep service integration, while Microsoft Azure benefited from established Office 365 footprints that eased procurement. Private-cloud instances persist where sovereignty mandates preclude external hosting, but higher operational overhead tempers growth.
Hybrid and multi-cloud deployments are projected to record a 23.90% CAGR through 2031 as firms distribute analytics across providers to avoid lock-in, exploit regional cost differentials and place sensitive datasets on preferred sovereign platforms. Google Cloud’s BigQuery Omni allows cross-cloud querying without physical data moves, showing how interoperability features reduce egress fees and latency penalties . Snowflake’s open Polaris Catalog further eases migration by standardizing metadata across AWS, Azure and Google Cloud.



By End-User Enterprise Size:
SME Adoption Accelerates Through Democratized AnalyticsLarge organizations controlled 61.55% of the 2025 data warehouse as a service market share due to complex governance needs and multi-department analytics estates. They deploy advanced security layers, support thousands of concurrent users and integrate warehouses with legacy ERP, CRM and risk engines.
In contrast, SMEs will drive the highest incremental revenue, expanding at a 25.60% CAGR through 2031 as serverless engines remove capacity-planning hurdles. Low-code ingestion connectors and natural-language query interfaces allow business analysts to launch predictive models without dedicated data-science teams, narrowing capability gaps versus larger peers. Academic studies highlight cultural change as the primary success factor for SME analytics programs, not hardware budgets.
By End-User Industry:
Healthcare Transformation Drives Vertical InnovationBFSI led spending with 24.30% of 2025 revenue, relying on elastic warehouses for intra-day risk calculations, stress testing and regulatory reporting. High concurrency needs during trading peaks reinforce preference for cloud burst capacity.
Healthcare and life-sciences workloads are forecast to register a 22.65% CAGR as clinical researchers integrate genomic, imaging and electronic-medical-record data into single lakehouse environments to accelerate drug discovery and personalized-therapy design. Retailers follow closely, harnessing clickstream analytics for recommendation engines and demand-forecast models, while manufacturers leverage predictive-maintenance insights to lift overall equipment efficiency by 15%.
By Service Type:
Data Lakehouse Architecture Reshapes Analytics LandscapeEnterprise DWaaS services maintained 41.85% of the data warehouse as a service market size in 2025, favored for mature governance functions and compatibility with legacy BI tools. Operational data-store variants support millisecond-level decision loops without burdening transactional systems.
Lakehouse-as-a-Service offerings are slated to soar at a 27.10% CAGR as firms seek single-copy storage for structured tables and unstructured media. Open formats such as Apache Iceberg and Delta Lake supply ACID transactions and time-travel queries once exclusive to classic warehouses, while remaining engine-agnostic. Analytics-acceleration add-ons that provide vector-index caches and columnar rewrite optimizations will supplement both warehouse and lakehouse estates, sharpening query performance on massive user fleets.
Geography Analysis
North America Data Warehouse As a Service Market
North America accounted for 38.90% of global revenue in 2025, buoyed by abundant data-center capacity, favorable cloud procurement policies and a deep skills base across technology, finance and healthcare verticals. Hyperscalers continuously launch region-specific AI accelerators and sovereign-cloud zones, sustaining demand for premium analytics tiers. Federal and state agencies, exemplified by the State of Maine’s cloud migration, further validate cloud warehouses for public-sector workloads .
APAC Data Warehouse As a Service Market
Asia-Pacific is the fastest-growing region with a 24.10% CAGR through 2031, supported by massive hyperscale build-outs and government digital-economy roadmaps. Public-sector exemplars such as Singapore’s GovTech highlight how regulatory clarity and state-sponsored cloud training shorten enterprise adoption cycles.
EMEA and South America Data Warehouse As a Service Market
Europe balances high analytics demand with stringent sovereignty legislation. Vendors respond by launching EU-only regions, confidential computing enclaves and sovereign-metadata services. Multinational financial institutions implement distributed data-mesh architectures to comply with local residency rules while preserving cross-border risk analytics. South America plus the Middle East & Africa exhibit growing, albeit smaller, opportunity pools linked to e-commerce expansion and smart-city initiatives; however, infrastructure gaps and macro-economic volatility moderate near-term uptake.

Regulatory Landscape
Regulation affecting DWaaS is increasingly shaped by privacy, cybersecurity assurance, and cloud portability requirements, which influence where data can be stored and how easily workloads can move. In the European Union, the Data Act has applied since 12 September 2025 and sets rules for cloud switching and interoperability, including a schedule that reduces switching charges and reaches free-of-charge switching by 12 January 2027. Alongside this, the European Commission issued its Cloud Sovereignty Framework (v1.2.1, October 2025) as a procurement-oriented reference for auditability and sovereignty objectives, while the European Data Protection Board backed the EU Cloud Code of Conduct (2024) to operationalize GDPR-aligned controls for cloud services.
Public-sector and regulated-industry procurement is also pushing providers toward standardized assurance schemes and local policy alignment. Germany's BSI published C5:2026, mapping controls to widely used security expectations (including ISO/IEC standards) and aligning with EU-level cybersecurity certification direction, which raises the bar for cloud environments hosting sensitive analytics data. In the United States, FedRAMP continues as the central authorization route for cloud services used by federal agencies in 2026, shaping security baselines and documentation practices across commercial DWaaS offerings. Emerging-market sovereign requirements are tightening as well, with Nigeria's National Cloud Policy 2025 (NITDA, October 2025) mandating a national data classification framework and local data residency, reinforcing the need for region-specific architectures in global DWaaS deployments.
Value Chain Analysis
The DWaaS value chain starts with hyperscale cloud infrastructure (compute, storage, networking, accelerators, and regional data center footprints) supplied by platforms such as AWS, Microsoft Azure, and Google Cloud. On top of this layer, DWaaS engines and lakehouse services provide SQL execution, governance, and elastic scaling, along with catalogs and interoperability features (for example, cross-cloud query and metadata portability capabilities referenced in the market's shift toward hybrid and multi-cloud). Data ingestion, integration, and governance tooling connects operational sources (ERP, CRM, core banking, telemetry, and SaaS applications) into warehouses and lakehouse tables, with open table formats (such as Apache Iceberg) increasingly used to reduce friction across engines and clouds.
Downstream, system integrators, managed service providers, and platform partners implement architectures (including Zero-ETL and real-time ingestion patterns) and operationalize FinOps and security controls for customers in BFSI, healthcare and life sciences, government, retail, telecom, and manufacturing. Customer value realization is concentrated in analytics consumption layers such as BI, embedded analytics, and AI/ML development and inference executed closer to governed data, increasing demand for native AI features and workload optimization inside the DWaaS platform. Key friction points across the chain include cloud cost sprawl under consumption pricing (query inefficiency, data scans, and egress) and the operational impact of sovereignty mandates, which can require localized deployments, duplicated controls, and additional assurance evidence for procurement.
Competitive Landscape
The market is moderately concentrated. Amazon Web Services leads with roughly one-third of global revenue, leveraging Redshift and an expansive supporting-service catalog. Microsoft Azure positions Synapse and Fabric as tightly integrated analytics layers for enterprises already committed to its productivity stack. Google Cloud grows fastest, propelled by BigQuery’s serverless model and built-in machine-learning tooling.
Specialists add competitive pressure. Snowflake differentiates through cross-cloud portability and native collaboration features, while Databricks champions an open lakehouse paradigm that merges data engineering and data science workflows. ClickHouse and Firebolt target ultra-high-performance, column-store workloads, often in gaming and ad-tech scenarios where sub-second response at terabyte scale is mandatory.
Strategic moves underline the race to embed AI. Oracle made its flagship database available on AWS infrastructure to broaden addressable workloads and close ecosystem gaps. IBM launched Db2 Warehouse SaaS on Azure using a bring-your-own-cloud model to capture hybrid customers. Informatica partnered with Databricks to support managed Iceberg tables and native GenAI data-prep functions, underscoring the premium placed on unified, AI-ready datasets.
Data Warehouse As A Service Industry Leaders
Amazon Web Services Inc.
IBM Corporation
Microsoft Corporation
Snowflake Inc.
Google LLC
- *Disclaimer: Major Players sorted in no particular order
Data Warehouse As A Service Market Companies Covered in this Report
- Amazon Web Services Inc.
- Microsoft Corporation
- Google LLC
- Snowflake Inc.
- IBM Corporation
- Oracle Corporation
- SAP SE
- Teradata Corp.
- Cloudera Inc.
- Databricks Inc.
- Micro Focus International plc
- Yellowbrick Data
- ClickHouse Inc.
- Dremio Corporation
- Alibaba Cloud
- Huawei Cloud
- Firebolt Analytics Ltd.
- Vertica (Micro Focus)
- Exasol AG
- Actian Corp.

Market Opportunities and Future Outlook
Product-led price-performance and user-access expansion is creating whitespace for DWaaS providers and partners to differentiate on efficiency and usability, not only raw scalability. In May 2026, AWS made Amazon Redshift RG instances generally available, using AWS Graviton processors to improve price-performance (including reported up to 2.2x faster data warehouse performance and 30% lower cost per vCPU than RA3). This supports opportunities for vendors and service partners focused on warehouse modernization programs linked to FinOps governance and workload right-sizing. As customers scrutinize consumption spend, platforms that embed cost controls into workload management, query optimization, and storage tiering can capture incremental share in SME and cost-sensitive enterprise segments highlighted in the adoption mix.
A second opportunity area is the shift toward AI-native interaction and agentic workflows within the warehouse, which reduces dependency on specialist SQL skills and accelerates adoption by business teams. Google Cloud moved Conversational Analytics in BigQuery to general availability in June 2026, enabling natural-language querying and multi-step analysis using Gemini models, and it also announced new BigQuery capabilities for agentic workflows (including a Data Agent Kit in preview) in April 2026. These releases drive demand for data governance, semantic modeling, and secure self-service patterns that keep sensitive datasets within controlled perimeters while supporting broader analytics access. Providers and ecosystem partners that package compliant, multi-cloud-ready architectures with standardized metadata/catalog practices and sovereignty-aware deployment patterns can address the need to combine portability with regulated-data controls.
Recent Industry Developments in Data Warehouse As A Service Market
- July 2026: Matillion announced general availability of Maia Foundation on Google BigQuery, enabling AI-driven data automation and transformations to run directly in the BigQuery environment. The launch supports in-warehouse pipeline execution patterns and reduces data movement across tools, supporting faster time-to-insight for teams standardizing on BigQuery-centered DWaaS stacks.
- June 2026: Snowflake made Adaptive Compute generally available on AWS, allowing customers to create Adaptive Warehouses or convert existing standard warehouses without downtime across multiple regions. This expands elasticity options for variable workloads and supports tighter cost-to-performance tuning for consumption-based warehousing.
- July 2025: Oracle Database@AWS became generally available in Northern Virginia and Oregon, extending Oracle database services onto AWS infrastructure. This broadens co-residency choices for analytics estates that combine Oracle data sources with cloud-native warehouse services and reinforces multi-vendor cloud operating models.


Data Warehouse As A Service Market Report Scope and Research Methodology
Market Definition and Coverage
For this study, the Data Warehouse as a Service (DWaaS) market is defined as the paid, cloud-delivered service used by organizations to store, manage, and query structured and semi-structured data for analytics, where the warehouse is provisioned and managed as a service.
Scope exclusions: We exclude on-premises data warehouse hardware and licenses, general cloud storage, and non-warehouse analytics tools that do not provide a managed data warehouse layer.
Segments Covered in This Report
- By Deployment Model
- Public Cloud
- Private Cloud
- Hybrid / Multi-cloud
- By End-user Enterprise Size
- Large Enterprises
- Small and Medium Enterprises
- By End-user Industry
- BFSI
- Government and Public Sector
- Healthcare and Life Sciences
- Retail and E-commerce
- Telecom and IT
- Media and Entertainment
- Manufacturing
- By Service Type
- Enterprise DWaaS
- Operational Data-store as a Service
- Data Lakehouse as a Service
- Analytics Acceleration Services
- By Geography
- North America
- United States
- Canada
- Mexico
- South America
- Brazil
- Argentina
- Rest of South America
- Europe
- Germany
- United Kingdom
- France
- Italy
- Spain
- Russia
- Rest of Europe
- Asia-Pacific
- China
- Japan
- India
- South Korea
- Australia and New Zealand
- Rest of Asia-Pacific
- Middle East and Africa
- Middle East
- Saudi Arabia
- United Arab Emirates
- Turkey
- Rest of Middle East
- Africa
- South Africa
- Nigeria
- Egypt
- Rest of Africa
- Middle East
- North America
Data Sources, Market Sizing, and Validation
Desk Research
Desk research started with public technology adoption signals and macro IT spend direction, which helped us frame what is realistic for DWaaS demand growth by region and industry. We referred to sources such as NIST publications on cloud and data management, U.S. Bureau of Labor Statistics series that indicate data and software job trends, OECD digital economy indicators, and World Bank digital adoption indicators, which together provide context for enterprise cloud readiness.
To stay close to the buying side, we also used materials such as SEC filings and investor presentations of relevant cloud and software providers, product documentation pages, and reputable press coverage of major feature releases that impact consumption patterns. Patent databases were reviewed to understand the pace of innovation around cloud warehousing, query acceleration, and data governance. The sources mentioned here are illustrative, and many other public references were used for data collection, cross-checking, and clarification.
Primary Interviews and Surveys
Primary work focused on validating how DWaaS revenues are recognized and what gets bundled into contracts, since pricing is often usage-led. We spoke with a mix of providers, cloud implementation partners, and enterprise users across APAC, EMEA, and the Americas to test assumptions on average workloads, typical contract structures, migration timing, and multi-cloud adoption, which were then used to tighten model inputs.
Distribution of primary research fieldwork respondents
| Company type | Respondent position | Region |
|---|---|---|
| Top tier: 33% | CXOs: 12% | APAC: 51% |
| Mid tier: 53% | Functional/Unit leaders: 32% | EMEA: 30% |
| Smaller Players: 14% | Managers: 56% | Americas: 19% |
Market-Sizing & Forecasting
Market sizing was built using a top-down demand-pool approach where enterprise cloud data platform spending is reconstructed and then narrowed into DWaaS through adoption and workload mix assumptions. To keep the totals realistic, the results were corroborated with selective bottom-up approximations, including sampled provider revenue disclosures where available, partner channel checks, and a simple volume-by-ASP sense check using warehouse consumption drivers.
Key inputs used in the model include public cloud penetration in target industries, active data volumes and query intensity trends (as they drive consumption pricing), the share of workloads moving from on-premises warehouses to cloud-managed warehouses, multi-cloud and hybrid deployment preference, and region-wise IT spending momentum. Forecasting relied mainly on scenario analysis, because growth is sensitive to migration speed, pricing normalization, and governance requirements, and these scenarios were aligned to what interviewees described as practical rollout timelines. Where direct bottom-up evidence was thin, conservative penetration ranges were applied first, and then adjusted only after multiple independent checks supported the change.
Data Validation & Update Cycle
Outputs were validated through triangulation across three layers: desk signals, primary feedback, and internal consistency checks across regions and end-user groups. We ran variance checks on implied spend per adopting enterprise, growth step-ups around known migration waves, and pricing logic tied to usage, and then anomalies were reviewed in a second analyst pass before sign-off.
The model is refreshed annually so structural changes in cloud pricing, service bundling, and adoption patterns get captured. Interim updates are triggered when material events occur, such as major pricing model shifts, regulatory actions that affect data residency, or sharp changes in cloud spending. Before a report is delivered, a final review pass is completed so the latest public disclosures and market signals are reflected in the numbers.
Mordor Intelligence's Data Warehouse As A Service Market Size Versus Other Published Estimates
Published market numbers for DWaaS can differ even when they look like they are talking about the same thing, because the market sits inside a wider cloud data platform stack and definitions are easy to stretch. Differences typically come from what is counted as DWaaS, which year is treated as the reference point, and how usage-based pricing is converted into annual revenue.
The main gap comes from whether adjacent cloud data platform items are included, especially data lake storage, data integration tooling, and broader analytics services, and in how multi-cloud deployments are treated when revenue is booked across more than one provider. When those items are excluded and revenue is tied back to consumption signals like query workload intensity and active data footprint, the DWaaS total stays closer to what buyers actually spend on the warehouse layer, which is how Mordor Intelligence models this market.
Benchmark comparison
| Source | Market Size | Gaps in Research Methodology |
|---|---|---|
| Mordor Intelligence | USD 7.42 B (2026) | |
| Global Consultancy A | USD 8.27 B (2024) | Uses an earlier base year and often captures a wider cloud data platform spend pool, which can pull in related services beyond the managed data warehouse layer and lift the reported value. |
| Industry Publisher B | USD 9.79 B (2025) | Base year and currency timing differ, and bundled cloud contracts may be counted more fully as DWaaS even when integration, governance, or analytics components are priced together. |
Overall, the spread across sources is consistent with a market where the product definition sits close to other cloud data services and where usage-based pricing changes the annualized value. By linking the sizing steps to clear demand indicators and then checking the implied spend per adopter across regions, the result stays transparent and repeatable for updates.


Key Questions Answered in the Report
What is the current value of the data warehouse as a service market?
The data warehouse as a service market size stands at USD 7.42 billion in 2026.
Which deployment model leads the market?
Public-cloud deployments hold 64.80% of 2025 revenue, reflecting preference for fully managed scalability.
How fast is Asia-Pacific expanding?
Asia-Pacific shows the highest regional pace with a 24.10% CAGR forecast through 2031.
Why are SMEs embracing DWaaS?
Serverless architectures and consumption-based pricing let SMEs avoid upfront hardware costs while gaining enterprise-grade analytics.
Page last updated on:


 Your data is secure and never sold or shared.


