Active Data Warehousing Market Size and Share
Market Overview
| Study Period | 2020 - 2031 |
|---|---|
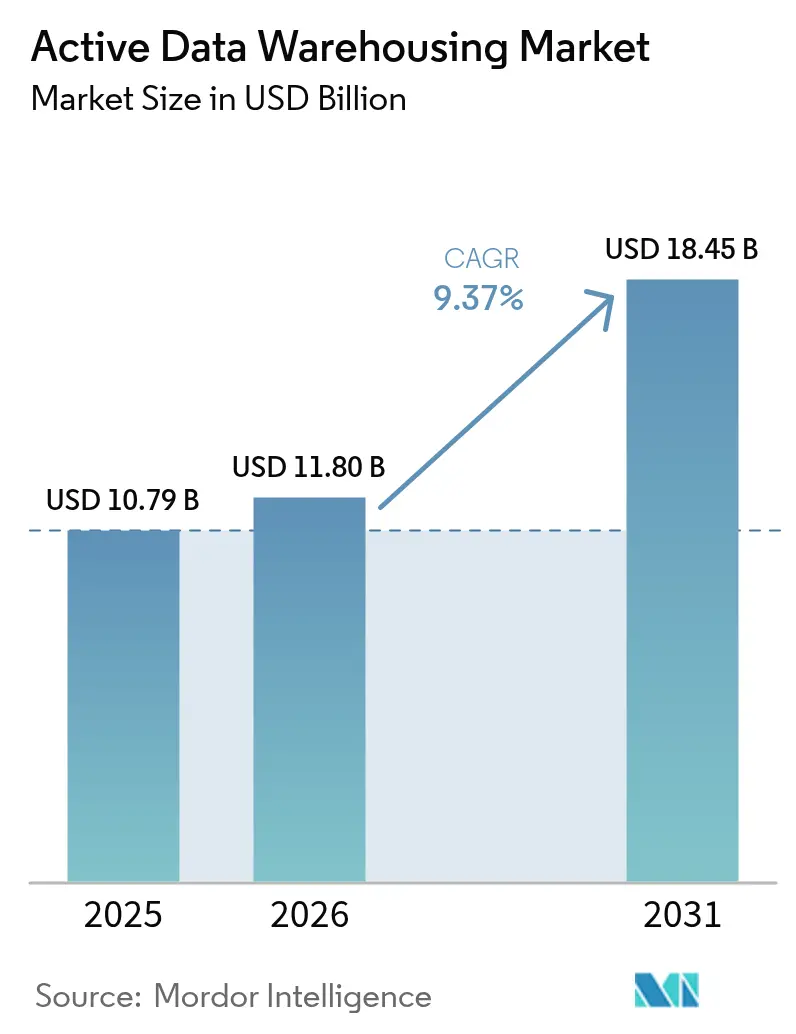
| Market Size (2026) | USD 11.8 Billion |
| Market Size (2031) | USD 18.45 Billion |
| Growth Rate (2026 - 2031) | 9.37% CAGR |
| Fastest Growing Market | Asia-Pacific |
| Largest Market | North America |
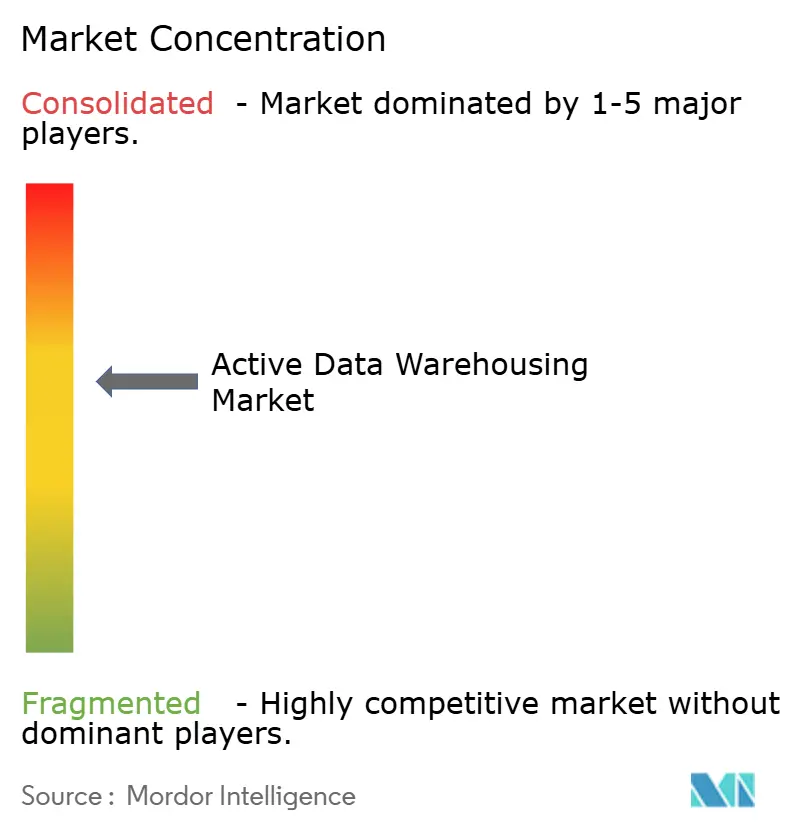
| Market Concentration | Medium |
Major Players *Disclaimer: Major Players sorted in no particular order Image © Mordor Intelligence. Reuse requires attribution under CC BY 4.0. | |
Active Data Warehousing Market Analysis by Mordor Intelligence
The active data warehousing market size was valued at USD 10.79 billion in 2025 and estimated to grow from USD 11.8 billion in 2026 to reach USD 18.45 billion by 2031, at a CAGR of 9.37% during the forecast period (2026-2031). Demand is shifting from batch-oriented infrastructure toward continuous data ingestion and sub-second query performance as enterprises modernize digital services. Cloud platforms dominate because hyperscaler pricing eliminates capital expenditure and compresses deployment cycles, while hybrid architectures rise in jurisdictions that enforce data residency rules. Platform differentiation now hinges on governance, AI-assisted tuning, and open table formats that lower switching costs. Competitive intensity is set to rise as transactional-analytical convergence, generative AI in query engines, and multi-cloud portability narrow performance gaps across price tiers.
Key Report Takeaways
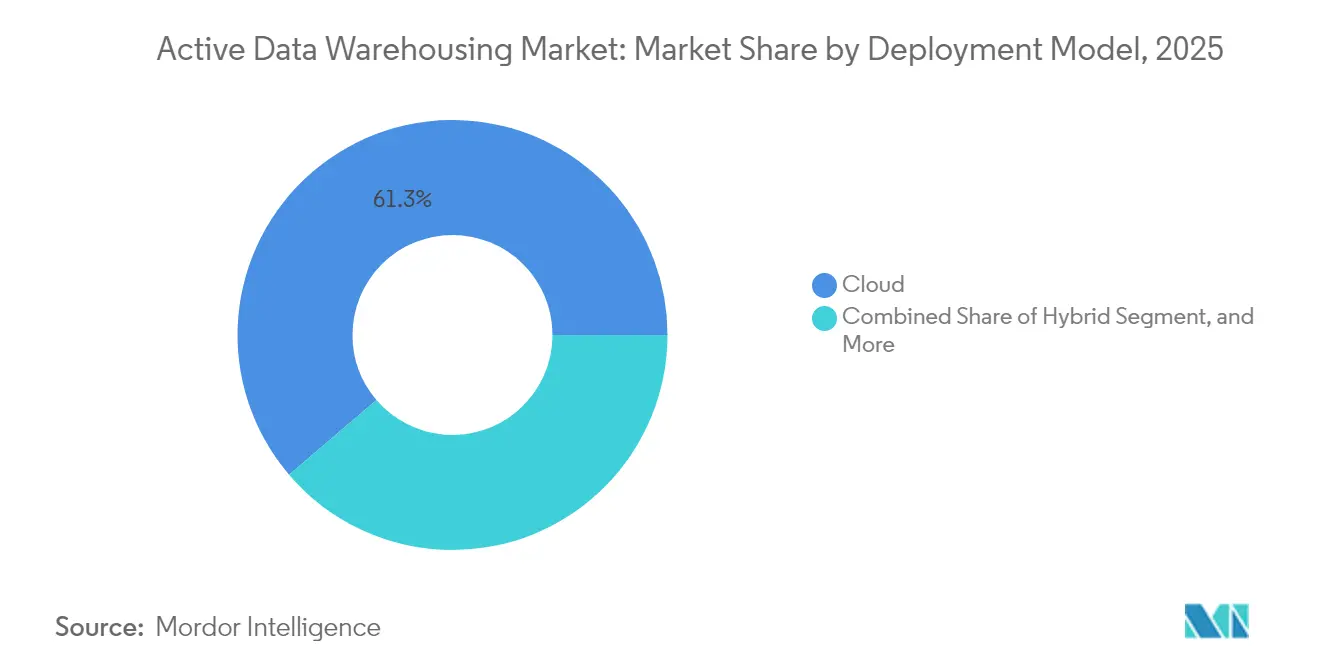
- By deployment model, hybrid environments are expected to expand at a 10.12% CAGR through 2031, while cloud deployments are projected to retain 61.25% of the active data warehousing market share in 2025.
- By component, software contributed 68.95% of the active data warehousing market share in 2025, while services posted the fastest growth rate of 10.05% due to increasing implementation complexity.
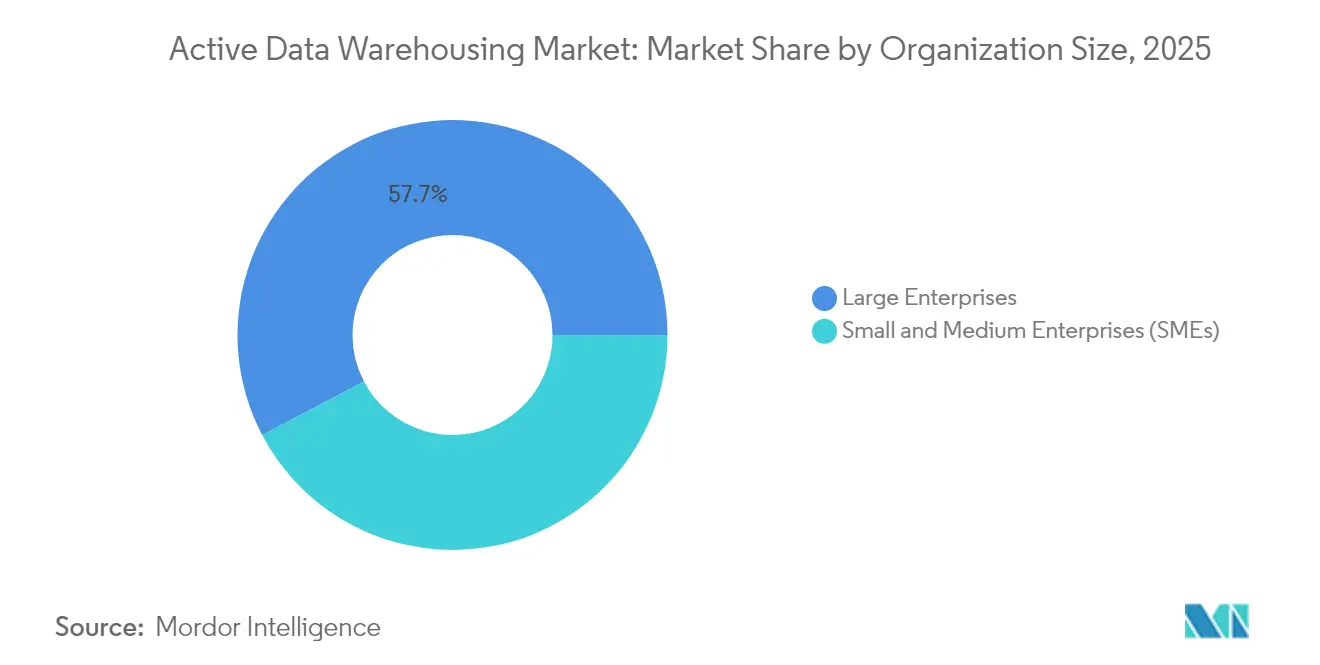
- By organization size, large enterprises accounted for 57.70% of the active data warehousing market share in 2025, whereas SMEs grew at a 9.98% CAGR as consumption pricing aligned costs with revenue cycles.
- By industry vertical, Banking, Financial Services and Insurance (BFSI) contributed 26.20% of the active data warehousing market share in 2025, and healthcare and life sciences posted the highest 10.72% CAGR as interoperability mandates demanded millisecond-latency analytics.
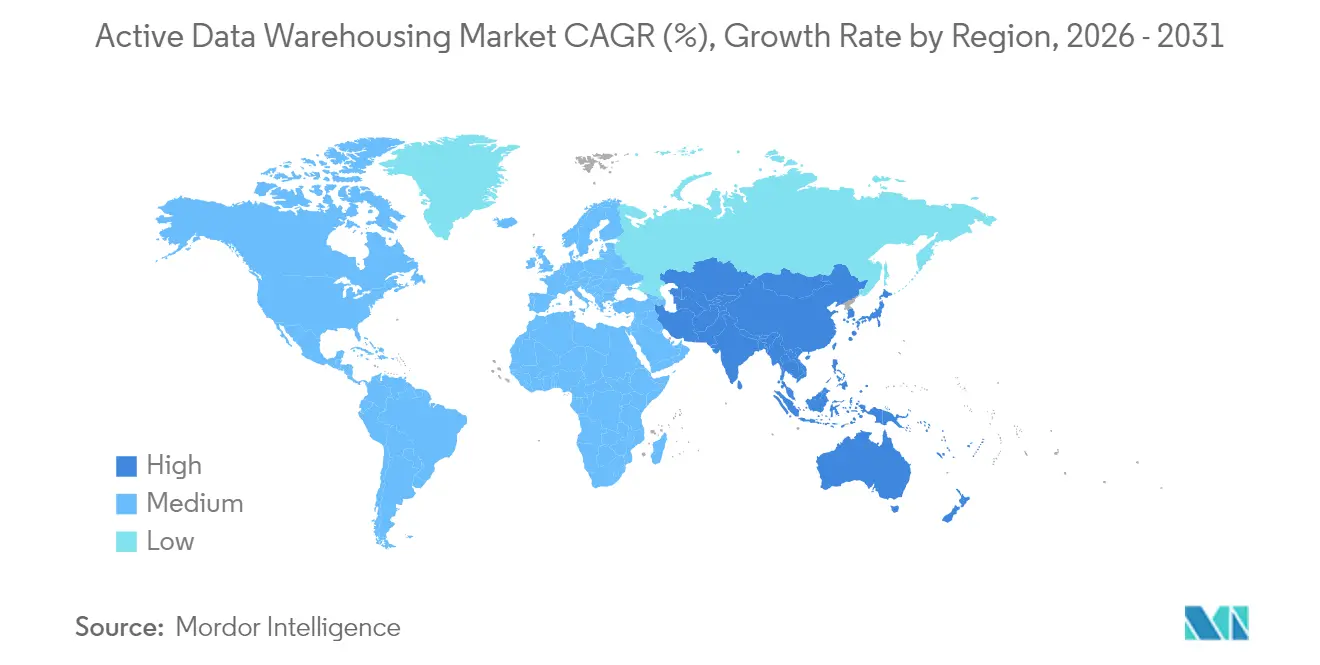
- By geography, North America held 35.10% of the active data warehousing market share in 2025, while Asia Pacific delivered the strongest 10.45% CAGR through 2031.
Note: Market size and forecast figures in this report are generated using Mordor Intelligence’s proprietary estimation framework, updated with the latest available data and insights as of 2026.
Global Active Data Warehousing Market Trends and Insights
Drivers Impact Analysis*
| Driver | (~) % Impact on CAGR Forecast | Geographic Relevance | Impact Timeline |
|---|---|---|---|
| Accelerated adoption of real-time analytics by customer-facing applications | +2.3% | Global, concentrated in North America and Europe | Short term (≤ 2 years) |
| Proliferation of cloud-native data warehousing platforms | +1.8% | Global, led by North America, Asia Pacific emerging | Medium term (2-4 years) |
| Rising demand for unified data governance across hybrid environments | +1.5% | Europe and North America core, Asia Pacific growing | Medium term (2-4 years) |
| Integration of AI-driven query optimization for sub-second insights | +1.2% | Global, early adoption in technology hubs | Short term (≤ 2 years) |
| Surge in IoT and edge data generating voluminous streams | +0.9% | Asia Pacific and North America manufacturing corridors | Long term (≥ 4 years) |
| Pay-as-you-go pricing models enhancing accessibility for SMEs | +0.7% | Global, impactful in emerging markets | Short term (≤ 2 years) |
| Source: Mordor Intelligence | |||
Accelerated Adoption of Real-Time Analytics By Customer-Facing Applications
Fraud-detection engines now evaluate card transactions within 50-100 milliseconds, a latency window batch warehouses cannot meet. Retailers using real-time inventory visibility cut stock-outs by 23% during the 2024 holiday season. Event-driven platforms route clickstream events to the warehouse as users interact, demanding concurrent high-velocity ingestion and complex query workloads. Hyperscaler services that decouple compute from storage, such as Amazon Redshift Serverless, scale elastically during peak traffic without over-provisioning idle capacity.[1]Amazon Web Services, “Amazon Redshift Serverless,” aws.amazon.com As a result, enterprises now classify sub-second analytics as a competitive baseline rather than an aspirational feature.
Proliferation of Cloud-Native Data Warehousing Platforms
Cloud-native offerings disaggregate compute, storage, and metadata, enabling granular scalability and near-instant provisioning. Snowflake posted 38% year-over-year product revenue growth to USD 2.8 billion in fiscal 2024 as customers migrated from appliance-based systems.[2]Snowflake Inc., “Fiscal 2024 Results,” snowflake.com Support for Apache Iceberg across AWS, Microsoft Fabric, and Google BigQuery removed lock-in concerns and accelerated multi-cloud strategies. Databricks’ USD 1 billion acquisition of Tabular underscored the strategic importance of open table formats that commoditize storage while differentiating compute. Vendors now compete on intelligent workload management and integrated governance rather than raw storage capacity.
Rising Demand for Unified Data Governance Across Hybrid Environments
The European Union’s Data Act, effective 2024, obliges industrial firms to make IoT data available to third parties under strict conditions, requiring governance that spans clouds and on-premises clusters. AWS Lake Formation extended cross-region policy enforcement in 2024, letting administrators apply a single access rule across multiple accounts. Microsoft Purview added scanning for on-premises SQL Server instances, creating a consolidated catalog that travels with the data.[3]Microsoft Corp., “Azure Synapse Analytics,” microsoft.com China’s Personal Information Protection Law forces multinationals to warehouse citizen records locally, fragmenting global datasets and elevating policy-driven data routing needs. Vendors that bundle federated governance into their core services gain strategic advantage.
Integration of AI-Driven Query Optimization For Sub-Second Insights
Google’s Duet AI generates optimized SQL from natural-language prompts and recommends partition strategies, accelerating analytics for non-technical users. AWS injected generative AI into Redshift workload management, allocating compute based on predicted query complexity rather than static queues. Snowflake Cortex AI lets analysts run machine-learning models inside the warehouse, eliminating data-movement latency. Early adopters report 40% faster time-to-insight versus manual tuning approaches. The technology’s value rises as routine reporting workloads dominate enterprise dashboards.
Restraints Impact Analysis*
| Restraint | (~) % Impact on CAGR Forecast | Geographic Relevance | Impact Timeline |
|---|---|---|---|
| High costs of data migration from legacy systems | -1.4% | Global, acute in North America and Europe | Short term (≤ 2 years) |
| Skilled talent shortage in real-time data engineering | -1.2% | Global, severe in emerging markets | Medium term (2-4 years) |
| Complexity of ensuring continuous data quality at scale | -0.9% | Global, heightened in regulated industries | Medium term (2-4 years) |
| Stringent data sovereignty regulations limiting cross-border warehousing | -0.8% | Europe, Asia Pacific, Middle East | Long term (≥ 4 years) |
| Source: Mordor Intelligence | |||
High Costs of Data Migration From Legacy Systems
Schema conversion, data validation, and application refactoring can consume 15-25% of modernization budgets, prolonging payback timelines. Teradata workloads require costly rewrites because proprietary SQL extensions lack direct cloud equivalents. Although AWS Schema Conversion Tool and Snowflake Migration Accelerator automate syntax translation, embedded business logic still demands manual remediation. Financial institutions often run legacy and cloud warehouses in parallel for years, doubling operational costs while transition proceeds.
Skilled Talent Shortage in Real-Time Data Engineering
Enterprises struggle to recruit engineers proficient in stream processing frameworks such as Apache Kafka, Spark Structured Streaming, or Flink, extending project timelines. Hyperscalers are expanding training programs, AWS re:Start and Google Cloud Career Certificates to close skills gaps yet supply lags demand. Services partners report 6–9-month onboarding queues for senior real-time architects, pushing organizations to adopt serverless abstractions that mask complexity. Emerging markets feel the shortage most acutely, where local upskilling cannot match the pace of digital-transformation initiatives.
*Our forecasts treat driver/restraint impacts as directional, not additive. The impact forecasts reflect baseline growth, mix effects, and variable interactions.
Segment Analysis
By Deployment Model: Hybrid Gains Momentum Amid Sovereignty Pressures
Hybrid deployments captured a growing share as data gravity and residency mandates shaped architecture decisions. The active data warehousing market size for hybrid environments is forecast to expand at 10.12% CAGR through 2031. Organizations in China, India, and the European Union retain sensitive datasets on-premises while bursting analytical workloads to the cloud, balancing control with flexibility. Vendors offer cloud-managed clusters inside customer data centers, blurring lines between on-premises and hosted services. In parallel, pure-public cloud instances continue to scale transaction-heavy digital businesses, illustrating coexistence rather than displacement.
Cloud-connected appliances such as Oracle Exadata Cloud@Customer and AWS Outposts position on-premises deployment as a stepping stone, allowing low-latency access to operational systems while delegating management to the provider. Workload placement decisions increasingly consider egress fees: shipping petabytes of historical logs to cloud warehouses can outweigh compute savings, anchoring data in local facilities. As a result, hybrid flexibility becomes a long-term architectural default rather than an interim stage.


By Component: Services Surge As Complexity Outpaces Platform Maturity
The software layer still delivered 68.95% of 2025 revenue, yet professional and managed services now post the fastest growth, reflecting skills shortages and architectural complexity. The active data warehousing market share commanded by implementation, migration, and optimization services is poised to rise through 2031 as enterprises confront streaming ingestion, federated governance, and AI-driven tuning. Global system integrators scale headcount to meet demand, while specialized boutiques carve niches in regulated industries.
Services engagement models evolve toward outcome-based contracts tied to query-performance service level objectives and governance compliance KPIs. Platforms embed telemetry that feeds partner dashboards, enabling proactive optimization and automated cost control. Over time, knowledge codifies into accelerators and blueprints, marginally reducing engagement duration but not demand new features such as hybrid OLTP-OLAP workloads introduce fresh implementation challenges.
By Organization Size: SMEs Embrace Consumption Economics
Large enterprises remain the dominant buyers thanks to petabyte-scale data assets, yet SMEs represent the fastest growth cohort. Cloud credit-based billing converts fixed infrastructure costs into variable operational expenses, letting fledgling companies experiment with analytics before revenue scales. Serverless execution and auto-suspend features eliminate idle-cluster burn, aligning spend with workload bursts.
Adoption patterns differ SMEs favor SaaS connectors, visual query builders, and packaged governance over bespoke pipelines. Vendors respond with simplified SKUs, pre-bundled marketplace integrations, and template-driven dashboards. The active data warehousing market size attributed to SMEs is projected to widen as digital-native start-ups embed analytics into core products from inception rather than retrofitting warehouses later.
By Industry Vertical: Healthcare Accelerates Amid Interoperability Mandates
BFSI retained the largest 26.20% revenue share in 2025, powered by real-time risk scoring, liquidity monitoring, and regulatory reporting. Concurrently, healthcare delivers the top 10.72% CAGR as electronic health record interoperability and patient-access rules compel health systems to expose data through standardized APIs. Warehouses must process HL7 or FHIR event streams in milliseconds without compromising privacy, driving demand for encryption-in-use and fine-grained auditing.
Retailers expand same-hour delivery programs that rely on accurate stock and location data, reinforcing the case for sub-second inventory updates. Telecommunications carriers ingest billions of call detail records daily, pairing warehouse analytics with predictive algorithms that preempt network failures. In manufacturing, edge-to-cloud pipelines feed predictive maintenance models, shaving unscheduled downtime. These vertical nuances shape feature roadmaps, prompting vendors to release industry packs with pre-built schemas, compliance templates, and reference dashboards.
Geography Analysis
North America anchored 35.10% of 2025 spending, benefiting from dense hyperscaler footprints, a rich talent pool, and historically permissive cross-border data flows. State-level privacy statutes enacted in 2024, however, fragment policy and necessitate fine-grained residency controls similar to GDPR. Financial institutions migrate workloads in stages, citing 30-35% cost savings and faster model iteration once in cloud warehouses. The region also hosts the bulk of real-time engineering talent, sustaining innovation velocity.
Asia Pacific posts the strongest 10.45% CAGR through 2031. Digital transformation in China, India, and Indonesia creates petabyte-scale data lakes that outgrow legacy appliances. Localization mandates split architectures: citizen data remains in domestic regions while less sensitive workloads leverage global clouds. Hyperscalers deploy additional zones in Mumbai, Jakarta, and Seoul to address residency clauses, and manufacturers in Japan and South Korea adopt edge-processing frameworks to analyze IoT telemetry locally before central aggregation.
Europe operates under the extraterritorial GDPR and the 2024 Data Act, imposing third-party data-sharing requirements on industrial IoT assets. Compliance complexity favors vendors with deep legal and governance tooling. Germany’s industrial champions consolidate disparate warehouses into unified platforms to unlock AI training data while trimming infrastructure overhead. The United Kingdom maintains regulatory alignment via renewed adequacy agreements, yet enterprises hedge by dual-hosting datasets on both sides of the Channel.
The Middle East and Africa witness steady adoption led by national cloud strategies in the United Arab Emirates and Saudi Arabia that make cloud-first architecture mandatory for public agencies. South America’s growth centers on Brazil, where LGPD echoes GDPR principles and accelerates governance upgrades in both public and private sectors.

Competitive Landscape
Market concentration is moderate. The five largest vendors, Snowflake, AWS, Microsoft, Google, and Databricks controlled roughly 65% of 2024 cloud revenues, but open formats and multi-cloud strategies keep rivalry high. Hyperscalers leverage bundled pricing across compute, storage, and network services to undercut stand-alone offerings by 20-30% on total cost of ownership. Snowflake defends premium margins with multi-cluster workload isolation that ensures performance even at peak concurrency. Databricks pivots toward Apache Iceberg to commoditize storage, shifting differentiation to AI-optimized compute.
Transactional-analytical convergence intensifies competition. Snowflake Unistore supports operational updates alongside analytics, challenging established mixed-workload databases. Smaller players such as Firebolt deliver index-based engines for ad-hoc queries, and Yellowbrick excels in on-premises high-performance clusters for regulated industries. Generative AI embedded in Redshift and BigQuery narrows performance gaps, forcing suppliers to compete on governance, ecosystem breadth, and compliance attestations like ISO 27001 and SOC 2. Vendors without global legal teams face hurdles as regulatory complexity escalates.
Active Data Warehousing Industry Leaders
Teradata Corporation
Snowflake Inc.
Amazon Web Services Inc.
Microsoft Corporation
Google LLC
- *Disclaimer: Major Players sorted in no particular order

Recent Industry Developments
- October 2025: Google Cloud launched BigQuery Distributed Storage, separating metadata from columnar data blocks to provide 99.999% availability and cross-region replication for latency-sensitive workloads.
- July 2025: Databricks released Photon 4.0, a next-generation vectorized execution engine that doubles SQL performance on large joins and window functions while cutting compute costs by 35% in serverless SQL.
- May 2025: Snowflake made Unistore generally available across all regions and added zero-copy cloning for hybrid transactional-analytical tables, enabling real-time operational reporting without data movement.
- March 2025: Amazon Web Services introduced Redshift Quantum, a GPU-accelerated compute tier that delivers up to 4× faster analytical performance while retaining serverless, pay-per-query pricing.


Global Active Data Warehousing Market Report Scope
The Active Data Warehousing Market Report is Segmented by Deployment Model (On-Premises, Cloud, Hybrid), Component (Software, and Services), Organization Size (Small and Medium Enterprises, and Large Enterprises), Industry Vertical (Banking Financial Services and Insurance, Retail and Ecommerce, Telecommunications and IT, Healthcare and Life Sciences, Manufacturing, Government and Public Sector, Other Industry Vertical), and Geography (North America, Europe, Asia-Pacific, Middle East and Africa, South America). The Market Forecasts are Provided in Terms of Value (USD).
| On-Premises |
| Cloud |
| Hybrid |
| Software |
| Services |
| Small and Medium Enterprises (SMEs) |
| Large Enterprises |
| Banking, Financial Services and Insurance (BFSI) |
| Retail and Ecommerce |
| Telecommunications and IT |
| Healthcare and Life Sciences |
| Manufacturing |
| Government and Public Sector |
| Other Industry Vertical |
| North America | United States | |
| Canada | ||
| Mexico | ||
| Europe | Germany | |
| United Kingdom | ||
| France | ||
| Italy | ||
| Rest of Europe | ||
| Asia-Pacific | China | |
| Japan | ||
| India | ||
| South Korea | ||
| Australia | ||
| Rest of Asia-Pacific | ||
| Middle East and Africa | Middle East | Saudi Arabia |
| United Arab Emirates | ||
| Rest of Middle East | ||
| Africa | South Africa | |
| Egypt | ||
| Rest of Africa | ||
| South America | Brazil | |
| Argentina | ||
| Rest of South America | ||
| By Deployment Model | On-Premises | ||
| Cloud | |||
| Hybrid | |||
| By Component | Software | ||
| Services | |||
| By Organization Size | Small and Medium Enterprises (SMEs) | ||
| Large Enterprises | |||
| By Industry Vertical | Banking, Financial Services and Insurance (BFSI) | ||
| Retail and Ecommerce | |||
| Telecommunications and IT | |||
| Healthcare and Life Sciences | |||
| Manufacturing | |||
| Government and Public Sector | |||
| Other Industry Vertical | |||
| By Geography | North America | United States | |
| Canada | |||
| Mexico | |||
| Europe | Germany | ||
| United Kingdom | |||
| France | |||
| Italy | |||
| Rest of Europe | |||
| Asia-Pacific | China | ||
| Japan | |||
| India | |||
| South Korea | |||
| Australia | |||
| Rest of Asia-Pacific | |||
| Middle East and Africa | Middle East | Saudi Arabia | |
| United Arab Emirates | |||
| Rest of Middle East | |||
| Africa | South Africa | ||
| Egypt | |||
| Rest of Africa | |||
| South America | Brazil | ||
| Argentina | |||
| Rest of South America | |||


Key Questions Answered in the Report
How large is the active data warehousing market in 2026?
The active data warehousing market size is USD 11.8 billion in 2026.
What CAGR is expected through 2031?
The market is projected to expand at a 9.37% CAGR between 2026 and 2031.
Which deployment model is growing fastest?
Hybrid architectures post the strongest 10.12% CAGR as firms balance cloud scale with residency mandates.
Why is healthcare the fastest-growing vertical?
Interoperability mandates and real-time clinical decision support drive an 10.72% CAGR in healthcare and life sciences.
What restraints slow modernization?
High legacy-migration costs and a shortage of real-time data engineers create bottlenecks.
Which region shows the most robust growth?
Asia Pacific leads with a 10.45% CAGR thanks to data-localization laws and expanding digital economies.
Page last updated on:


