Data Observability Market Size and Share
Market Overview
| Study Period | 2020 - 2031 |
|---|---|
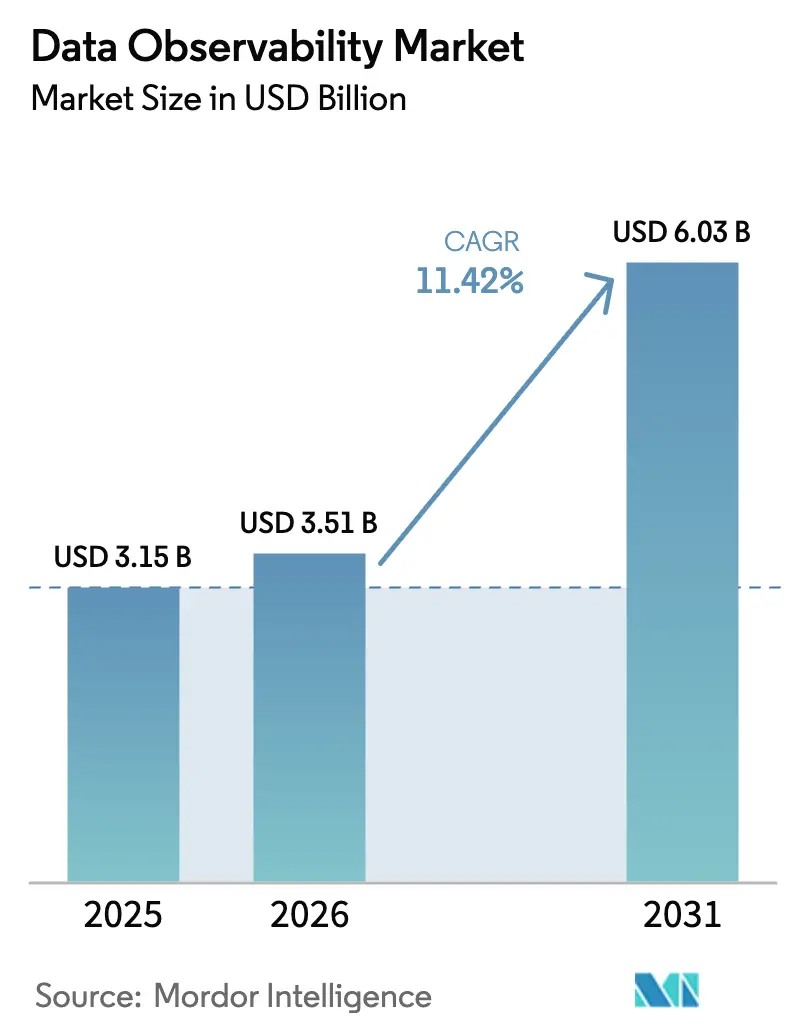
| Market Size (2026) | USD 3.51 Billion |
| Market Size (2031) | USD 6.03 Billion |
| Growth Rate (2026 - 2031) | 11.42% CAGR |
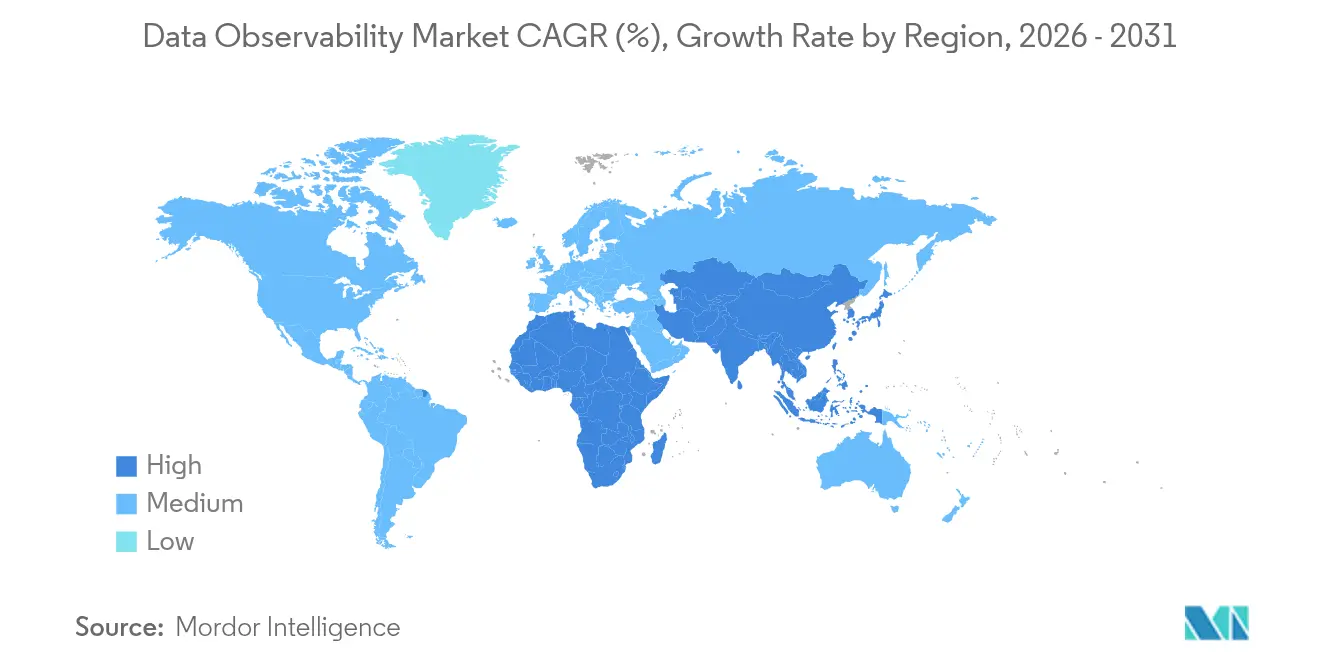
| Fastest Growing Market | Asia Pacific |
| Largest Market | North America |
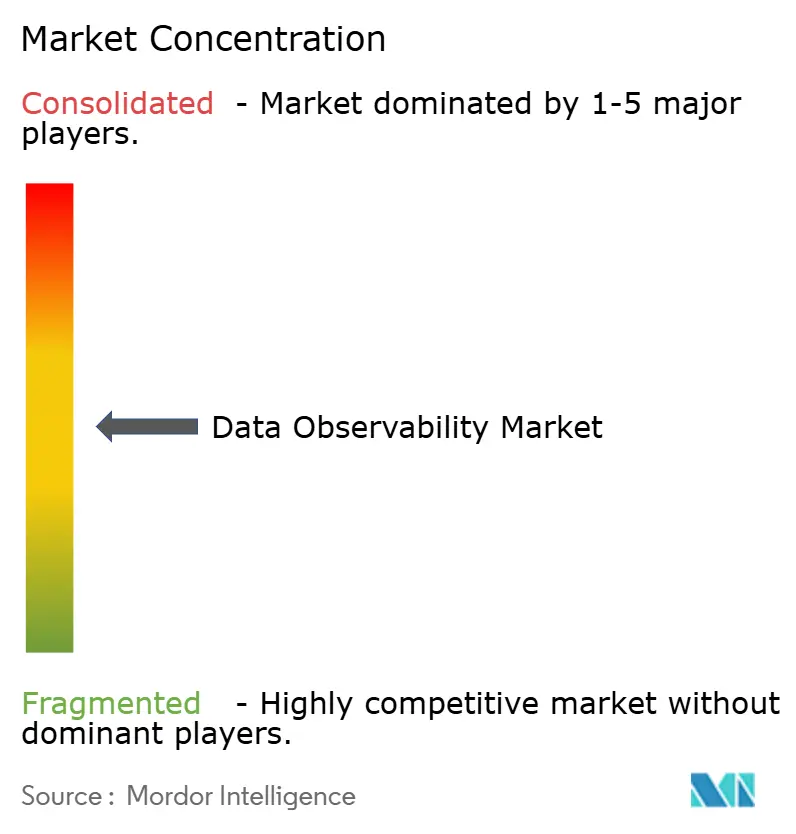
| Market Concentration | Medium |
Major Players *Disclaimer: Major Players sorted in no particular order Image © Mordor Intelligence. Reuse requires attribution under CC BY 4.0. | |
Data Observability Market Analysis by Mordor Intelligence
Data observability market size in 2026 is estimated at USD 3.51 billion, growing from 2025 value of USD 3.15 billion with 2031 projections showing USD 6.03 billion, growing at 11.42% CAGR over 2026-2031. Growth reflects a decisive shift from reactive monitoring to proactive data reliability engineering, accelerated by AI workloads that impose uncompromising quality standards and by compliance mandates such as the EU AI Act. Vendors are embedding real-time analytics, cloud-native instrumentation, and AI-driven root-cause analysis to help enterprises avoid downstream model failures and reputational damage. Adoption is strongest in North America, yet demand in Asia-Pacific is rising fastest as emerging economies deploy new data centers and modernize legacy stacks. Strategic acquisitions among platform providers signal market maturation, while open-source frameworks such as OpenTelemetry mitigate vendor lock-in and lower adoption barriers.
Key Report Takeaways
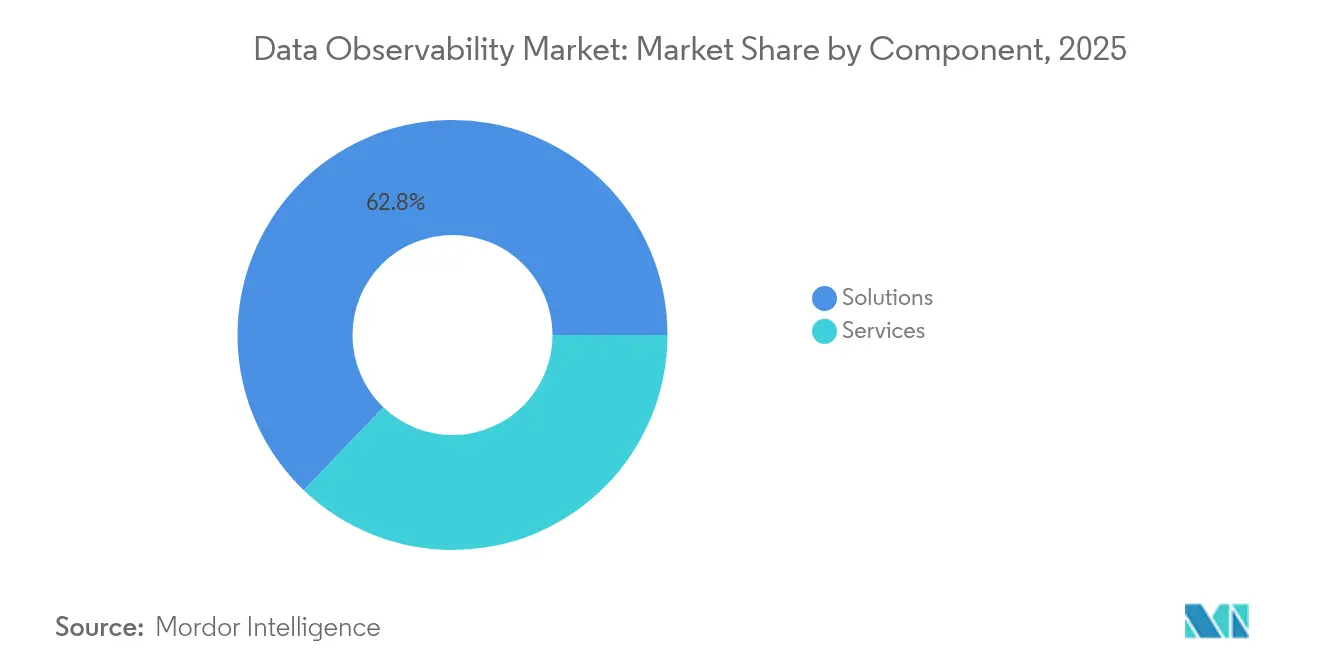
- By component, Solutions dominated with 62.84% of the data observability market share in 2025; Services are projected to expand at a 20.22% CAGR through 2031.
- By deployment model, Public Cloud led with 69.55% share in 2025, while Hybrid Cloud adoption is forecast to rise at a 24.05% CAGR to 2031.
- By end-user industry, BFSI led with 22.05% share in 2025, while Healthcare and Life Sciences is forecast to rise at a 20.85% CAGR to 2031.
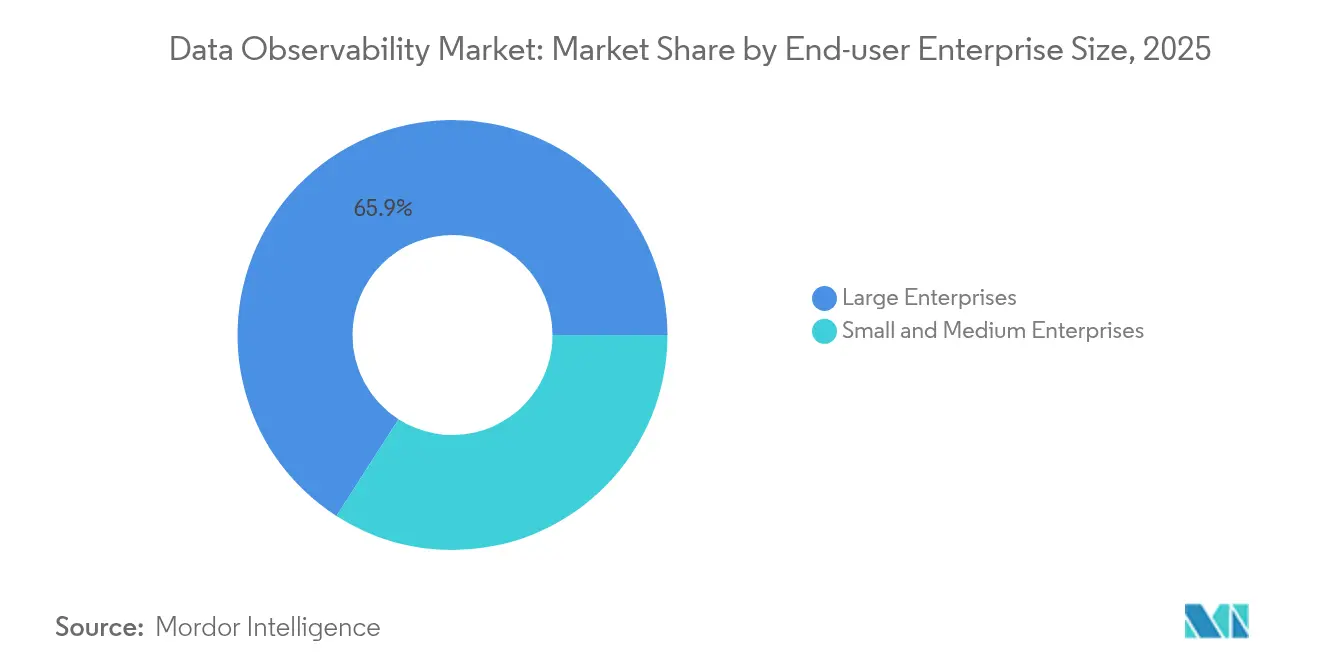
- By end-user enterprise size, large enterprises held 65.92% share in 2025, while SMEs is forecast to rise at a 17.55% CAGR to 2031.
- By data-pipeline type, Batch Processing accounted for 53.60% of the 2025 data observability market size; Streaming/Real-time is set to grow at a 27.45% CAGR.
- By geography, North America retained 38.12% revenue share in 2025, whereas Asia-Pacific is projected to post an 18.15% CAGR to 2031.
Note: Market size and forecast figures in this report are generated using Mordor Intelligence’s proprietary estimation framework, updated with the latest available data and insights as of 2026.
Global Data Observability Market Trends and Insights
Drivers Impact Analysis*
| Driver | (~) % Impact on CAGR Forecast | Geographic Relevance | Impact Timeline |
|---|---|---|---|
| Acceleration of cloud-native data pipelines | +2.8% | Global, North America and Asia-Pacific | Medium term (2-4 years) |
| Proliferation of AI/ML demands for reliable data | +3.2% | Global, North America and EU | Short term (≤ 2 years) |
| Intensifying compliance with data-governance frameworks | +2.1% | EU and North America, expanding to Asia-Pacific | Long term (≥ 4 years) |
| Rise of data contracts fostering proactive observability | +1.8% | North America and EU first movers, global expansion | Medium term (2-4 years) |
| Growing adoption of LLMOps with deep lineage needs | +2.5% | Global tech hubs | Short term (≤ 2 years) |
| OpenTelemetry standardization cutting vendor lock-in | +1.9% | Global | Medium term (2-4 years) |
| Source: Mordor Intelligence | |||
Acceleration of Cloud-Native Data Pipelines
Enterprises executing multi-cloud strategies require observability tooling that can instrument microservices, event streams, and serverless functions in near real time. Ninety-seven percent of global companies now operate connected cloud estates, exposing brittle hand-built monitors that miss cross-node anomalies[1]VMware Tanzu, “State of Cloud-Native Survey 2025,” tanzu.vmware.com. Telemetry volume is climbing 35% each year, forcing buyers to prioritize intelligent sampling, tiered retention, and cost analytics. Unified control planes that aggregate metrics, traces, and lineage across Kubernetes clusters deliver tangible ROI by cutting mean time to resolution and avoiding data-driven AI model drift.
Proliferation of AI/ML Demands for Reliable Training Data
Generative AI models magnify the cost of poor data quality; the average enterprise incurred USD 12.9 million in losses in 2024 due to undetected errors. LLMOps teams now operationalize the MOOD stack—Models, Observability, Orchestration, Data—to perform continuous lineage validation and bias detection. Organizations managing more than 1,000 concurrent models depend on event-driven alerts to flag schema shifts before training cycles commence. Standardization efforts around OpenTelemetry for AI workloads are gaining consensus, with 76% of adopters citing vendor neutrality as a core benefit.
Intensifying Compliance with Data-Governance Frameworks
The EU AI Act designates healthcare, finance, and transport algorithms as high-risk, compelling controllers to maintain granular logs of data origin, preprocessing steps, and access history. Non-compliance can trigger fines up to 4% of global turnover, catalyzing enterprise investment in audit-ready observability baselines [2]Publications Office of the European Union, “Regulation ( EU) 2024/1234 on Harmonised Rules for Artificial Intelligence,” eur-lex.europa.eu. In parallel, U.S. regulators cite continuous monitoring in emerging AI risk-management frameworks, while NIST drafts a Data Governance Profile that elevates lineage, reproducibility, and quality scoring as core controls.
Rise of Data Contracts Fostering Proactive Observability
Formal agreements between data producers and consumers now sit at the heart of federated architectures. Schemas, timeliness thresholds, and quality SLAs are codified into CI/CD pipelines; automated scanners flag deviations at commit time, avoiding downstream service failures. Early adopters report up to 40% fewer incident tickets after contract enforcement, reallocating engineering effort from break-fix to feature delivery. Vendors are integrating contract compliance views into lineage graphs so operators can visualize breach cascades across business domains.
Restraints Impact Analysis*
| Restraint | (~) % Impact on CAGR Forecast | Geographic Relevance | Impact Timeline |
|---|---|---|---|
| Persistent data-privacy and sovereignty concerns | -1.5% | Global, pronounced in EU and Asia-Pacific | Long term (≥ 4 years) |
| Integration complexity across heterogeneous stacks | -2.2% | Global, large enterprises | Medium term (2-4 years) |
| Skills shortage in data engineering | -1.8% | Global | Medium term (2-4 years) |
| Cost optimization pressures on telemetry retention | -1.6% | Global | Short term (≤ 2 years) |
| Source: Mordor Intelligence | |||
Persistent Data-Privacy and Sovereignty Concerns
Stringent localization laws in China and India limit outbound telemetry, compelling enterprises to deploy regional collectors with on-premise storage and anonymization layers before central aggregation. Conflicting frameworks such as GDPR, CCPA, and Brazil’s LGPD create multilateral approval workflows that slow rollouts and inflate compliance budgets. Edge computing pushes processing closer to data sources, yet operators must still prove end-to-end visibility without moving sensitive payloads across borders.
Integration Complexity Across Heterogeneous Stacks
Enterprises juggle five or more monitoring tools that lack common schemas, producing dashboard sprawl and blind spots. Legacy mainframes, proprietary middleware, and polyglot databases require custom instrumentation, stretching scarce platform teams. Hybrid topologies demand correlation of on-premises SNMP metrics with SaaS trace data, a feat few organizations automate today. OpenTelemetry adoption is easing friction, yet the skills gap persists; 48% of firms report unfilled observability engineering roles, elongating time-to-value.
*Our forecasts treat driver/restraint impacts as directional, not additive. The impact forecasts reflect baseline growth, mix effects, and variable interactions.
Segment Analysis
By Component: Services Surge Amid Platform Maturation
Solutions retained 62.84% of 2025 revenue, indicating that full-stack platforms, data-quality monitors, and lineage graphs form the essential toolset at the core of the data observability market. Services are expanding at a 20.22% CAGR as enterprises seek turnkey deployments that mitigate integration risk and speed compliance audits. Professional advisories focus on mapping data contracts to business SLAs, while managed offerings deliver 24 × 7 operation, automated upgrades, and consumption-based billing.
AI-powered anomaly detection is transitioning from add-on to standard capability, with vendors embedding vector search and causal inference to surface leading indicators of drift. Demand for cost and usage analytics is also growing as telemetry retention regulations tighten. Lineage modules now integrate bias-detection scores to align with the EU AI Act. The services boom underscores market maturation: customers recognize that specialist partners cut rollout time by half compared with in-house builds, freeing engineers for product development rather than tool maintenance.


By Deployment Model: Hybrid Cloud Emerges as Strategic Choice
Public Cloud captured 69.55% of 2025 spending because SaaS models remove the capital cost of time-series data stores and tracing back-ends. Yet hybrid strategies, forecast to grow 24.05% annually, address data residency, zero-trust security, and latency-sensitive AI inference on premises. Vendors respond with deployment-agnostic agents and control planes that deliver identical dashboards whether collectors stream to regional SaaS clusters or to self-hosted stores behind firewalls.
Edge nodes add complexity: observability traffic must traverse constrained bandwidth links without sacrificing granularity. Buyers prioritize compression, local caching, and adaptive sampling to limit egress fees.
By End-User Industry: Healthcare Leads Digital Transformation
BFSI remains a heavy spender, holding 22.05% of revenue, with fraud models and Basel compliance driving near-real-time anomaly detection. However, Healthcare and Life Sciences are advancing at a 20.85% CAGR, the steepest of any sector, propelled by telemedicine, electronic health records, and AI-assisted diagnostics that cannot tolerate data drift. Lineage graphs map source-to-sink transformations to satisfy FDA clinical-decision guidance and ISO 13485 quality management audits.
Manufacturing leverages streaming sensor telemetry for predictive maintenance, while Retail deploys observability to ensure personalization algorithms receive accurate inventory and clickstream feeds. Each vertical prioritizes domain-specific extensions—HIPAA redaction policies in Healthcare, FIX protocol parsers in Capital Markets—supporting vendor specialization.
By End-user Enterprise Size: SMEs Drive Democratization
Large Enterprises owned 65.92% of expenditure in 2025 because they operate the sprawling data estates that generate the highest compliance exposure. Small and Medium Enterprises are forecast to grow at 17.55% CAGR as SaaS licensing, auto-instrumentation, and pay-as-you-scale tiers erase historical barriers. Large Enterprises continue to wrestle with heterogenous estates and strict sovereign-cloud mandates, often opting for hybrid collectors and tier-1 service engagements. Skills shortages are more acute for SMEs; therefore, vendors bundle wizard-driven policy builders and automated root-cause insights that obviate the need for resident site-reliability engineers.
Seventy-two percent of SMEs already base strategic decisions on data, and 18% rolled out generative AI within one year of ChatGPT’s launch, amplifying quality risks . SaaS observability consoles with guided setup shorten deployment from weeks to hours, while preset dashboards aid business users in interpreting anomaly events without deep DevOps expertise.
By Data-Pipeline Type: Real-Time Processing Transforms Operations
Batch workflows maintained a 53.60% share in 2025, yet streaming pipelines are accelerating at 27.45% CAGR as organizations pursue instant personalization and operational AI. Apache Kafka clusters now act as both telemetry transport and analytics engine, with firms citing 40% faster incident resolution when real-time observability is in place.
Hybrid Lambda patterns blend batch durability with streaming agility, requiring instrumentation that stitches together Spark jobs, Flink streams, and object-store lakehouses. Edge compute pushes inference to factories and storefronts, making low-latency alerting essential. Vendors offer lightweight collectors that operate offline and reconcile once connectivity resumes, ensuring continuous lineage despite intermittent links.
Geography Analysis
North America commanded 38.12% of 2025 revenues thanks to mature hyperscale cloud regions, early AI adoption, and robust financial-services regulation. Enterprises prioritize SOC 2-ready observability stacks and integrate lineage trackers with Sarbanes-Oxley audit workflows. Federal agencies are piloting AI risk-management frameworks that explicitly call for continuous data quality scoring, lifting public-sector demand.
Asia-Pacific is the fastest-growing geography, projected at 18.15% CAGR, driven by green-field data-center builds in India, Indonesia, and Vietnam. Government grants promote AI adoption for smart-city and manufacturing 4.0 programs, making observability part of tender requirements. However, tool fragmentation remains high; APAC firms run a median of nine monitoring products, doubling the global average, inflating outage costs to USD 19.07 million annually. Vendors that offer end-to-end suites with local language support and consumption pricing are gaining share.
Europe is steady but compliance-intensive: GDPR and the EU AI Act elevate data-observability budgets despite macroeconomic caution. Financial regulators demand real-time dashboards of algorithmic-trading inputs, forcing banks to log every schema change and pipeline failure. Data sovereignty rules spur uptake of regional SaaS clusters hosted in Frankfurt, Paris, and Milan, while cross-border fragmentation complicates tool consolidation.Latin American and African markets are earlier in the curve but exhibit rising SaaS adoption as telecom operators build 5G backbones and extend public-cloud on-ramps. Localized compliance frameworks, such as Brazil’s LGPD, mirror GDPR provisions and accelerate demand for end-to-end lineage trackers that simplify assessments. Partnerships with regional systems integrators are crucial for vendors expanding in these markets.

Competitive Landscape
The data observability market is moderately consolidated. Datadog’s USD 23 million purchase of Metaplane augments its APM heritage with schema-drift detection, signaling a platform converge strategy [5]Datadog, “Datadog Acquires Metaplane to Expand Data Observability Capabilities,” datadoghq.com. ClickHouse absorbed HyperDX to fuse columnar analytics with session replay in an open-source stack, targeting price-sensitive buyers. Snowflake invested in ecosystem startups to deepen telemetry ingestion into its data cloud, while Dynatrace introduced Grail lake-house extensions that normalize logs and lineage under a single schema.
Competitive differentiation pivots on AI automation, open-standards adherence, and TCO management. Pure-play vendors like Monte Carlo and Acceldata double down on probabilistic anomaly models and domain-specific data health dashboards. Incumbent APM suites emphasize unified licensing and cross-domain correlation spanning application, infrastructure, and data layers. Cloud service providers embed native collectors into managed warehouses, creating one-click onboarding but raising portability questions.
White-space opportunities include edge observability at satellite-connected sites, real-time contract validation for decentralized data meshes, and vertical solutions that encapsulate regulatory workflows. Consumption-based pricing and open-core packaging empower challenger brands to penetrate cost-conscious segments, especially among SMEs and emerging-market buyers. The rising adoption of OpenTelemetry lowers switching costs, compelling vendors to compete on insight accuracy, remediation guidance, and ecosystem partnerships rather than proprietary agents.
Data Observability Industry Leaders
Dynatrace LLC.
IBM Corporation
Datadog, Inc.
Splunk Inc.
Monte Carlo Data Inc.
- *Disclaimer: Major Players sorted in no particular order

Recent Industry Developments
- April 2025: Monte Carlo launched AI agents that generate monitoring rules and diagnose root causes autonomously.
- April 2025: Datadog acquired Metaplane, adding end-to-end data-quality monitoring to its observability cloud.
- March 2025: Actian introduced Actian Data Observability, applying AI to automate anomaly detection and speed resolution cycles.
- March 2025: ClickHouse bought HyperDX to integrate session replay, logs, metrics, and traces into its open-source platform


Research Methodology Framework and Report Scope
Market Definitions and Key Coverage
Our study defines the data observability market as all commercially sold software and related managed-service offerings that monitor, trace, and diagnose data quality, lineage, and pipeline performance across on-premises, cloud, and hybrid environments. Data reliability platforms, schema-drift monitors, anomaly detection tools, and automated alerting engines are fully included in this scope.
Scope exclusion: Stand-alone application-performance-management or log analytics tools that lack explicit data-layer observability are not covered.
Segmentation Overview
- By Component
- Solutions
- Platform
- Data-Quality Monitoring
- Lineage and Cataloging
- Usage and Cost Analytics
- Services
- Professional Services
- Managed Services
- Solutions
- By Deployment Model
- Public Cloud (SaaS)
- Private Cloud
- Hybrid Cloud
- By End-user Industry
- BFSI
- IT and Telecom
- Government and Public Sector
- Energy and Utilities
- Manufacturing
- Healthcare and Life Sciences
- Retail and Consumer Goods
- Media and Entertainment
- Logistics and Transportation
- By End-user Enterprise Size
- Large Enterprises
- Small and Medium Enterprises
- By Data-Pipeline Type
- Batch Processing
- Streaming / Real-time
- Lambda / Hybrid
- By Geography
- North America
- United States
- Canada
- Mexico
- South America
- Brazil
- Argentina
- Rest of South America
- Europe
- Germany
- United Kingdom
- France
- Italy
- Spain
- Russia
- Rest of Europe
- Asia-Pacific
- China
- Japan
- India
- South Korea
- Australia and New Zealand
- Rest of Asia-Pacific
- Middle East and Africa
- Middle East
- Saudi Arabia
- United Arab Emirates
- Turkey
- Rest of Middle East
- Africa
- South Africa
- Nigeria
- Egypt
- Rest of Africa
- Middle East
- North America
Detailed Research Methodology and Data Validation
Desk Research
We collected foundational metrics from public sources such as Eurostat, US Census ICT surveys, the OECD Digital Economy outlooks, and industry associations like the Cloud Native Computing Foundation. Regulatory texts (for example, the EU AI Act), patent analytics from Questel, and company 10-Ks supplied trend signals on adoption, pricing, and spending. Additional context on enterprise deployment counts flowed in through subscription databases including D&B Hoovers and Dow Jones Factiva. The sources cited here illustrate, not exhaust, the wider set we sifted through for corroboration and gap filling.
A second pass mapped raw indicators, cloud-data-warehouse capacity shipments, Spark workload jobs, and OpenTelemetry download volumes to the segmentation boundaries revealed in the Table of Contents, ensuring desk inputs mirrored the report's scope.
Primary Research
Mordor analysts interviewed cloud architects, data-platform leads, and observability product managers across North America, Europe, and Asia-Pacific. These conversations validated pricing spreads, average pipeline counts per enterprise, and emerging buying triggers that secondary sources only hinted at.
Market-Sizing & Forecasting
We built a top-down demand pool using global enterprise analytics spending, allocating shares by pipeline prevalence and data-engineer headcount ratios, which are then stress-tested through sampled vendor average-selling-price multiplied by deployment counts. Key variables like cloud migration rates, AI model adoption, open-source telemetry standards uptake, and mean data failure incidents per TB drive the model. Multivariate regression links these inputs to revenue outcomes and projects them to 2030, while small bottom-up cross-checks from supplier roll-ups temper overshoots and plug data gaps.
Data Validation & Update Cycle
Outputs face variance checks against independent spending indices; anomalies prompt an analyst re-review before sign-off. Mordor Intelligence refreshes every twelve months, issuing interim revisions when major vendor guidance or regulatory shifts alter demand outlooks.
Why Mordor's Data Observability Baseline Drives Confident Decisions
Published figures differ because firms choose distinct feature sets, conversion currencies, and refresh cadences. Some count only software licenses, while others lump in consulting hours; a few still rely on pre-cloud uptake assumptions.
Key gap drivers here include (a) narrower service coverage, (b) single-region sampling that skews global totals, and (c) aggressive or conservative pipeline growth multipliers untested by expert interviews. Our disciplined scope alignment and annual model rebuild minimize such drift.
Benchmark comparison
| Market Size | Anonymized source | Primary gap driver |
|---|---|---|
| USD 3.15 B (2025) | Mordor Intelligence | - |
| USD 2.37 B (2024) | Global Consultancy A | Excludes managed services and hybrid deployments |
| USD 2.94 B (2025) | Industry Association B | Uses fixed ASP, omits Asia-Pacific mid-market demand |
| USD 2.30 B (2023) | Regional Consultancy C | Outdated base year and limited primary validation |
These contrasts show that our balanced variable set, timely updates, and dual-path validation give decision-makers a transparent, repeatable, and therefore more dependable market baseline.


Key Questions Answered in the Report
What is the current size of the data observability market?
The data observability market stands at USD 3.51 billion in 2026 and is projected to reach USD 6.03 billion by 2031.
Which region is growing fastest?
Asia-Pacific is expanding at an 18.15% CAGR, driven by rapid digital transformation and new data-center capacity.
Why are services outpacing solutions in growth?
Services grow at 20.22% CAGR because organizations prefer managed deployments that overcome integration complexity and skills shortages.
How does the EU AI Act influence observability spending?
The Act mandates comprehensive data lineage and quality logging for high-risk AI systems, compelling enterprises to invest in audit-ready observability frameworks.
What deployment model attracts the highest growth?
Hybrid Cloud leads future growth at 24.05% CAGR as firms balance public-cloud scalability with on-premises data-sovereignty needs.
How is OpenTelemetry shaping vendor competition?
Broad OpenTelemetry adoption standardizes instrumentation, lowers switching costs, and pushes vendors to compete on AI analytics accuracy rather than proprietary agents.
Page last updated on:


