Data Labeling Market Size and Share
Market Overview
| Study Period | 2020 - 2031 |
|---|---|
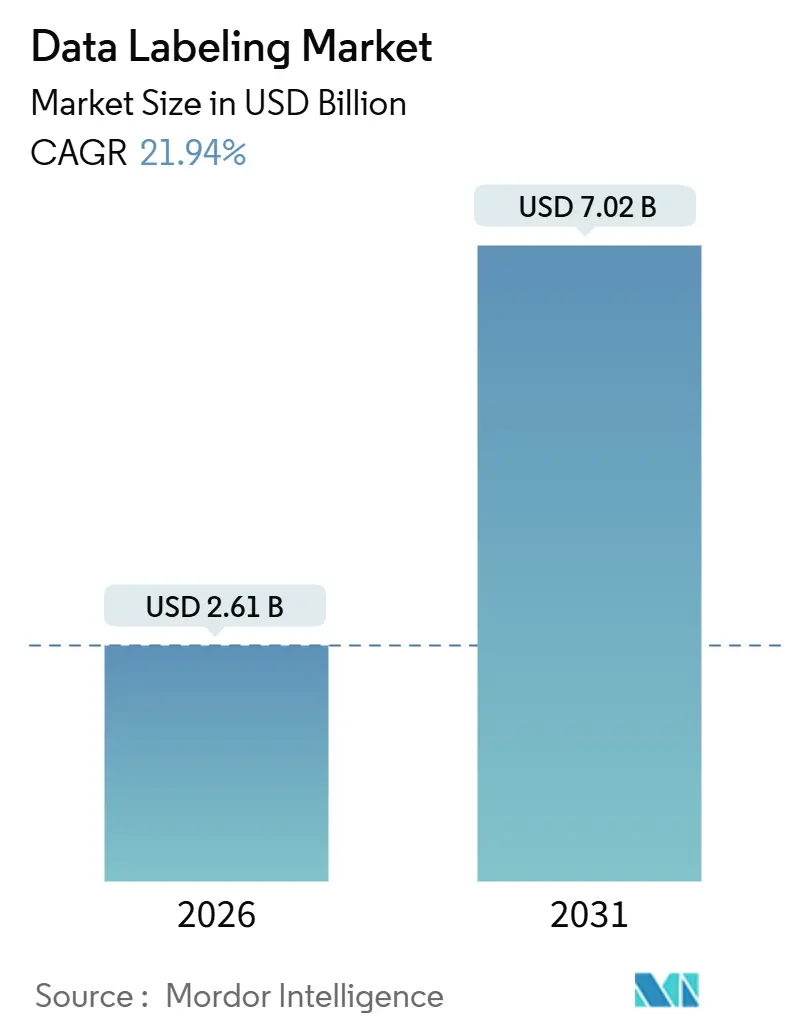
| Market Size (2026) | USD 2.61 Billion |
| Market Size (2031) | USD 7.02 Billion |
| Growth Rate (2026 - 2031) | 21.94% CAGR |
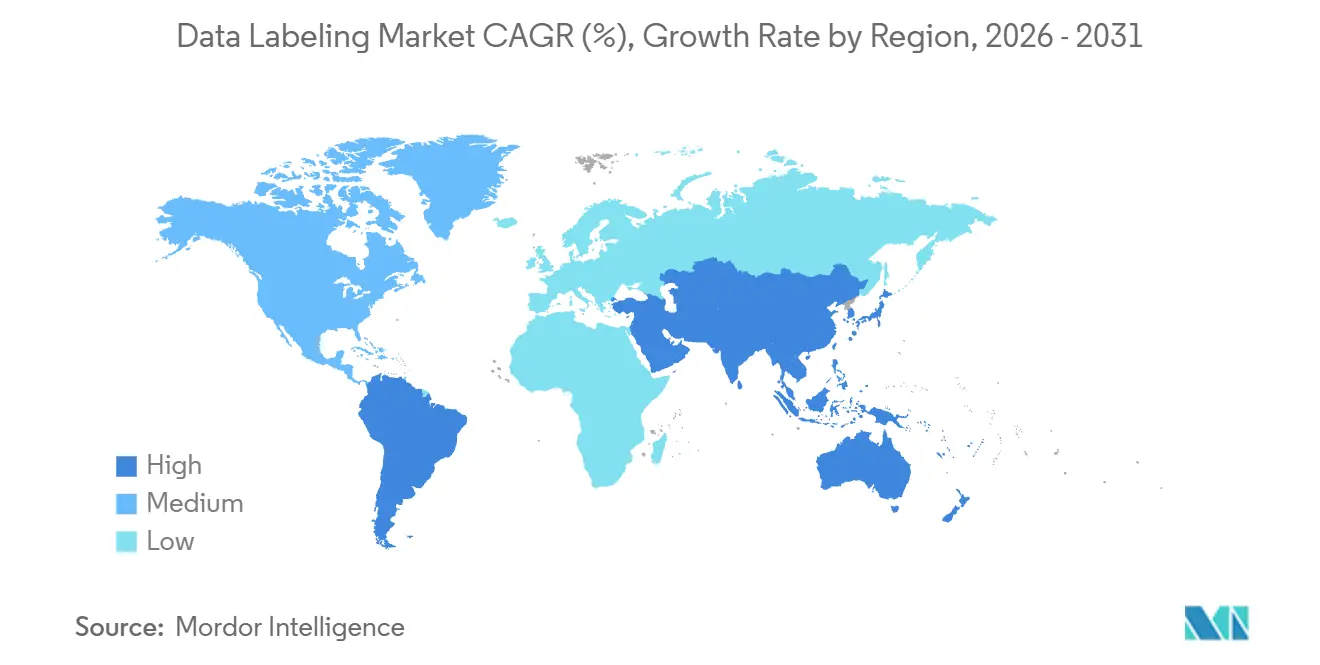
| Fastest Growing Market | Asia Pacific |
| Largest Market | North America |
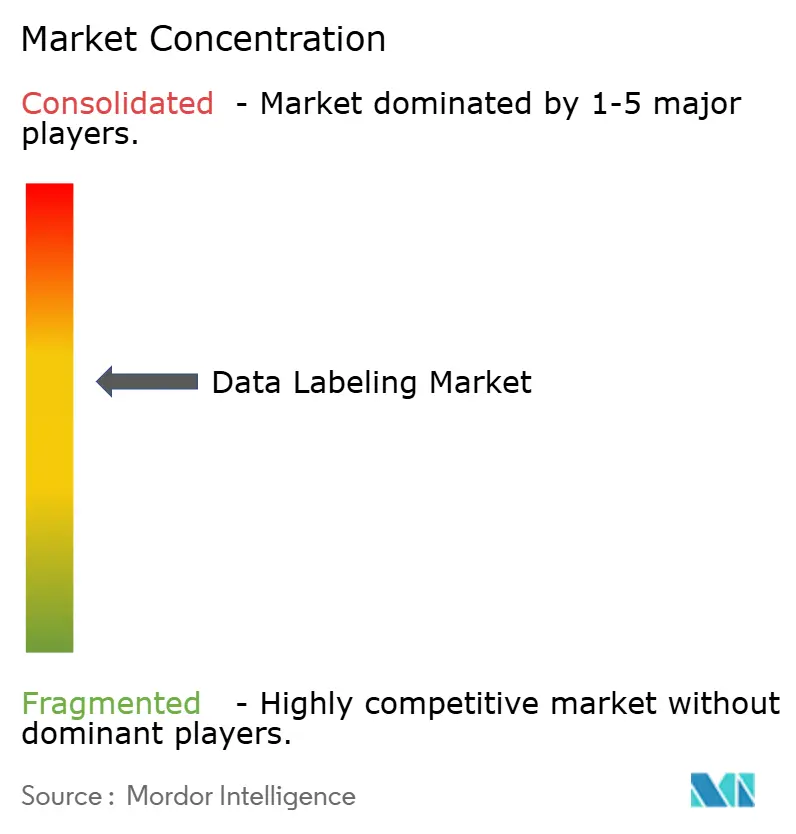
| Market Concentration | Medium |
Major Players *Disclaimer: Major Players sorted in no particular order Image © Mordor Intelligence. Reuse requires attribution under CC BY 4.0. | |
Data Labeling Market Analysis by Mordor Intelligence
The data labeling market size stands at USD 2.61 billion in 2026 and is projected to climb to USD 7.02 billion by 2031, reflecting a robust 21.94% CAGR. This rise is fueled by three intertwined catalysts. Foundation-model developers hunting for expert-curated corpora that trim hallucinations, automotive manufacturers validating sensor-fusion stacks that require frame-level 3D tags, and industrial firms scaling predictive-maintenance AI that depends on labeled time-series fault data. Meta’s USD 15 billion outlay for Scale AI in June 2025 crystallized labeling infrastructure as a strategic moat rather than a commoditized service, spurring OpenAI and Google to diversify their annotation vendors. Video annotation for autonomous systems, hybrid sourcing models that meld in-house expertise with outsourced labor, and self-supervised labeling pipelines that lower per-label costs are all expanding faster than the broader data labeling market, creating room for platforms that synchronize human specialists and model-assisted tagging. North America remains the revenue anchor, but Asia Pacific’s policy-driven push for industrial AI is reshaping regional dynamics.
Key Report Takeaways
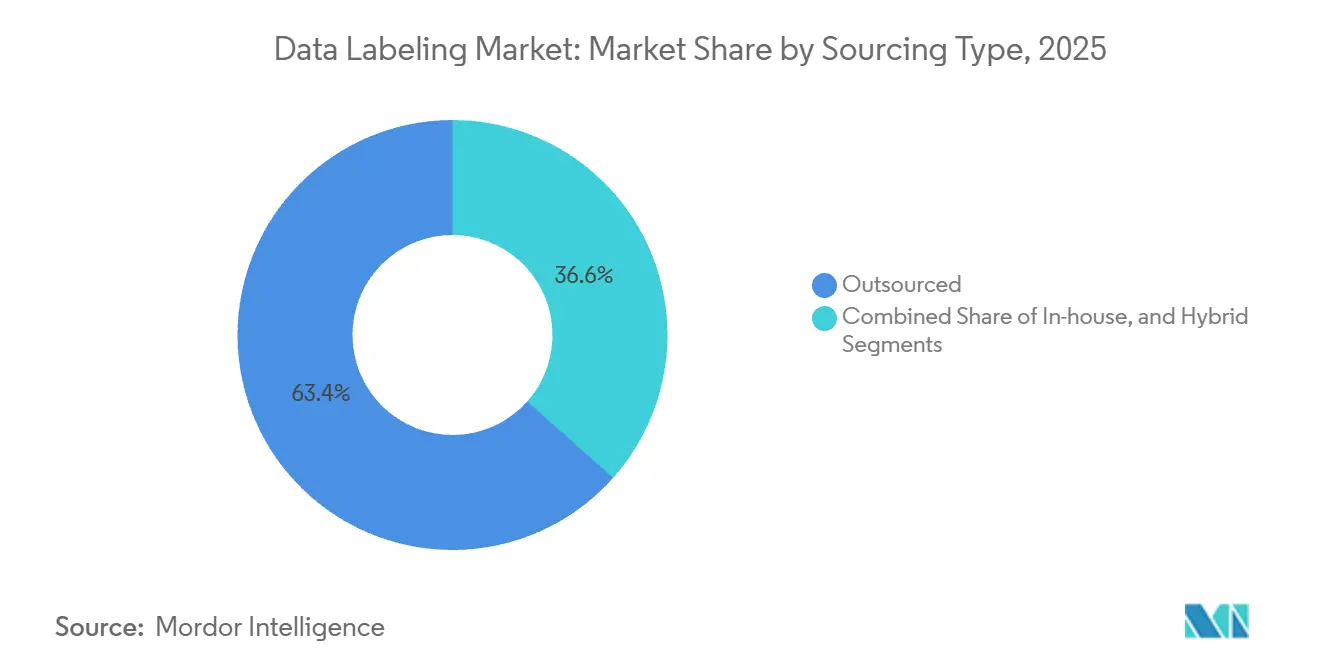
- By sourcing type, outsourced labeling led with 63.43% of the data labeling market share in 2025, while hybrid sourcing is advancing at a 22.48% CAGR through 2031.
- By data type, image datasets captured a 36.26% share in 2025; video annotation is on track for a 23.17% CAGR to 2031.
- By labeling approach, manual labeling accounted for 42.31% of the data labeling market size in 2025, yet self-supervised and programmatic techniques are growing at a 22.16% CAGR.
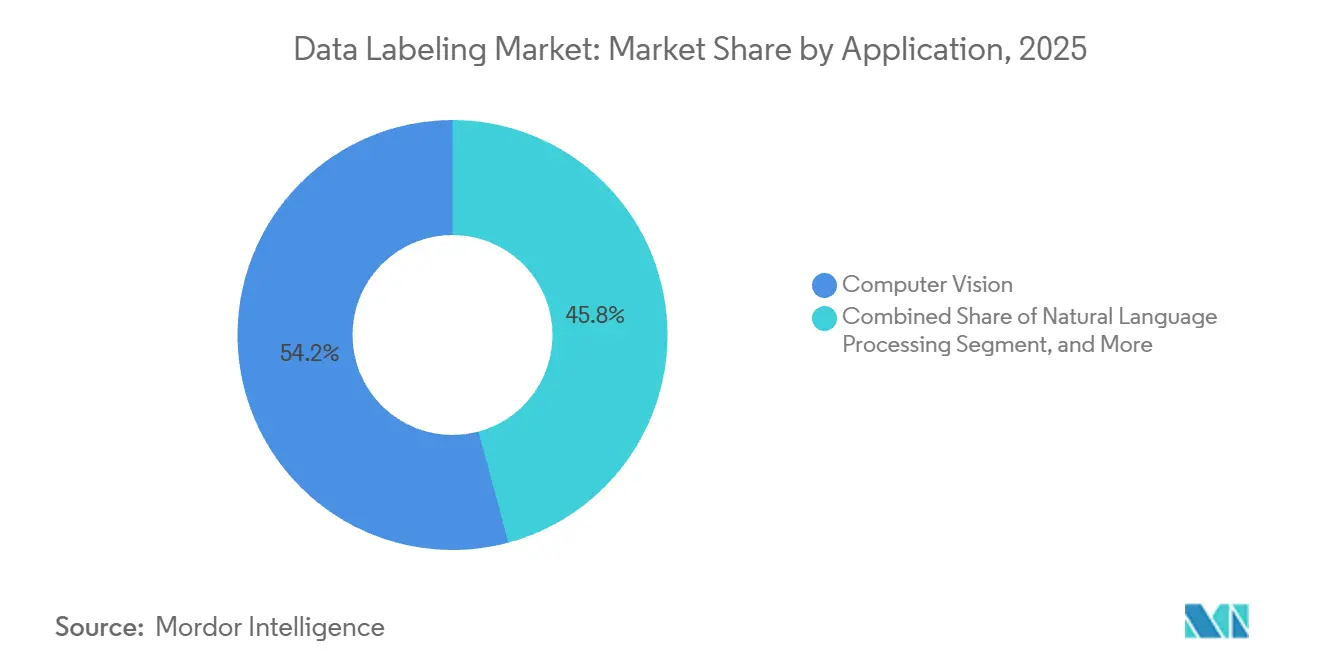
- By application, computer vision applications commanded a 54.19% share in 2025, whereas predictive maintenance and quality assurance showed the fastest 22.61% CAGR through 2031.
- By end-user industry, automotive and transportation held a 28.26% share in 2025; industrial and manufacturing is the fastest-growing at a 22.84% CAGR.
- By geography, North America contributed 31.13% of revenue in 2025, but the Asia Pacific is the fastest-growing region at 21.16% CAGR.
Note: Market size and forecast figures in this report are generated using Mordor Intelligence’s proprietary estimation framework, updated with the latest available data and insights as of January 2026.
Global Data Labeling Market Trends and Insights
Drivers Impact Analysis*
| Driver | (~) % Impact on CAGR Forecast | Geographic Relevance | Impact Timeline |
|---|---|---|---|
| Rapid Uptake of ADAS and Autonomous-Driving Vision Data | +5.2% | Global, focused in North America, Europe, China | Medium term (2-4 years) |
| Generative-AI Boom Spurring Multi-Modal Dataset Demand | +6.8% | Global, led by North America and Asia Pacific | Short term (≤ 2 years) |
| Advances in Big-Data ML Pipelines | +3.1% | Global | Medium term (2-4 years) |
| Medical-Imaging AI Adoption | +2.9% | North America, Europe, Asia Pacific | Medium term (2-4 years) |
| Edge Micro-Labeling for Synthetic-Data Validation | +1.7% | Global, early uptake in North America and Europe | Long term (≥ 4 years) |
| Regulation-Driven Explainable-AI Provenance Metadata | +2.3% | Europe, North America, China | Medium term (2-4 years) |
| Source: Mordor Intelligence | |||
Rapid Uptake of ADAS and Autonomous-Driving Vision Data
Automotive sensor suites now stream terabytes of multimodal data every day, and the data labeling market depends on precise tags to unlock Level 3 and Level 4 autonomy. Waymo’s public release showed vehicle average precision rising from 29.7% with 10% of training data to 49.4% with full data, proving that label scale and geographic diversity directly influence perception accuracy. Japan’s RoAD to L4 initiative and its electric-vehicle charging build-out will spawn new sensor logs that need regional-specific tags. Original equipment manufacturers are shifting from raw volume to per-frame quality, raising demand for synchronized LiDAR-camera labeling tools and automotive-grade validation workflows.
Generative-AI Boom Spurring Multi-Modal Dataset Demand
Foundation-model builders now favor smaller, expertly labeled corpora that suppress hallucinations and enable domain-specific tuning. Scale AI disclosed that 90% of its 2024 revenue stemmed from generative-AI projects, and Meta’s USD 15 billion stake underscores the premium on provenance-controlled datasets. China’s January 2026 work plan to integrate AI into 20 industries amplifies need for curated conversational, dialogue, and instruction-following corpora. Higher wages for lawyers, doctors, and linguists now reaching USD 60 per hour are bifurcating supply into specialized and commodity tiers, favoring platforms that manage both skill bands with transparent audit trails.
Advances in Big-Data ML Pipelines
Enterprises increasingly version labeled datasets inside continuous-integration workflows. Japan’s AI Bridging Cloud Infrastructure allocates 40-80 nodes for 60-day language-model projects that rely on domain-expert tags and immutable provenance records. India’s 2025 roadmap calls for standardized machine-data protocols and national digital backbones, accelerating demand for labeling APIs that push quality metrics into DevOps dashboards.[1]NITI Aayog, “Reimagining Manufacturing: India’s Roadmap to Global Leadership in Advanced Manufacturing,” niti.gov.in Vendors offering programmatic ingest, weak-supervision hooks, and drift monitoring are edging out legacy annotation shops.
Medical-Imaging AI Adoption
Radiology and pathology departments worldwide need HIPAA-compliant datasets checked by clinicians before regulators approve AI devices. The U.S. FDA has approved dozens of imaging algorithms since 2024, each requiring labeled ground-truth scans. Japan’s research agency, RIKEN, is training life-science foundation models on curated clinical data that require transparent audit trails. Hospitals are therefore turning to niche vendors that combine radiologists-in-the-loop with ISO-certified quality systems.
Restraints Impact Analysis*
| Restraint | (~) % Impact on CAGR Forecast | Geographic Relevance | Impact Timeline |
|---|---|---|---|
| Shortage of Skilled Annotators and Rising Labor Costs | -3.4% | Global, acute in North America and Europe | Short term (≤ 2 years) |
| Escalating Data-Privacy and Sovereignty Mandates | -2.8% | Europe, China, emerging in North America | Medium term (2-4 years) |
| Sustainability Pressure on Hyperscale-Annotation Energy Use | -0.9% | Global, led by Europe | Long term (≥ 4 years) |
| Self- and Weak-Supervised Learning Eroding Manual-Label Spend | -4.1% | Global, early adoption in North America and Asia Pacific | Medium term (2-4 years) |
| Source: Mordor Intelligence | |||
Shortage of Skilled Annotators and Rising Labor Costs
The pivot toward domain-expert tagging has exposed a talent bottleneck. Scale AI now pays USD 30-60 per hour to PhD-level annotators after criticism of its crowd-sourced pay rates, lifting cost baselines across vendors. India’s roadmap tackles the skills gap through modular apprenticeships and a Frontier Technology Institute for annotation certification. While automation aids pre-labeling, human validation remains mandatory for regulated use cases, keeping wage inflation a near-term drag on margins.
Escalating Data-Privacy and Sovereignty Mandates
Data localization rules carve the data labeling market into regional silos. The EU AI Act demands provenance metadata and dataset documentation, raising compliance overhead.[2]European Commission, “Proposal for a Regulation Laying Down Harmonised Rules on Artificial Intelligence,” europa.eu China’s governance framework restricts cross-border transfers, pushing foreign vendors to set up domestic clouds. These fragmented regimes force annotation firms to duplicate infrastructure and retain local workforces, moderating global economies of scale.
*Our forecasts treat driver/restraint impacts as directional, not additive. The impact forecasts reflect baseline growth, mix effects, and variable interactions.
Segment Analysis
By Sourcing Type: Hybrid Models Balance Control and Scale
Hybrid sourcing generated substantial momentum in 2026, growing at a 22.48% CAGR, driven by enterprises that keep sensitive data in-house but rely on vendors for high-volume work. The outsourced slice still dominated with 63.43% of the data labeling market share in 2025, but rising intellectual property concerns and domain expert scarcity are shifting budgets toward mixed models. Hybrid orchestration tools that route tasks by complexity, enforce role-based access, and surface real-time quality metrics underpin this pivot. In the Asia Pacific, China’s plan to digitize 50,000 factories by 2028 will make hybrid sourcing a default as firms toggle between local plant-level teams and centralized platforms. Across North America, defense contracts stipulate domestic handling of classified data while permitting commercial imagery to be tagged offshore, reinforcing hybrid workflows.
Enterprises adopting hybrid strategies lower turnaround times by splitting queues. High-sensitivity labels stay on secure internal clusters, whereas commodity bounding boxes flow to offshore vendors. Automated policy engines now track dataset lineage and assign annotators by clearance level, tightening compliance without throttling throughput. Vendors monetizing hybrid models position curated “micro-datasets” as repeatable assets sold to multiple buyers, converting once-opaque service revenue into software-like margins and expanding the addressable data labeling market.


By Data Type: Video Annotation Accelerates Autonomy
Video annotation is set for a 23.17% CAGR through 2031, propelled by autonomous vehicles, robotics, and smart-city surveillance. In contrast, static images still captured 36.26% of 2025 revenue, evidencing the entrenched role of frame-based computer vision. Continuous streams require temporally consistent object tracking, action recognition, and scene segmentation, raising per-label complexity and average selling price. The data labeling market size for LiDAR and depth-sensor tagging, while comparatively small, commands premium rates because bounding 3D point clouds demands specialized tooling and automotive-grade accuracy.
Chinese policies emphasizing embodied AI and smart robots will expand demand for multimodal video-LiDAR datasets that capture factory assembly lines, warehouse logistics, and service-robot interactions. North American robotics startups likewise license annotated sequences to retrain vision-based manipulation models. Workflow innovations such as interpolation-assisted bounding and model-suggested polygons compress manual effort, but verification stages remain human-centric to guarantee precision.
By Labeling Approach: Self-Supervised Techniques Scale Efficiently
Manual workflows still represented 42.31% of 2025 revenue, yet self-supervised and programmatic approaches are rising at 22.16% CAGR as firms chase cost relief. Developers now pre-label frames using foundation models, then loop humans on ambiguous slices, slashing total edge cases per dataset. Semi-supervised expansion, where a small gold-label pool informs automated pseudo-labels, dominates conversational AI pipelines. The data labeling market size tied to automatic pre-labeling is expected to widen as weak supervision libraries mature and dashboards report end-to-end provenance.
Regulators nonetheless mandate auditability. Japan’s AI Safety Institute has drafted guidance requiring explainable label-generation logs, pushing vendors to retain human oversight for high-risk verticals. Consequently, the most resilient platforms integrate confidence scoring, active-learning prioritization, and reversible label histories, ensuring compliance while unlocking margin advantages over purely manual shops.
By Application: Predictive Maintenance Drives Recurring Revenue
Computer vision retained 54.19% of 2025 spend, but predictive maintenance and quality assurance now post a 22.61% CAGR as factories harness sensor data to avert downtime. Time-series tagging for vibration, temperature, and acoustic signals creates steady, subscription-like demand because models must be retrained whenever equipment or operating regimes shift. In India, the national roadmap spotlights agentic AI that triggers autonomous batch release, necessitating labeled sensor-fault taxonomies and video-based defect libraries. The data labeling market size attributed to these industrial datasets is rising as OEMs bake labeling costs into multi-year service agreements.
Retailers and call centers continue to invest in natural language processing and speech analytics, but industrial IoT pipelines lead growth. Vendors that bundle domain ontologies, edge-capture SDKs, and cloud-side labeling hooks are winning factory rollouts, as they translate raw operational technology data into AI-ready corpora faster than generic platforms.
By End-User Industry: Industrial Manufacturing Surges
Automotive companies still generated 28.26% of 2025 revenue, driven by ADAS and fleet telematics, yet industrial and manufacturing customers exhibit the fastest 22.84% CAGR to 2031. China’s plan for 20 sectoral datasets and 50,000 upgraded plants injects large-scale demand into metals, chemicals, and consumer-electronics verticals.[3]Wang Jingjing, “China Unveils Plan to Deepen Integration of Industrial Internet, AI,” State Council, english. Japan’s semiconductor renaissance likewise needs labeled photomask images, inline inspection scans, and defect taxonomies. The data labeling market now embeds directly into production digital-twin budgets, pivoting from one-off pilots to recurring operational expense.
Healthcare and life sciences maintain stringent compliance needs, fostering specialist vendors. Financial-services firms prioritize fraud-detection tags, while agriculture users request drone-based crop-stress labels. Each vertical’s unique ontology drives platform customization, underscoring why broad label-ops software complemented by domain add-ons is displacing bespoke internal tools.
Geography Analysis
North America commanded 31.13% of the data labeling market revenue in 2025, anchored by hyperscaler investments, defense contracts, and foundation-model R&D. Scale AI’s USD 1 billion Series F in May 2024 reinforced investor confidence, while Meta’s 2025 stake highlighted the strategic nature of provenance-rich datasets. Federal procurement for intelligence and national-security datasets yields multi-year agreements that cushion cyclical tech spending. Europe’s AI Act lifts compliance hurdles but also differentiates vendors that can produce audit-ready label files and maintain EU data residency.
Asia Pacific is the fastest climber, with a 21.16% CAGR, boosted by China’s industrial-internet roadmap, India’s advanced-manufacturing blueprint, and Japan’s robotics expansion. These policy backstops spur regional demand for localized annotation, multilingual corpora, and sector-specific taxonomies. Domestic cloud mandates in China give homegrown platforms an edge, yet foreign vendors that form joint ventures or establish local data centers can still access growth segments. Southeast Asian nations add low-cost workforce capacity, feeding global hybrid workflows.
The Middle East and Africa remain nascent, with the United Arab Emirates and Saudi Arabia funding smart-city and autonomous mobility pilots that generate modest but strategic data labeling projects. South Africa and Kenya attract English-speaking outsourcing work; however, limited domestic AI demand tempers regional growth. Latin America’s traction centers on Brazil, where e-commerce and agritech companies outsource tagging, although currency volatility complicates cross-border engagements.

Competitive Landscape
The data labeling market is moderately fragmented. Scale AI holds a leading position after Meta’s USD 15 billion infusion, commanding attention through curated, expert-labeled datasets and revenue expected to reach USD 1.4 billion by end-2024. Appen and TELUS International defend share via global crowd platforms and acquisitions such as Lionbridge AI. Neutral platform vendors including Labelbox, SuperAnnotate, and V7 Labs compete on developer experience and integrated quality analytics. SuperAnnotate’s USD 36 million Series B, backed by NVIDIA and Databricks Ventures, illustrates investor appetite for platform-centric approaches that let enterprises toggle between software-only and managed-service modes.
Technology differentiation now pivots on foundation-model pre-labeling, active-learning prioritization, and quality dashboards that visualize inter-annotator agreement in real time. Vendors racing to support data sovereignty have spun up regional instances in Europe and China, while smaller boutiques win regulated sectors by touting ISO 13485 or SOC 2 certifications. Pricing pressure persists in commoditized image tagging, but high-value segments - medical imaging, 3D LiDAR, and legal document annotation - command premium rates that shore up margins.
Startups like Snorkel AI popularize programmatic labeling, enabling users to encode heuristic rules or leverage weak supervision, whereas edge-focused entrants such as Dataloop offer on-device micro-labeling for synthetic-data validation. As enterprises shift from pilot projects to production-scale pipelines, winners will be those that deliver full-stack label operations, from ingestion to drift monitoring, across hybrid clouds and on-premise clusters.
Data Labeling Industry Leaders
Appen Limited
TELUS International AI Inc.
Scale AI, Inc.
Amazon Mechanical Turk, Inc.
CloudFactory Limited
- *Disclaimer: Major Players sorted in no particular order

Recent Industry Developments
- January 2026: China’s Ministry of Industry and Information Technology released a work plan to deepen AI integration across 20 sectors, targeting 50,000 industrial-internet upgrades and standardized domain datasets by 2028.
- November 2025: China published an industrial AI roadmap outlining a six-point strategy that links large language models with advanced manufacturing equipment and AI agents.
- October 2025: India’s NITI Aayog issued a 10-year manufacturing blueprint that prioritizes AI-powered design copilots, predictive-maintenance agents, and certified labeling processes.
- June 2025: Meta invested nearly USD 15 billion in Scale AI, valuing the firm at USD 29 billion and recruiting its 28-year-old chief executive officer to helm a new superintelligence lab.


Research Methodology Framework and Report Scope
Market Definitions and Key Coverage
Our study defines the data labeling market as all revenue earned from platforms, managed services, and blended human-in-the-loop workflows that tag text, image, video, audio, and point-cloud files so machine-learning models can learn, validate, or fine-tune. The value pool includes fees paid by enterprises, research labs, and public agencies and is stated in constant 2025 US dollars.
Scope exclusion: synthetic-data generators, pure data-classification software, and stand-alone model-testing tools are kept outside this boundary.
Segmentation Overview
- By Sourcing Type
- In-house
- Outsourced
- Hybrid
- By Data Type
- Text
- Image
- Video
- Audio
- LiDAR / Sensor
- By Labeling Approach
- Manual
- Automatic
- Semi-Supervised
- Self-Supervised / Programmatic
- By Application
- Computer Vision
- Natural Language Processing
- Speech and Audio Analytics
- Predictive Maintenance and QA
- By End-User Industry
- Automotive and Transportation
- Healthcare and Life Sciences
- IT and Telecom
- BFSI
- Retail and E-Commerce
- Industrial and Manufacturing
- Agriculture
- Government and Public Sector
- By Geography
- North America
- United States
- Canada
- Mexico
- South America
- Brazil
- Argentina
- Rest of South America
- Europe
- United Kingdom
- Germany
- France
- Spain
- Italy
- Rest of Europe
- Asia-Pacific
- China
- India
- Japan
- Australia
- South Korea
- Rest of Asia-Pacific
- Middle East
- Saudi Arabia
- United Arab Emirates
- Turkey
- Rest of Middle East
- Africa
- South Africa
- Kenya
- Rest of Africa
- North America
Detailed Research Methodology and Data Validation
Primary Research
Mordor analysts then spoke with platform product heads, outsourcing executives, and AI engineering leads across North America, Europe, and Asia-Pacific. These discussions clarified workflow mixes, automation ratios, and prevailing prices per thousand labels, helping us bridge gaps left by desk work and align regional adoption curves.
Desk Research
We mapped demand signals through freely available sources such as the US Bureau of Labor Statistics, Eurostat ICT surveys, the OECD AI Policy Observatory, and sector bodies for autonomous driving, medical imaging, and conversational AI. Patent clusters were traced with Questel, while company revenue clues surfaced from D&B Hoovers, SEC 10-Ks, and earnings calls, giving early splits by activity type. Academic journals, NIST AI Risk Framework comments, and customs ledgers detailing annotation labor contracts added further context. The sources listed are illustrative; many additional publications informed data collection and validation.
Market-Sizing & Forecasting
A top-down pool reconstructed from enterprise AI training budgets, public-cloud GPU hours, and use-case prevalence formed the baseline, which was cross-checked through sampled vendor invoices and average selling price multiplied by job volumes, a targeted bottom-up roll-up. Five key variables anchor the model: annotated objects per autonomous mile, radiology scans digitized per hospital bed, synthetic-to-real augmentation ratios, labeler hourly wage, and platform automation penetration. Multivariate regression projects these drivers to 2030, with scenario overlays vetted in expert calls.
Data Validation & Update Cycle
Outputs pass variance screens, peer review, and anomaly checks before sign-off. Reports refresh yearly, and material events, like new AI-safety rules, trigger interim updates, ensuring clients receive our latest view.
Why Mordor's Data Labeling Baseline Commands Reliability
Estimates across publishers diverge because each selects its own scope, currency treatment, and uplift factors.
By capturing in-house and outsourced spend, including platform licenses, and revisiting inputs every twelve months, Mordor Intelligence offers a steadier anchor for planning.
Benchmark comparison
| Market Size | Anonymized source | Primary gap driver |
|---|---|---|
| USD 6.5 B | Mordor Intelligence | - |
| USD 4.89 B | Global Consultancy A | Omits in-house platforms and hybrid automation revenue streams |
| USD 4.87 B | Regional Consultancy B | Applies conservative price per label and excludes LiDAR data flows |
The comparison shows that others narrow the universe or lock static cost factors, whereas Mordor's disciplined scope, live primary checks, and annual refresh cycle yield a transparent, repeatable baseline decision-makers can rely on.


Key Questions Answered in the Report
What is the projected value of the data labeling market in 2031?
It is forecast to reach USD 7.02 billion, reflecting a 21.94% CAGR from 2026 to 2031.
Which region is growing the fastest in data annotation demand?
Asia Pacific shows the highest momentum with a 21.16% CAGR driven by China, India, and Japan.
Which data type is expanding quicker than others?
Video annotation leads growth at a 23.17% CAGR due to autonomous vehicles and robotics.
Why are hybrid sourcing models gaining traction?
Enterprises combine internal experts for sensitive data with external vendors for scale, achieving balanced cost and control while growing at 22.48% CAGR.
Which application area is expected to generate steady recurring labeling revenue?
Predictive maintenance in industrial settings, growing at 22.61% CAGR, requires continuous sensor re-tagging as equipment evolves.
How are privacy regulations affecting global labeling strategies?
Mandates such as the EU AI Act and China’s data-governance rules compel vendors to establish regional infrastructures and maintain separate annotator pools to comply with localization laws.
Page last updated on:


