Structured Cabling Market Size and Share
Market Overview
| Study Period | 2020 - 2031 |
|---|---|
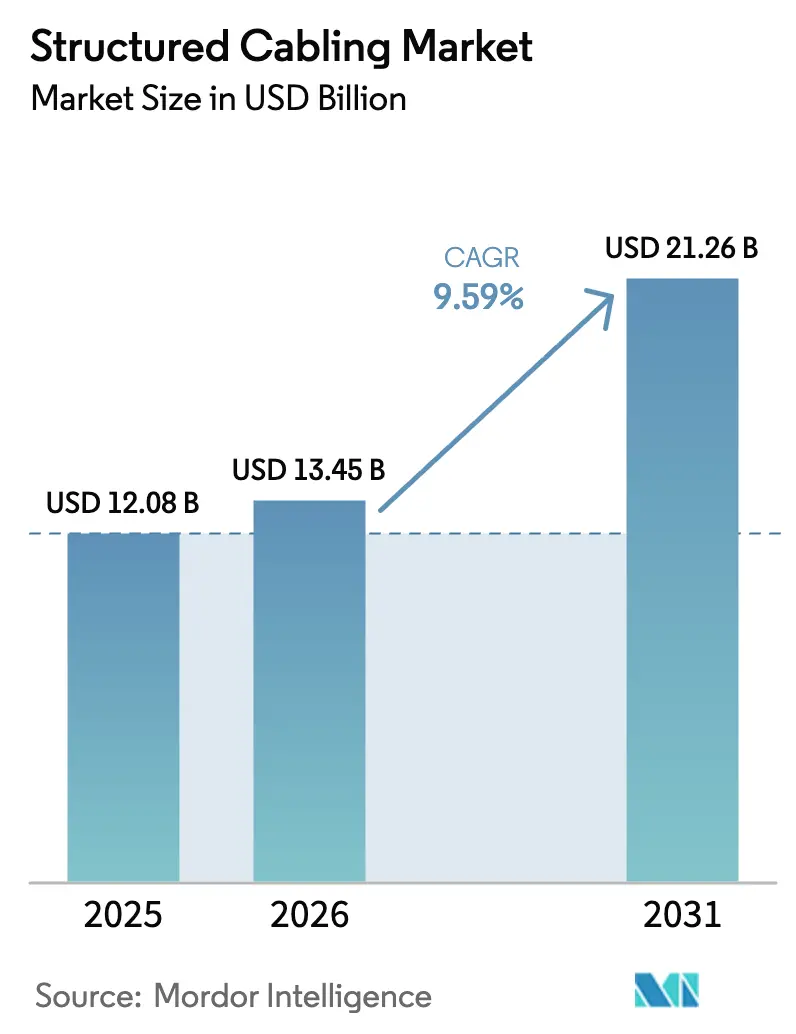
| Market Size (2026) | USD 13.45 Billion |
| Market Size (2031) | USD 21.26 Billion |
| Growth Rate (2026 - 2031) | 9.59% CAGR |
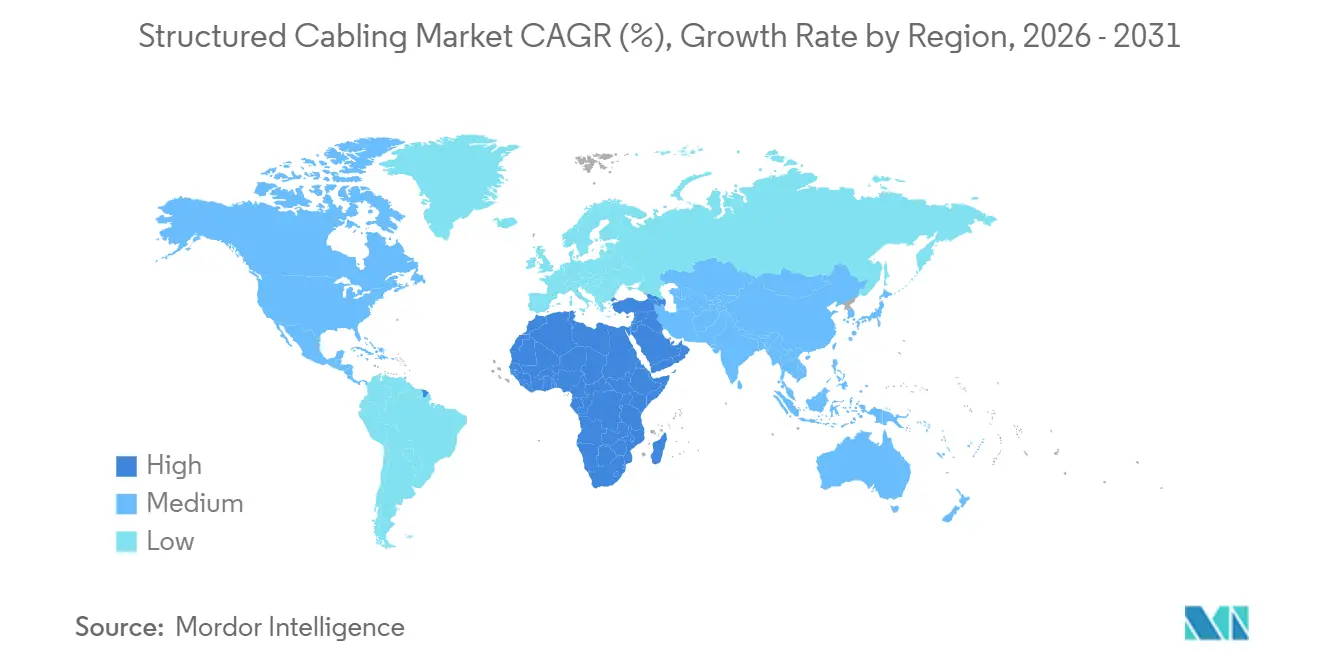
| Fastest Growing Market | Middle East |
| Largest Market | North America |
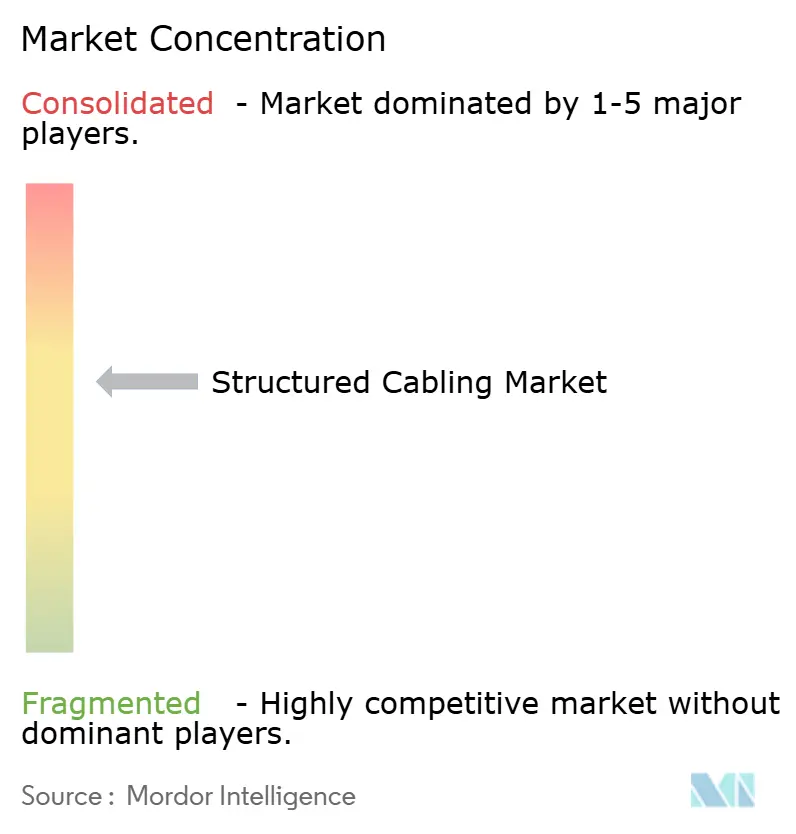
| Market Concentration | Medium |
Major Players *Disclaimer: Major Players sorted in no particular order Image © Mordor Intelligence. Reuse requires attribution under CC BY 4.0. | |
Structured Cabling Market Analysis by Mordor Intelligence
The Structured Cabling Market size is projected to be USD 12.08 billion in 2025, USD 13.45 billion in 2026, and reach USD 21.26 billion by 2031, growing at a CAGR of 9.59% from 2026 to 2031. Demand is being refashioned by hyperscale artificial-intelligence clusters that rely on terabit-per-second fabrics, industrial automation that moves operational and information-technology traffic onto deterministic Ethernet, and smart-building retrofits that swap copper for fiber-to-the-room topologies. Vendors must now optimize power delivery, rack density, and cable management as liquid-cooling and 800 Gbit links become mainstream. Fiber’s growing dominance, the wider use of Power over Ethernet, and rising sustainability mandates are reshaping bill-of-materials decisions, while consolidation among component makers is increasing buyers' dependency on vertically integrated suppliers.
Key Report Takeaways
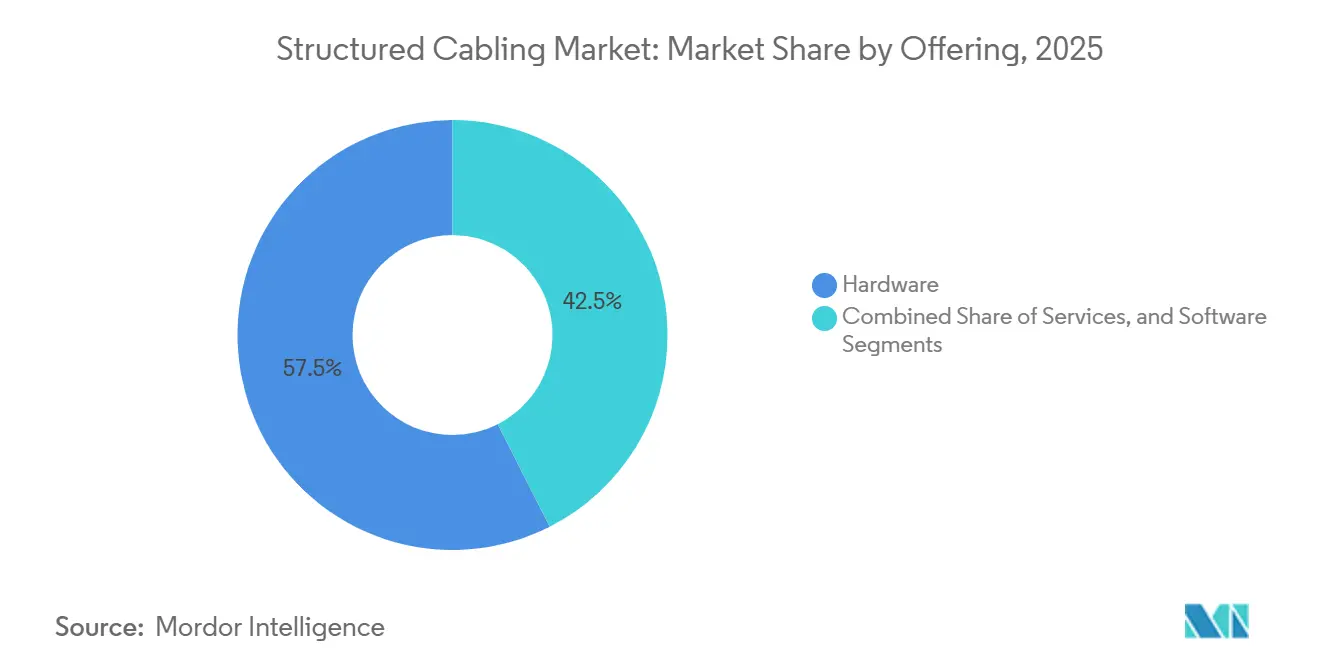
- By offering hardware led with 57.48% of the structured cabling market share in 2025, but software recorded the fastest 10.04% CAGR to 2031.
- By cable type, fiber captured 64.12% revenue share in 2025 and is advancing at a 10.34% CAGR through 2031.
- By cable category standard, Cat 6 retained 38.78% share in 2025, whereas Cat 8 is projected to grow at a 10.78% CAGR between 2026 and 2031.
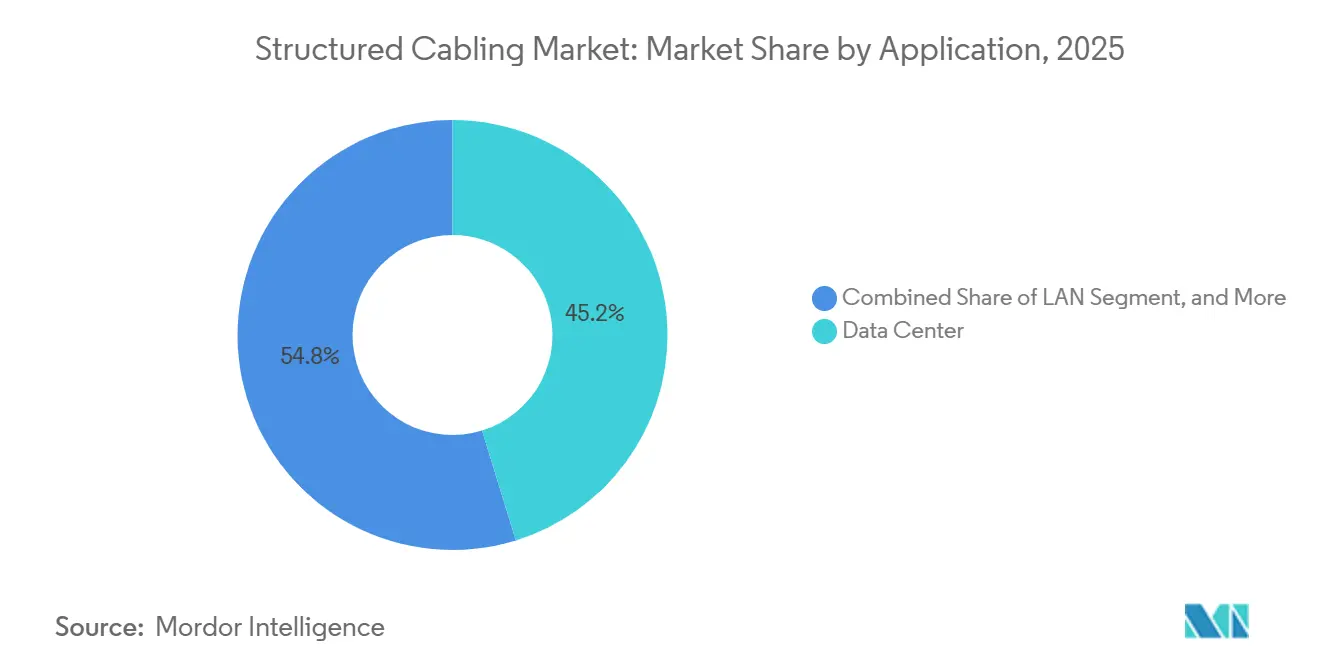
- By application, data centers accounted for 45.23% of structured cabling market size in 2025, while industrial automation networks expand at a 10.23% CAGR to 2031.
- By end-user industry, cloud and colocation facilities held 32.01% share in 2025; manufacturing posts the highest 10.95% CAGR through 2031.
- By geography, Asia Pacific commanded 30.59% share in 2025, whereas the Middle East registers the quickest 10.56% CAGR during 2026-2031.
Note: Market size and forecast figures in this report are generated using Mordor Intelligence’s proprietary estimation framework, updated with the latest available data and insights as of January 2026.
Global Structured Cabling Market Trends and Insights
Drivers Impact Analysis*
| Driver | (~) % Impact on CAGR Forecast | Geographic Relevance | Impact Timeline |
|---|---|---|---|
| Accelerating hyperscale and edge data-center build-outs | +2.8% | North America, Asia Pacific, Middle East | Medium term (2-4 years) |
| Surge in PoE and remote powering requirements | +1.6% | North America, Europe, Asia Pacific | Short term (≤ 2 years) |
| Increasing retrofits for smart buildings and campuses | +1.4% | North America, Europe, Asia Pacific | Medium term (2-4 years) |
| Adoption of 400 G / 800 G active optical cables in AI clusters | +2.1% | Global hyperscale hubs | Short term (≤ 2 years) |
| Sustainability mandates driving low-smoke zero-halogen cabling | +0.9% | Europe, Asia Pacific, North America | Long term (≥ 4 years) |
| Converged OT/IT cabling for Industry 4.0 TSN | +1.3% | Global manufacturing hubs | Medium term (2-4 years) |
| Source: Mordor Intelligence | |||
Accelerating Hyperscale and Edge Data Center Build-Outs
India’s capacity is forecast to climb from roughly 1.8 GW in 2026 to up to 4.5 GW by 2030, with Mumbai alone approaching 2 GW of installed load. Edge facilities in Tier 2 and Tier 3 cities multiply project counts and require pre-terminated trunks to hit short deployment windows. Rack densities of 80-200 kW and AI traffic that bypass aggregation layers drive dense fiber counts, multi-fiber push-on connectors, and liquid-cooling-friendly cable trays. Hyperscalers now specify deterministic latency budgets and optical-loss margins that only ultra-low-loss fiber can meet. Compliance with India’s Digital Personal Data Protection Act and incentives under the draft National Data Center Policy accelerate certified-system adoption.
Surge in PoE and Remote Powering Requirements
IEEE 802.3bt delivers up to 90 W over twisted pair, enabling a single cable to support data and power for access points, cameras, and sensors. Higher wattage raises conductor temperature, pushing installers toward larger-gauge copper or shorter run lengths to meet TIA and ISO/IEC thermal limits.[2]ETSI, “GS F5G 022 V1.1.1 Specification for PON-Based Industrial Network,” etsi.org Passive optical LAN with PoE-capable optical network units centralizes power and mitigates spark risk in hazardous industrial zones. ETSI’s industrial PON spec also mandates extended temperature classes, adding cost but widening deployment scenarios. Smart-building plays increasingly treat PoE budgeting software as critical to reduce downtime and comply with facility energy codes.
Increasing Retrofits for Smart Buildings and Campuses
Most offices built before 2010 carry Cat 5e or Cat 6 cabling suited for only 1 Gbit. Fiber-to-the-room upgrades remove switch closets, decrease energy use, and deliver multigigabit throughput for cloud desktop and IoT sensors. ETSI’s F5G framework promotes split ratios up to 1:32 and pre-connectorized assemblies that slide through existing conduits. Campus retrofits for private 5G adopt dense copper drops to serve integrated small cells, while high-rise hotels favor passive optical LAN to centralize active electronics. Retrofit demand remains cyclical yet resilient because building owners align upgrades with ESG certifications and operating-expense savings.
Adoption of 400 G / 800 G Active Optical Cables in AI Clusters
Ethernet Alliance’s 2025 roadmap shows a pivot to linear pluggable optics, trimming module power roughly 50% and allowing co-packaged optics that embed transceivers next to switch ASICs.[1]Ethernet Alliance, “2025 Ethernet Roadmap,” ethernetalliance.org Active optical cables erase the pluggable interface altogether, cutting latency and simplifying airflow. Cabling vendors now race to supply ultra-low-loss MPO trunks and high-density distribution frames able to coexist with liquid cooling loops. Early 1.6 Tbit pilots rely on multi-source agreements, so interoperability risk is high and favors suppliers that offer testing services.
Restraint Impact Analysis*
| Restraint | (~) % Impact on CAGR Forecast | Geographic Relevance | Impact Timeline |
|---|---|---|---|
| Rising adoption of enterprise WLAN and 5G fixed wireless access | -0.8% | Global offices and urban centers | Short term (≤ 2 years) |
| Supply-chain volatility in copper and optical fiber | -0.6% | Import-dependent regions | Short term (≤ 2 years) |
| Emerging silicon photonics eliminating high-speed copper runs | -0.5% | Hyperscale data centers | Medium term (2-4 years) |
| Increasing use of modular plug-terminated links reducing patch-panel demand | -0.3% | Modular edge facilities | Medium term (2-4 years) |
| Source: Mordor Intelligence | |||
Rising Adoption of Enterprise WLAN and 5G Fixed Wireless Access
Wi-Fi 7 delivers multi-gigabit speeds in the 6 GHz band, prompting offices to drop horizontal copper links at every desk. Private mid-band 5G covers warehouses and hospitals with roughly 15,000 ft² per cell, easing mobility constraints. Integrated small-cell designs relax fronthaul latency, allowing reuse of existing LAN wiring, yet they increase PoE backhaul density. The trade-off slows copper volumes but lifts demand for high-capacity fiber uplinks and PoE budgeting software. Regional variance is strong: Europe’s historic stone buildings retain wired runs, while U.S. tech campuses lean wireless-first.
Supply-Chain Volatility in Copper and Optical Fiber
Mining, refining, and preform capacity remain concentrated, causing price spikes and delivery lags during demand surges. Vertically integrated firms like Prysmian and Belden can buffer shocks, but smaller assemblers absorb margin hits or lose bids. Buyers lock in multi-year supply contracts, boosting working-capital needs. Substitutes such as plastic optical fiber or aluminum conductors compromise performance, so adoption stays niche. Project delays cascade to installers, threatening completion bonuses and straining cash flow.
*Our forecasts treat driver/restraint impacts as directional, not additive. The impact forecasts reflect baseline growth, mix effects, and variable interactions.
Segment Analysis
By Offering: Software Expands Physical-Layer Intelligence
Hardware held 57.48% of structured cabling market share in 2025, driven by fiber trunks, connectors, and high-density racks.[3]ETSI, “F5G Technology Landscape Release 2,” etsi.org Services followed, as installers accelerate campus upgrades using pre-terminated assemblies. The structured cabling market size for software remains small but its 10.04% CAGR through 2031 outpaces all other offerings, reflecting growing demand for digital documentation and PoE budgeting tools. Hyperscalers integrate physical-layer telemetry into DCIM suites to trim mean-time-to-repair, while healthcare and finance entities value automated compliance reports.
Software’s predictive-maintenance algorithms leverage machine-learning models to warn of micro-bends and connector contamination, protecting uptime in AI clusters. New license models bundle cloud dashboards with connector warranties, shifting revenue toward recurring subscriptions. Meanwhile, services revenue pivots from bulk installation toward retrofit consulting and moves-adds-changes managed services. Larger integrators cross-sell maintenance contracts alongside fiber trunks, deepening wallet share. Vendors that fail to unify hardware, services, and software risk margin squeeze as buyers seek single-pane-of-glass platforms.


By Cable Type: Fiber’s Lead Widens
Fiber captured 64.12% share in 2025 and is poised to expand at a 10.34% CAGR, reinforcing its status as backbone of the structured cabling market. Single-mode dominates long runs, while multi-mode holds short-reach links below 500 m. Active optical cables and linear optics compress cost per bit, further tilting spend toward fiber.
Copper retains relevance in cost-sensitive retrofits and in harsh industrial environments where shielded twisted-pair mitigates electromagnetic interference. Category 8 over 30 m remains cheaper than optics for some top-of-rack links, delaying full fiber displacement. Sustainability policies push both copper and fiber to adopt low-smoke zero-halogen jackets, marginally inflating material costs. Hybrid optical-electrical cables gain mindshare because they deliver fiber bandwidth plus PoE power in a single sheath, cutting pull time in smart-building retrofits.
By Cable Category Standard: Cat 8 Surges
Cat 6 led with 38.78% share in 2025 on the legacy installed base, yet Cat 8 posts the fastest 10.78% CAGR through 2031. Cat 6A remains the workhorse for new horizontal drops because it supports 10 Gbit over 100 m, while Cat 5e lingers in low-budget refurbishments.
Data-center densification and AI workloads pressure switch-to-server links to migrate to 25 G and 40 G Ethernet, niches ideally served by Cat 8 over 30 m. Shielding and 2000 MHz bandwidth reduce alien crosstalk, essential near liquid-cooling pumps. Cat 7/7A stays popular in certain European markets owing to shielding norms but loses momentum elsewhere. Counterfeit cables that fail flame tests rise in emerging markets, pushing buyers to demand third-party certification before site acceptance.
By Application: Data Centers Dominate, Factories Accelerate
Data centers accounted for 45.23% of structured cabling market size in 2025, mirroring the capital intensity of hyperscale builds. LAN projects follow, though office cabling volumes plateau as wireless substitution grows. Fiber-to-the-x and campus backbones enjoy steady expansion as operators push fiber closer to end users.
Industrial-automation networks expand at a 10.23% CAGR, the fastest among applications, because Industry 4.0 merges operational and IT domains. Factories demand hybrid plants of fiber backbones, Cat 6A drops, and single-pair Ethernet sensor lines, each with IP65 or IP68 ingress protection. Passive optical LAN eliminates switch stacks in hazardous areas, cutting maintenance exposure. Energy-codes and safety regulations in petrochemical and food-processing plants favor pre-terminated, factory-tested trunks to minimize onsite welding or splicing.
By End-User Industry: Cloud Leads, Manufacturing Gains Pace
Cloud and colocation providers controlled 32.01% share in 2025, underpinned by hyperscaler pre-leases and hybrid-cloud migrations from enterprises. Telecom carriers and ISPs invest in fiber-to-the-home and 5G backhaul, sustaining outdoor-rated cable demand. BFSI and enterprise offices moderate upgrades as remote work reduces per-desk wiring.
Manufacturing, though smallest, shows the highest 10.95% CAGR, reflecting Industry 4.0 retrofits in automotive, semiconductor, and food-processing facilities. OEMs deploy deterministic Ethernet for machine vision and robotics, lifting spend on SPE and industrial-grade fiber. Education and healthcare remain steady, constrained by multi-year budgeting but buoyed by tele-learning and tele-medicine requiring high-capacity backbones. Government and defense projects prioritize secure, armored fiber with added EMI shielding.
Geography Analysis
Asia Pacific accounted for 30.59% of structured cabling market share in 2025, energized by India’s rapid data-center additions and China’s AI parks.[4]Houlihan Lokey, “Real Estate Highlight: Data Center—India Edition,” hl.com Tier-2 Indian cities such as Kochi and Visakhapatnam invite modular edge facilities that favor pre-connectorized trunks. Japanese industrial automation and South Korean electronics clusters sustain factory cabling uptick, while ASEAN fiber-to-the-home rollouts drive outdoor cable demand.
North America remains a mature yet dynamic pocket as hyperscalers cluster in Virginia, Oregon, and Texas. Smart-building retrofits add PoE-rich links in legacy offices, whereas colocation cages adopt Cat 8 for short reach. Federal sustainability targets encourage LSZH adoption in government properties, pushing specifiers toward certified suppliers.
Europe’s growth stems from low-smoke zero-halogen mandates, energy-efficiency retrofits, and Industry 4.0 upgrades in Germany and France. Historic structures complicate new duct routes, making micro-cables and air-blown fiber attractive. The Middle East, though smaller in base, posts the highest 10.56% CAGR as Saudi Arabia’s NEOM and UAE sovereign AI centers demand terabit fabrics and gigawatt power envelopes.
Latin America and Africa lag because of import dependency and economic volatility, yet Brazil’s cloud build-outs and Nigeria’s fintech boom create focused demand pockets. Political stability and low electricity pricing increasingly dictate hyperscaler site selection, redistributing new capacity away from legacy Western hubs toward Asia and the Middle East.
Mordor Intelligence provides coverage of the structured cabling market across other key regional markets, including Africa, each with their regulatory frameworks and demand patterns.

Competitive Landscape
Vertical integration and acquisitions are reshaping vendor ranks. Amphenol’s USD 10.5 billion agreement to buy CommScope’s Connectivity and Cable Solutions segment, announced in August 2025, eliminates a major standalone rival and pairs data-center fiber assemblies with Amphenol’s broader connector suite.[5]Amphenol Corporation, “Acquisition of Connectivity and Cable Solutions,” amphenol.com The transaction is expected to close H1 2026, boosting Amphenol’s leverage with hyperscalers. CommScope rebranded to Vistance Networks in January 2026, signaling a pivot toward active equipment.
Prysmian closed its USD 950 million purchase of Channell Commercial in June 2025, pivoting from cable maker to end-to-end FTTH solutions provider. The deal bundles ribbon and drop cables with thermoplastic vaults and fiber-management hardware, giving Prysmian an entry into premise connectivity. Belden expands vertically by adding device-level industrial switches that integrate with its cable portfolio, while Corning targets high-density optical connectors tailored for liquid-cooled racks.
Competitive advantages now center on bundled software, global manufacturing footprint, and ability to guarantee raw-material supply. Vendors lacking captive fiber drawing or connector molding struggle with volatile copper and germanium prices. Disruptors offer software-defined physical-layer management that taps AI for fault prediction, scooping service revenue from traditional installers. Sustainability credentials serve as tiebreakers in public tenders, prompting large players to publish scope 3 emission audits.
Pricing power concentrates among the top five brands, yet regional specialists survive by focusing on quick-turn assemblies and local support. Government preference policies in India and Saudi Arabia encourage joint ventures with domestic partners, reshaping go-to-market strategies. As hyperscalers shift to direct-source models, suppliers that can pre-integrate fiber, power, and monitoring electronics win multi-year master agreements.
Structured Cabling Industry Leaders
CommScope Holding Company, Inc.
Corning Incorporated
Belden Inc.
Schneider Electric SE
Anixter International Inc.
- *Disclaimer: Major Players sorted in no particular order

Recent Industry Developments
- January 2026: Vistance Networks completed its rebranding following the divestiture of Connectivity and Cable Solutions to Amphenol; ticker changed from COMM to VISN.
- August 2025: Amphenol announced a USD 10.5 billion deal to acquire CommScope’s Connectivity and Cable Solutions business, expanding its data-center fiber offerings.
- March 2025: Prysmian announced its intent to buy Channell Commercial to enhance its Digital Solutions business.
- March 2025: Ethernet Alliance released the 2025 Ethernet Roadmap, outlining shifts to linear optics and co-packaged architectures that influence cabling design.


Research Methodology Framework and Report Scope
Market Definitions and Key Coverage
Our study defines the structured cabling market as the yearly revenue generated from new copper and fiber cables, associated connectivity hardware, and related design-installation services that create permanent ICT pathways inside commercial, industrial, and data-center facilities.
Passive optical LAN backbones and PoE-enabled twisted-pair links are within scope; field-terminated patch cords, consumer plug-and-play kits, and resale of used cabling are excluded.
Segmentation Overview
- By Offering
- Hardware
- Cabling (Copper, Fiber)
- Connectivity (Connectors, Patch-Panels, Jacks, Cords)
- Racks, Cabinets and Cable Management
- Services
- Design and Consulting
- Installation and Integration
- Maintenance and Support
- Software
- Hardware
- By Cable Type
- Copper
- Copper Cable
- Copper Connectivity
- Fiber
- Single-Mode Cable
- Multi-Mode Cable
- Fiber Connectivity
- Copper
- By Cable Category Standard
- Cat 5e
- Cat 6
- Cat 6A
- Cat 7/7A
- Cat 8
- By Application
- LAN
- Data Center
- FTTx, Campus Backbone
- Industrial Automation Networks
- By End-User Industry
- IT and Telecom Service Providers
- Cloud and Colocation Data Centers
- BFSI and Enterprise Offices
- Healthcare Facilities
- Government and Defense
- Manufacturing and Industrial
- Education
- By Geography
- North America
- United States
- Canada
- Mexico
- South America
- Brazil
- Argentina
- Rest of South America
- Europe
- United Kingdom
- Germany
- France
- Italy
- Spain
- Nordics
- Russia
- Rest of Europe
- Asia Pacific
- China
- India
- Japan
- South Korea
- ASEAN
- Australia
- New Zealand
- Rest of Asia Pacific
- Middle East and Africa
- Middle East
- Saudi Arabia
- United Arab Emirates
- Turkey
- Rest of Middle East
- Africa
- South Africa
- Egypt
- Nigeria
- Rest of Africa
- Middle East
- North America
Detailed Research Methodology and Data Validation
Primary Research
Mordor analysts interviewed structured-cabling contractors, data-center design engineers, and enterprise network managers across North America, Europe, and APAC.
Discussions validated channel mark-ups, project run-rate shifts after AI-cluster build-outs, and realistic fiber-to-copper mix changes, letting us refine model coefficients that desk sources alone could not pin down.
Desk Research
We drew on public datasets from bodies such as the US Census Construction Put-in-Place survey, Eurostat building permits, the Chinese MIIT optical-fiber shipment bulletin, and trade-flow tables from UN Comtrade.
Technical adoption ratios were informed by IEEE 802.3 standards releases and TIA-568 committee minutes, while price references came from quarterly SEC filings of leading cable makers.
Subscription data from D&B Hoovers and Dow Jones Factiva helped benchmark vendor revenues.
These examples illustrate, but do not exhaust, the broader secondary pool consulted for trend mapping and base-year anchoring.
Market-Sizing & Forecasting
A top-down reconstruction starts with commercial floor-space additions, hyperscale rack deployments, and telecom central-office modernization budgets, which are then multiplied by cabling density norms (meters per square foot or rack) and average selling prices captured from invoices.
Target outputs are further tested through selective bottom-up checks, supplier roll-ups, and sampled LAN refresh projects before adjustments.
Key variables include global data-center megawatt additions, Cat 6A to Cat 7 migration rates, fiber price per kilometer, PoE port penetration, and regional construction cost indices.
Forecasts employ multivariate regression that links these drivers to historical spend, and scenario analysis gauges upside from government broadband incentives.
Data Validation & Update Cycle
We compare interim model outputs with import-export anomalies, vendor earnings surprises, and building-permit spikes.
Variances above preset thresholds trigger analyst re-work and a second expert call.
Our reports refresh once a year, yet we push mid-cycle updates after material mergers or standard releases so clients always receive the latest viewpoint.
Why Mordor's Structured Cabling Baseline Commands Reliability
Published values often diverge because firms select different hardware-service mixes, currency bases, and refresh cadences.
Key gap drivers include some publishers counting only product revenue while Mordor folds in professional services; others begin from 2022 exchange rates, whereas we lock 2025 USD values; a few extrapolate aggressive fiber ASP erosion that our interviews moderated.
Benchmark comparison
| Market Size | Anonymized source | Primary gap driver |
|---|---|---|
| USD 13.22 B (2025) | Mordor Intelligence | - |
| USD 13.66 B (2025) | Global Consultancy A | narrower geographic split, limited service inclusion |
| USD 15.00 B (2027) | Global Consultancy B | applies straight-line growth from 2022 base, ignores PoE density shift |
| USD 11.62 B (2022) | Industry Journal C | older base year, uses pre-AI data-center capex profile |
Taken together, the comparison shows our disciplined scope selection, live driver tracking, and annual refresh give decision-makers a transparent, balanced baseline they can retrace with confidence.


Key Questions Answered in the Report
How large is the structured cabling market in 2026 and what is its growth outlook?
The structured cabling market size reached USD 13.45 billion in 2026 and is forecast to expand to USD 21.26 billion by 2031 at a 9.59% CAGR.
Which cable type is gaining the most share?
Fiber captured 64.12% revenue share in 2025 and is growing at a 10.34% CAGR, widening its lead over copper.
What segment is growing fastest by application?
Industrial automation networks record the highest 10.23% CAGR as Industry 4.0 drives deterministic Ethernet adoption on factory floors.
Which region will post the quickest growth through 2031?
The Middle East leads with a projected 10.56% CAGR, fueled by Saudi and UAE gigawatt-scale AI data-center projects.
How are acquisitions affecting competition?
Deals such as Amphenol’s USD 10.5 billion purchase of CommScope’s cabling segment and Prysmian’s USD 950 million buyout of Channell concentrate supply and give integrated vendors greater pricing power.
Page last updated on:


