
Data Center Liquid Cooling Market Size and Share
Market Overview
| Study Period | 2021 - 2031 |
|---|---|
| Market Size (2026) | USD 6.77 Billion |
| Market Size (2031) | USD 18.79 Billion |
| Growth Rate (2026 - 2031) | 22.65 % |
| Fastest Growing Market | Asia Pacific |
| Largest Market | North America |
| Market Concentration | Medium |
Major Players *Disclaimer: Major Players sorted in no particular order Image © Mordor Intelligence. Reuse requires attribution under CC BY 4.0. | |
Data Center Liquid Cooling Market Analysis by Mordor Intelligence
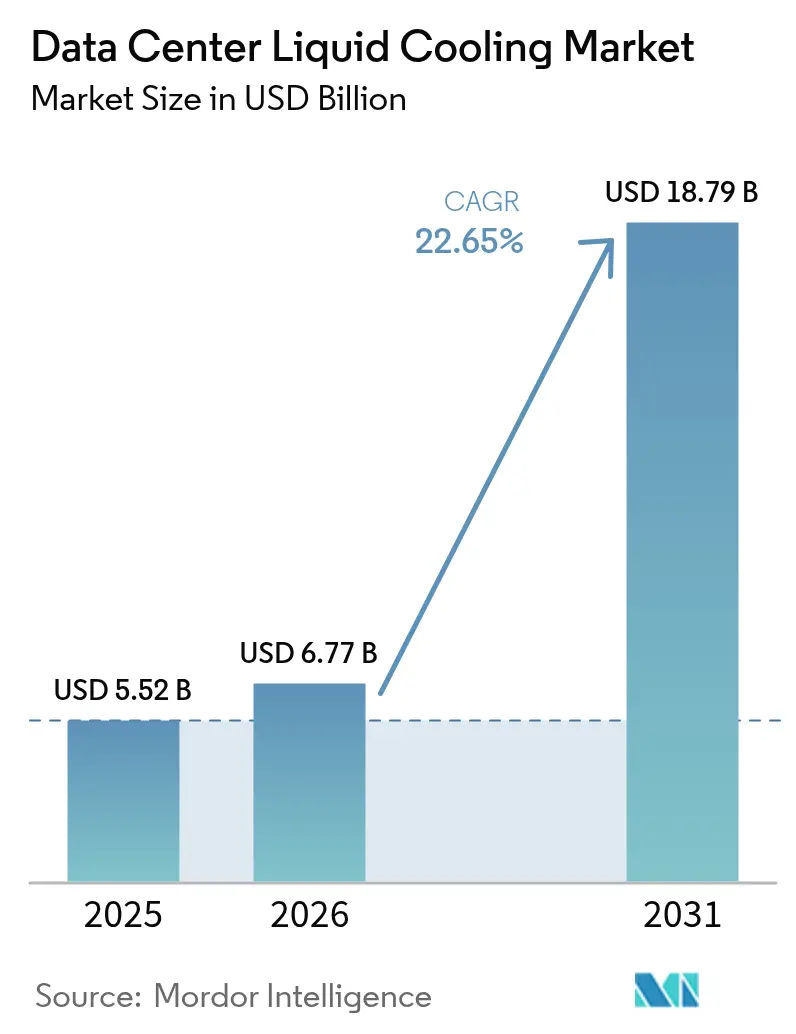
The data center liquid cooling market size was valued at USD 5.52 billion in 2025 and estimated to grow from USD 6.77 billion in 2026 to reach USD 18.79 billion by 2031, at a CAGR of 22.65% during the forecast period (2026-2031). Rising rack densities above 30 kW, the accelerating use of graphics processing units for AI models, and tighter sustainability mandates are converging to make liquid cooling a core architectural requirement for modern facilities. Direct-to-chip solutions continue to dominate because they retrofit into existing racks, while two-phase immersion systems are advancing fastest as operators pursue still higher thermal efficiencies. Hyperscale cloud providers are translating early pilots into fleet-wide rollouts, and their aggregated demand is lowering unit costs for enterprise and colocation buyers. Meanwhile, policy incentives that favour heat re-use and lower carbon intensity are reinforcing liquid adoption across North America, Europe, and selected Asia-Pacific (APAC) hubs.[1]Dan Swinhoe, “Microsoft Adopting Direct-to-Chip Liquid Cooling, Exploring Microfluidics,” Data Center Dynamics, datacenterdynamics.com
Key Report Takeaways
- By cooling technology, direct-to-chip captured 42.85% of the data center liquid cooling market share in 2025; immersion cooling is projected to grow at a 26.62% CAGR through 2031.
- By coolant type, single-phase hydrocarbon fluids accounted for 45.37% of the data center liquid cooling market size in 2025, while two-phase fluorocarbon fluids are set to expand at a 25.64% CAGR.
- By data center type, hyperscale sites led with 38.92% revenue share in 2025; edge and micro data centers are poised for the highest CAGR at 24.98% over 2026-2031.
- By application, AI/ML workloads represented 34.84% of 2025 spending and are expected to advance at a 25.98% CAGR through 2031.
Note: Market size and forecast figures in this report are generated using Mordor Intelligence’s proprietary estimation framework, updated with the latest available data and insights as of 2026.
Market Trends and Insights
Drivers Impact Analysis of Data Center Liquid Cooling Market*
| Driver | (~) % Impact on CAGR Forecast | Geographic Relevance | Impact Timeline |
|---|---|---|---|
| Surging rack densities (>30 kW) in AI and HPC facilities | +6.20% | Global, concentrated in North America and APAC | Short term (≤ 2 years) |
| Hyperscale operators' net-zero roadmaps accelerating liquid adoption | +4.80% | Global, led by North America and Europe | Medium term (2-4 years) |
| OEM warranties now covering direct-to-chip loops | +3.10% | North America and Europe, expanding to APAC | Medium term (2-4 years) |
| Nvidia and AMD liquid-ready reference designs driving ecosystem | +5.40% | Global, strongest in North America and China | Short term (≤ 2 years) |
| Government incentives for green DCs (e.g., EU Taxonomy) underwrite CAPEX | +2.90% | Europe and North America, emerging in APAC | Long term (≥ 4 years) |
| Re-use of waste-heat for district heating monetises OPEX savings | +1.70% | Northern Europe, expanding to North America | Long term (≥ 4 years) |
| Source: Mordor Intelligence | |||
Surging rack densities drive liquid cooling necessity
Data center operators deploying NVIDIA H200 GPUs face 700 W thermal loads per device, and air cooling cannot cost-effectively remove that heat at volume.[2]Uvation Team, “Beyond Sticker Price: How NVIDIA H200 Servers Slash Long-Term TCO,” Uvation, uvation.com With processors delivering up to 1.9 times prior-generation performance, operators can shrink server counts but must dissipate concentrated heat. Liquid cooling, therefore, shifts from an optional efficiency measure to indispensable infrastructure, enabling higher density without blowing past facility power-usage-effectiveness thresholds. The data center liquid cooling market benefits directly because every incremental kilowatt above 20 kW per rack pushes operators toward liquid solutions.
Hyperscale net-zero commitments accelerate adoption
Cloud giants have pledged fleet-wide net-zero emissions and see liquid cooling as a 20% energy-reduction lever compared with legacy air systems. European regulations further require heat recovery from data centers above 1 MW, intensifying uptake of liquid architectures that simplify thermal capture.[3]Max Smolaks, “Heat Reuse: A Management Primer,” Uptime Institute, uptimeinstitute.com These combined voluntary and regulatory forces turn liquid cooling into a compliance infrastructure as well as an operational efficiency strategy, expanding the data center liquid cooling market beyond early adopters.
OEM warranty coverage reduces deployment risk
Server manufacturers now certify entire direct-to-chip loops, eliminating previous concerns about leaks voiding hardware warranties. The policy shift lowers perceived risk and accelerates enterprise spending, broadening the data center liquid cooling industry’s customer base.
Semiconductor reference designs standardize implementation
Nvidia and AMD have published liquid-ready reference boards, simplifying cold-plate alignment and manifold routing. Standardization condenses design cycles for OEM chassis builders and unlocks faster procurement of cooling gear, reinforcing ecosystem maturity.[4]Jingyue Hsiao, “China Fills PFAS-Based Coolant Supply Gap after 3M Exit,” DIGITIMES Asia, digitimes.com
Restraints Impact Analysis of Data Center Liquid Cooling Market*
| Restraint | (~) % Impact on CAGR Forecast | Geographic Relevance | Impact Timeline |
|---|---|---|---|
| Limited field expertise among facility engineers | -2.80% | Global, most pronounced in emerging markets | Medium term (2-4 years) |
| High upfront retrofit costs for brown-field sites | -3.40% | Global, particularly in mature markets | Short term (≤ 2 years) |
| Fluid material-compatibility concerns (long-term seals, PCB) | -1.90% | Global, regulatory focus in Europe | Medium term (2-4 years) |
| Supply risk of specialty dielectric fluids | -2.20% | Global, acute in APAC following 3M exit | Short term (≤ 2 years) |
| Source: Mordor Intelligence | |||
Limited field expertise constrains deployment velocity
Liquid systems demand skills in pipe fitting, leak detection, and pump sizing that many legacy data center staff lack. Training programs are expanding, but until the talent pool deepens, roll-out schedules will remain lengthier than air-based projects.
Retrofit costs challenge brown-field adoption
Facilities built for air cooling must retrofit distribution manifolds, secondary loops, and heat-rejection hardware, often matching or exceeding the capex of new shell-and-core builds. This cost headwind slows penetration among enterprise operators with depreciated assets.
*Our forecasts treat driver/restraint impacts as directional, not additive. The impact forecasts reflect baseline growth, mix effects, and variable interactions.
Data Center Liquid Cooling Market Segment Analysis
By Cooling Technology:
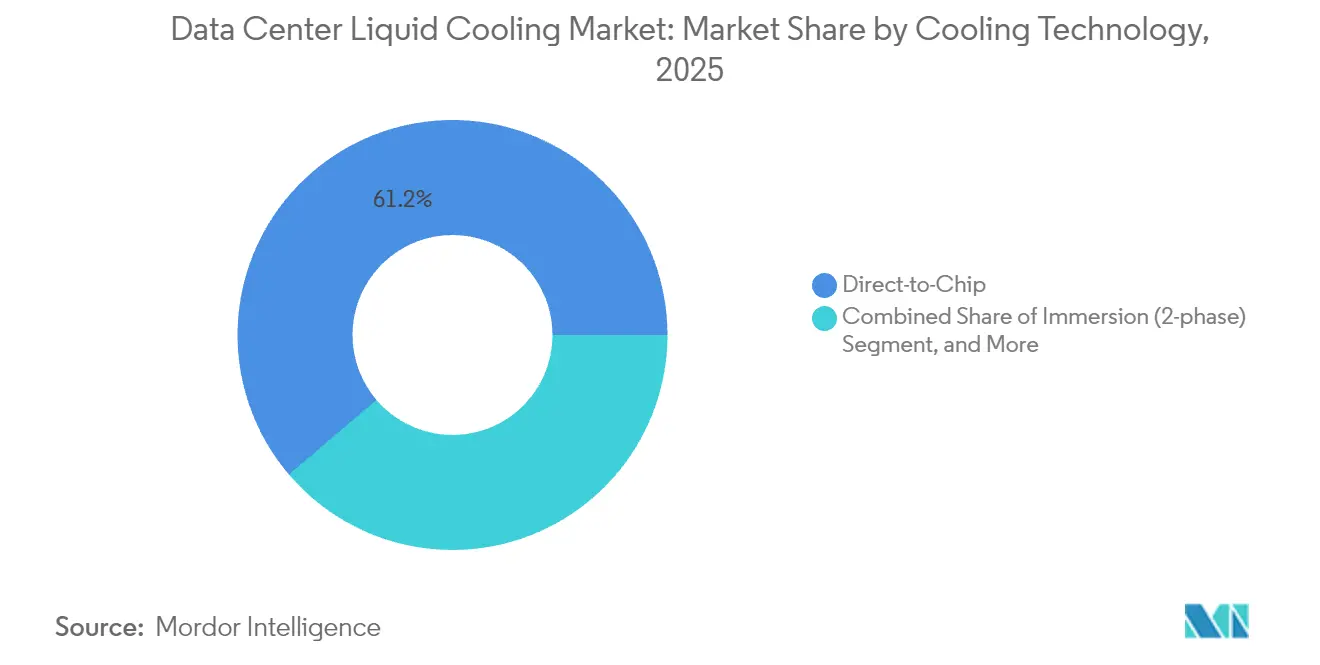
maturation led by direct-to-chipDirect-to-chip captured 42.85% of the 2025 data center liquid cooling market share and will continue to anchor short-term growth. Operators favour its drop-in nature for CPUs and moderate-power GPUs. The data center liquid cooling market size for immersion solutions will climb fastest at a 26.62% CAGR, helped by AI training clusters that need extreme heat flux removal. Facilities are increasingly hybrid, using rear-door heat exchangers for moderate racks and immersion baths for GPU islands. Patent filings by Invented and other Taiwanese firms underscore sustained engineering momentum.
A second-order effect is that component suppliers are redesigning pumps, valves, and quick-disconnects to tolerate higher flow rates and non-conductive fluids. As products standardize, procurement cycles shorten and total installed cost falls, reinforcing the technology shift.



By Coolant Type:
single-phase today, two-phase tomorrowSingle-phase hydrocarbons accounted for the largest slice of the data center liquid cooling market size in 2025 due to mature supply chains. However, two-phase fluorocarbons deliver stronger heat-transfer coefficients and will post a 25.64% CAGR. 3M’s scheduled phase-out of PFAS fluids is reshaping sourcing; Chinese specialty chemical makers are stepping in to backfill demand for semiconductor and server coolant buyers. Governments such as the United Kingdom are funding research into next-generation, low-global-warming-potential fluids, accelerating a broader shift to environmentally aligned chemistries. Operators are also exploring glycol mixes for facilities where water conservation is paramount. Nanofluids, infused with metal oxides or carbon nanotubes, remain at pilot stage, but test results suggest 10-15% conductivity gains that could unlock thinner cold plates in the coming decade.
By Data Center Type:
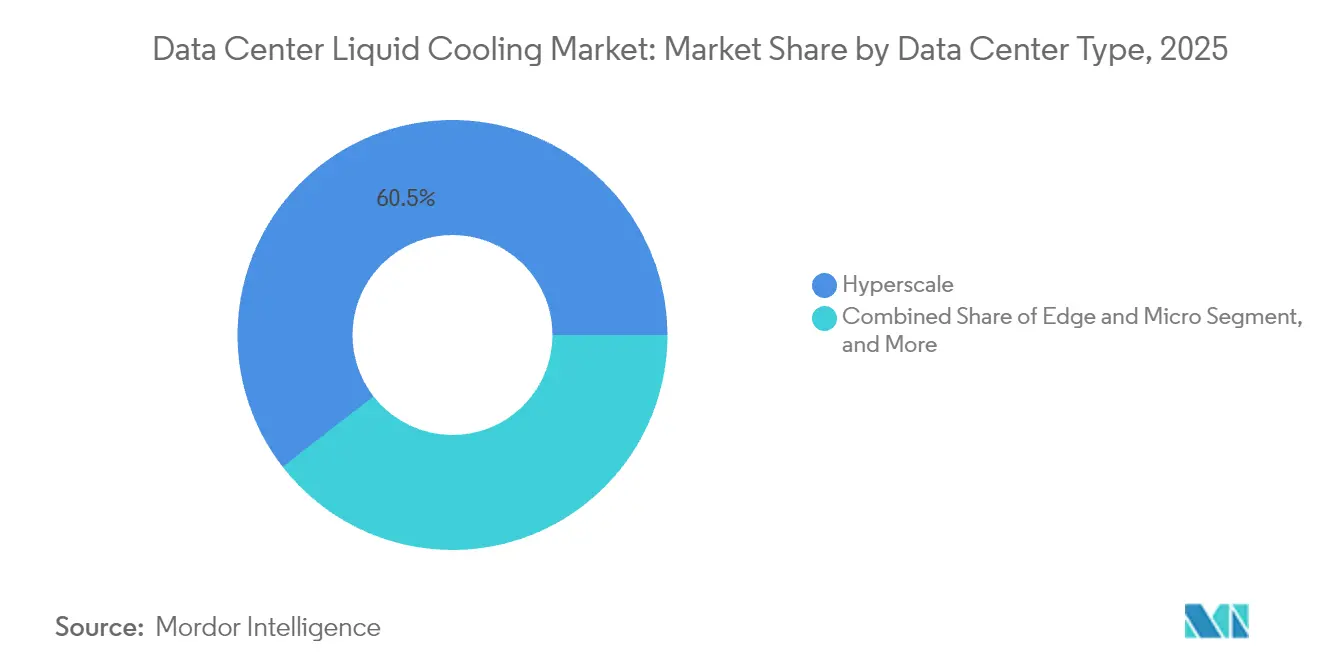
hyperscale leadership drives edge momentumHyperscale players held 38.92% of the market in 2025 and continue to set procurement standards that trickle down to colocation and enterprise tiers. Their heat-reuse pilots, such as the Paris Olympic aquatic center pools heated from a nearby cloud site, showcase demonstrable revenue streams for waste heat. Edge and micro sites will log the highest CAGR at 24.98%, propelled by 5G latency targets and localized AI inference. Compact liquid modules enable 50-70 kW footprints in retail outlets, telecom towers, and manufacturing cells without the noise or airflow constraints of traditional HVAC kits.
As edge footprints spread, service firms specializing in remote liquid maintenance and leak response are emerging, indicating a nascent but critical services sub-segment.
By Application/Workload:
AI/ML dominates spendAI/ML workloads held 34.84% of 2025 buying and will expand at a 25.98% CAGR, ensuring they remain the single biggest revenue source for the data center liquid cooling market. Model training consumes sustained 30-40 kW per rack, and inference clusters can spike unpredictably, both scenarios straining air paths. High-performance computing for climate modeling and genomic sequencing continues to demand dense GPU farms, while cryptocurrency mining remains opportunistic, clustering where power is lowest cost.
Cloud services are consolidating AI training, inference, virtualization, and storage into unified pods. That convergence creates fluctuating heat profiles, which favour liquid systems that maintain narrow temperature deltas regardless of transient spikes. Suppliers such as Delta Electronics report supply tightness for certain large-loop assemblies, confirming brisk demand.
Geography Analysis
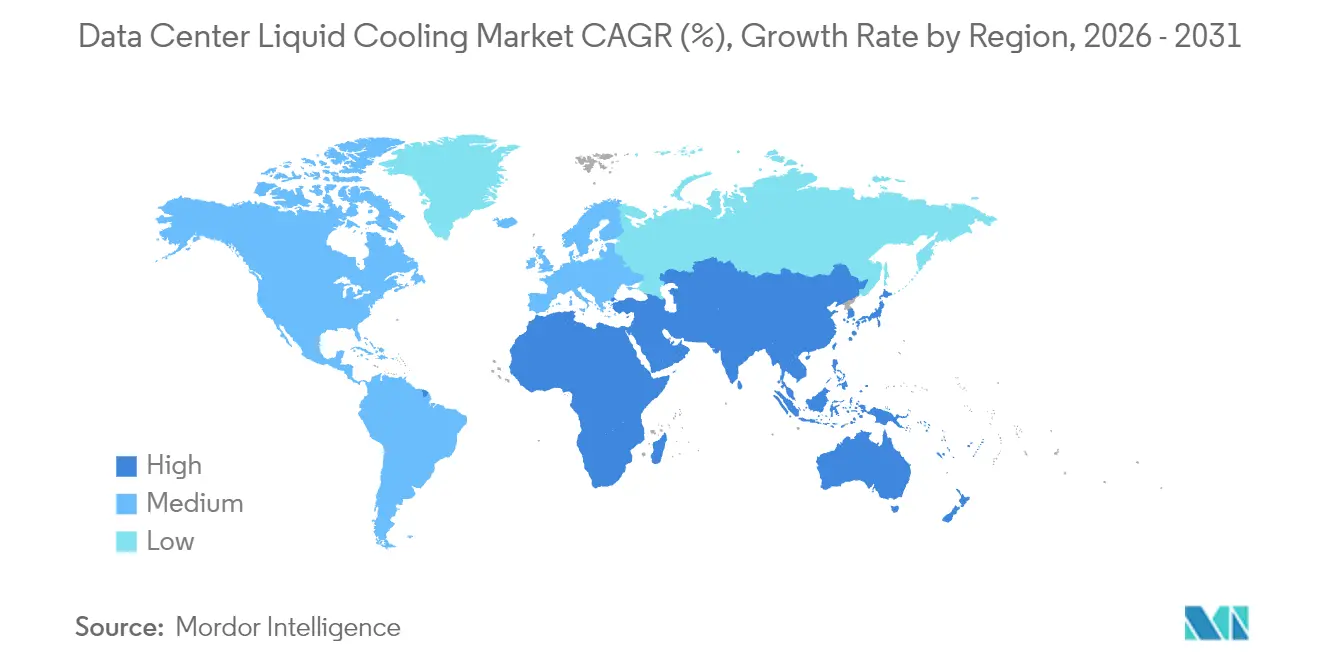
North America Data Center Liquid Cooling Market
North America preserves its lead position thanks to hyperscale capex and pro-investment tax regimes. Kansas grants 20-year sales-tax holidays on data center spending above USD 250 million, and Massachusetts offers similar exemptions for projects over USD 50 million. The Inflation Reduction Act further augments returns with clean-energy credits, tipping many new builds toward liquid-ready designs.
Europe Data Center Liquid Cooling Market
Europe is the second growth engine. The Energy Efficiency Directive obliges data centers above 1 MW to evaluate heat recovery, and Scandinavian district-heating grids provide an economic off-take route for captured thermal energy. France rewards facilities that prove superior power-usage effectiveness with reduced energy taxes. Collectively, these rules elevate liquid systems from an efficiency choice to a compliance requirement, especially where water-side economizers already exist.
APAC Data Center Liquid Cooling Market
APAC represents the fastest-growing regional slice of the data center liquid cooling market. China is bridging the coolant gap created by 3M’s PFAS exit, while Japan’s utilities incentivize energy-efficient compute nodes. India’s rapid digitalization, supported by dedicated data-center-friendly policies in Telangana and Uttar Pradesh, provides greenfield opportunities to leapfrog directly into liquid architectures. Taiwanese manufacturers, headlined by Inventec, dominate global patent filings and are exporting integrated cold-plate assemblies worldwide.
MEA and LATAM Data Center Liquid Cooling Market
Africa, Latin America, and the Middle East remain smaller but strategic. Their hot climates and costly power make air systems less attractive, opening niches where compact immersion baths can serve telecom and fintech workloads with minimal mechanical plant.

Regulatory Landscape
Policy and standards are increasingly linking data center energy and water transparency to cooling system design choices. In the European Union, Commission Delegated Regulation (EU) 2024/1364 introduced energy performance reporting requirements for data centers with installed IT power of at least 500 kW, using the CEN/CENELEC EN 50600-4-2 methodology and covering metrics that touch cooling effectiveness, waste-heat utilization, and water use. Separately, the EU Energy Efficiency Directive framework for data centers above 1 MW elevates heat recovery evaluation into a formal compliance workflow, which aligns with liquid cooling architectures that can capture and route heat more directly than air systems.
In the United States, standards activity is adding structure around liquid-cooled operation and mechanical compliance. ANSI/ASHRAE Standard 90.4-2022 Addendum g (January 2024) expanded mechanical compliance targets relevant to data center cooling systems as facilities prepare for water-cooled IT equipment. At the federal level, proposed legislation in the 119th Congress points to both disclosure and assessment, including a 2025 bill directing a Comptroller General technology assessment of liquid cooling for AI and HPC, and a 2026 bill proposing mandatory reporting of energy and water use for large data centers (peak demand threshold referenced at 25 MW in the proposal).
Competitive Landscape
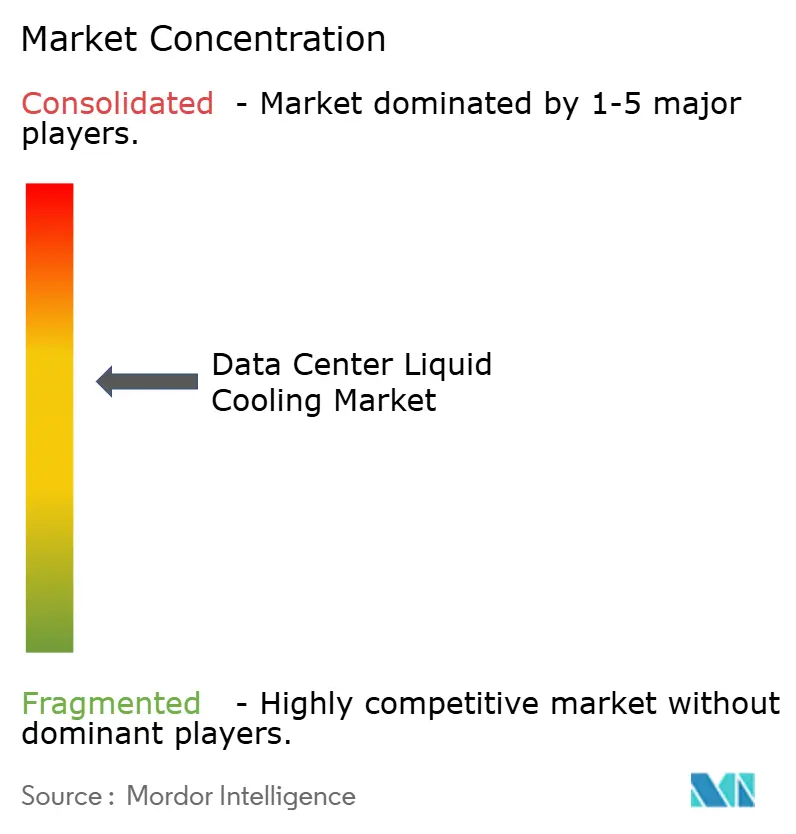
The data center liquid cooling market is moderately fragmented. Schneider Electric, Vertiv, and Alfa Laval extend their HVAC and heat-exchanger portfolios into liquid micro-grids, leveraging channel reach. Specialized vendors such as LiquidStack and CoolIT Systems differentiate on two-phase performance envelopes, while Asetek monetizes decades of desktop PC cooling IP in enterprise rigs. Strategic M&A accelerated: Schneider bought Motivair to secure cold-plate and coolant distribution unit (CDU) technology, and Boyd Corporation acquired Durbin Group to tighten vertical integration.
Patenting momentum remains high; Inventec ranks fourth globally for filed liquid cooling patents, reflecting Asia’s engineering intensity. Yet volatility persists Asetek’s OEM order cancellations in 2024 illustrate that rapid demand shifts can disrupt revenue visibility. Manufacturers that bundle fluids, plates, CDUs, monitoring software, and services into turnkey packages are gaining share because buyers favour simplified procurement.
White-space opportunities include edge-specific sealed immersion boxes, brown-field retrofit kits with minimal downtime, and heat-reuse interface modules that connect to municipal district-heating pipes.
Data Center Liquid Cooling Industry Leaders
Alfa Laval Corporate AB
LiquidStack Inc.
Asetek Inc. A/S
Asperitas
Chilldyne Inc.
- *Disclaimer: Major Players sorted in no particular order
Data Center Liquid Cooling Market Companies Covered in this Report
- Alfa Laval Corporate AB
- Asetek A/S
- Asperitas BV
- Chilldyne Inc.
- CoolIT Systems Inc.
- Fujitsu Ltd.
- Kaori Heat Treatment Co., Ltd.
- Lenovo Group Ltd.
- LiquidStack Inc.
- LiquidCool Solutions Inc.
- Iceotope Technologies Ltd.
- Rittal GmbH and Co. KG
- Schneider Electric SE
- Submer Technologies SL and Submer Inc.
- Vertiv Group Corp.
- Wiwynn Corporation
- 3M Company
- Engineered Fluids Inc.
- Green Revolution Cooling Inc.
- Solvay SA
- Mikros Technologies
- Midas Green Technologies LLC
- USystems Ltd. (Legrand Group)

Market Opportunities and Future Outlook
AI-oriented campus builds and modular AI-ready expansion patterns are creating whitespace for liquid cooling suppliers that can deliver standardized, scalable facility and rack-level packages (CDUs, cold plates, manifolds, controls, and service). Recent project activity shows how power-dense AI deployments are being planned around liquid-capable infrastructure: Pure Data Centres Group announced a 550 MW AI data center campus in Seinajoki, Finland (July 2026), with Phase 1 fully leased, and G42 indicated the 200 MW first phase of the Stargate UAE AI infrastructure cluster is on track for Q3 2026 delivery (April 2026). These programs suggest demand for repeatable, block-based cooling architectures that fit the fast hardware refresh cycles of GPU clusters.
Standardization and interoperability remain another opportunity area, particularly where owners want multi-vendor procurement without bespoke engineering for every hall. ASHRAE TC 9.9 has codified liquid cooling classes (W1 to W45) and guidance for water-based heat transfer fluids, and industry efforts such as the Open Compute Project (OCP) alignment work with ASHRAE support more consistent facility-readiness requirements across hyperscale and colocation designs. As reporting regimes in Europe place more attention on cooling effectiveness, waste-heat utilization, and water use, solutions that simplify measurement, documentation, and heat-reuse interfaces (including district heating connections in Northern Europe) broaden the addressable scope beyond early AI training clusters into compliance-driven retrofit and new-build programs.
Recent Industry Developments in Data Center Liquid Cooling Market
- June 2026: Asetek unveiled its next-generation Emma V3 (Gen10) liquid cooling architecture at COMPUTEX 2026, highlighting a redesigned cold-plate approach intended for higher-performance computing platforms. The launch supports Asetek's positioning as liquid cooling requirements expand from niche HPC into AI-oriented enterprise and edge deployments that need repeatable, serviceable designs.
- May 2026: LiquidStack announced commercial availability of its GigaModular CDU platform, scaling to up to 14 MW per building block. A modular CDU approach fits AI data center buildouts delivered in standardized blocks, and it reduces integration friction for operators expanding liquid capacity hall by hall.
- August 2024: LiquidStack launched CDU-1MW, positioned as the first product in a family of universally compatible coolant distribution units for direct-to-chip liquid cooling. Broad compatibility at the CDU layer can shorten qualification cycles for colocation and enterprise buyers that mix server OEMs and rack designs while transitioning from air to liquid.


Data Center Liquid Cooling Market Report Scope and Research Methodology
Market Definition and Coverage
This market covers revenue generated from liquid-based cooling used inside data centers to remove heat from IT equipment, where cooling is delivered through liquids instead of air-only approaches. It includes solution hardware, supporting liquids, and related services sold for new builds and upgrades.
Scope exclusions: We exclude room-level air cooling-only systems, general HVAC equipment not dedicated to data center liquid loops, and facility construction spend that is not tied to cooling system revenue.
Segments Covered in This Report
- Segmentation by Cooling Technology
- Immersion Cooling
- Direct-to-Chip Liquid Cooling
- Rear-Door Heat Exchangers (RDHx)
- Cold-Plate / In-row Liquid Systems
- Segmentation by Coolant Type
- Single-Phase Hydrocarbon Fluids
- Two-Phase Fluorocarbon Fluids
- Water / Glycol Solutions
- Nanofluids and Other Specialty Liquids
- Segmentation by Data Center Type
- Hyperscale
- Colocation
- Enterprise / On-Premise
- Edge and Micro DCs
- Segmentation by Application / Workload
- High-Performance Computing (HPC)
- Artificial Intelligence / Machine Learning
- Cryptocurrency Mining
- Cloud and Virtualisation
- Segmentation by Geography
- North America
- United States
- Canada
- South America
- Brazil
- Rest of South America
- Europe
- Germany
- United Kingdom
- France
- Netherlands
- Russia
- Rest of Europe
- APAC
- China
- Japan
- India
- Australia
- Rest of APAC
- Middle East and Africa
- Middle East
- Saudi Arabia
- United Arab Emirates
- Africa
- South Africa
- Rest of MEA
- Middle East
- North America
Data Sources, Market Sizing, and Validation
Desk Research
Desk work started with a clear list of what counts as liquid cooling in a data center and what does not, so the revenue boundary stayed consistent across regions. Public sources were used to build the demand context, such as Uptime Institute publications, US DOE efficiency materials, IEA data center energy commentary, and US Census Bureau trade and manufacturing statistics.
We also reviewed signals that connect compute growth to cooling needs, including operator sustainability reports, public filings and investor decks from relevant supply-chain participants, and reputable press coverage on AI server deployments and colocation expansions. For cross-checks, we used paid subscriptions for company financials and intelligence, news and financials, patent databases, and an import-export shipment-level database where product mapping was feasible. The sources listed here are illustrative, and many other public and paid references were used for data collection, validation, and clarification during the study.
Primary Interviews and Surveys
Primary inputs were gathered from liquid cooling ecosystem participants across equipment supply, integration and design, and data center operations, so pricing, adoption timing, and replacement cycles could be tested in plain language. We also checked regional differences across major data center build corridors in APAC, EMEA, and the Americas, which helped close gaps where public data stays high level.
Distribution of primary research fieldwork respondents
| Company type | Respondent position | Region |
|---|---|---|
| Top tier: 34% | CXOs: 19% | APAC: 45% |
| Mid tier: 47% | Functional/Unit leaders: 35% | EMEA: 30% |
| Smaller Players: 19% | Managers: 46% | Americas: 25% |
Market-Sizing & Forecasting
Sizing was built using top-down and bottom-up logic, where data center build activity and high-density compute adoption are translated into an addressable cooling demand pool, and then expressed in value using validated pricing. To keep the model repeatable, we first used region-level indicators such as data center capacity additions, rack density shifts driven by AI and HPC, liquid-cooled rack penetration, typical cooling loop configuration per deployment, and the mix between direct-to-chip and immersion installations.
Those totals were then corroborated with selective bottom-up approximations, using sampled system pricing, channel checks with integrators, and supplier-side revenue splits to confirm that the implied volumes and average selling prices made sense. Where a direct roll-up was incomplete, gaps were handled by applying adoption rates by data center type and by using conservative ranges for retrofit timing, which were narrowed after expert feedback. For forecasting, we relied on scenario analysis supported by multivariate regression-style relationships between capacity growth, density, and liquid cooling penetration, and the assumptions were adjusted when primary respondents indicated a different pace for ASP progression or rollout schedules.
Data Validation & Update Cycle
Validation is done through several passes, where model outputs are compared with independent signals like data center power additions, public project pipelines, and observed shifts toward higher rack densities. When outliers appear, the drivers are traced back to a small set of inputs, and the assumptions are rechecked with additional calls or targeted follow-ups.
Before sign-off, another analyst reviews the arithmetic, scope boundary, and year-on-year movements so sudden jumps are either explained or corrected. Reports are refreshed annually, and interim updates are made when material events occur that can change adoption timing or pricing. Right before delivery, a final review pass is completed so clients receive the latest updated view instead of an older snapshot.
Mordor Intelligence's Data Center Liquid Cooling Market Size Versus Other Published Estimates
Published market sizes for data center liquid cooling can vary more than expected because the underlying inputs move quickly and each publisher locks assumptions on a different date. Differences usually show up around which year is treated as the base, how currency conversion is timed, and how average selling prices are stepped down as volumes rise.
A refresh-led gap is common in this space because pricing for cold plates, manifolds, and immersion systems has been shifting, and the adoption curve is not uniform across hyperscale, colocation, and enterprise sites. When exchange rates are captured at a different point in the year or when retrofit activity is assumed to ramp faster than new build deployments, totals can drift. The latest refresh pass, currency timing checks, and ASP normalization rules are key controls applied by Mordor Intelligence.
Benchmark comparison across 2025 market estimates
| Source | Market Size | Gaps in Research Methodology |
|---|---|---|
| Mordor Intelligence | USD 5.52 B (2025) | |
| Global Consultancy A | USD 6.65 B (2025) | Uses a broader value bucket in some cases, where service and integration revenue can be counted more fully alongside equipment, and price curves may be held flatter across the base year and early forecast years. |
| Industry Publisher B | USD 4.80 B (2025) | Often applies a more conservative adoption ramp for liquid cooling outside hyperscale sites and can undercount retrofit-driven demand when only new build installations are emphasized. |
Taken together, the spread mainly comes from how fast adoption is assumed to move and how pricing is treated as deployments scale, which then feeds into currency-normalized revenues. By tying the model to clear deployment indicators and rechecking the sensitive inputs that move the total, we keep the estimate explainable and easier to replicate year after year.


Key Questions Answered in the Report
How large is the data center liquid cooling market in 2026?
The sector generated USD 6.77 billion in revenue during 2026.
What CAGR is expected for data center liquid cooling between 2026 and 2031?
Revenue is projected to rise at a 22.65% CAGR over the five-year span.
Which cooling technology currently leads adoption?
Direct-to-chip systems hold the largest share at 42.85% of 2025 revenue.
Why are two-phase fluids growing faster than single-phase coolants?
They provide higher heat-transfer coefficients, enabling operators to serve AI racks that exceed 30 kW.
Which data center segment will grow fastest?
Edge and micro facilities are forecast to register the highest CAGR at 24.98% through 2031.
How do regulations influence liquid cooling uptake in Europe?
The EU Energy Efficiency Directive mandates waste-heat recovery for facilities above 1 MW, making liquid cooling an easier compliance path.
Page last updated on:
- Data Center Cooling Market Cooling across all regions, split by cooling technology, cooling component and facility type.
- Data Center Server Market Servers across the global market, covering tier, facility size and facility type.
- Artificial Intelligence (AI) Data Center Market AI facilities worldwide, split by facility type, component and tier.
- Data Center Immersion Cooling Market Immersion cooling worldwide, split by type, cooling fluid and application.
- United States Data Center Cooling Market The US cooling, split by facility type, tier and cooling technology.
- India Data Center Cooling Market India's cooling, split by facility type, tier and cooling technology.
- North America Data Center Cooling Market North America's cooling, split by cooling technology, cooling component and tier.
- Uk Data Center Cooling Market The UK cooling, split by cooling technology, type and end user vertical.
- China Data Center Cooling Market China cooling, split by facility type, tier and cooling technology.
- Data Center UPS Market UPS systems across all regions, split by UPS type, power capacity and architecture.
- North America Data Center Power Market North America power systems, split by type, facility type and end-user industry.
- Hong Kong Data Center Cooling Market Cooling demand across Hong Kong, covering facility type, tier and cooling technology.
- North America Data Center Server Market North America servers, split by data-center tier, form factor and application / workload.
- United States Artificial Intelligence (AI) Data Center Market The US's AI facilities, split by facility type, component and tier.


 Your data is secure and never sold or shared.


