Market Overview
| Study Period | 2021 - 2031 |
|---|---|
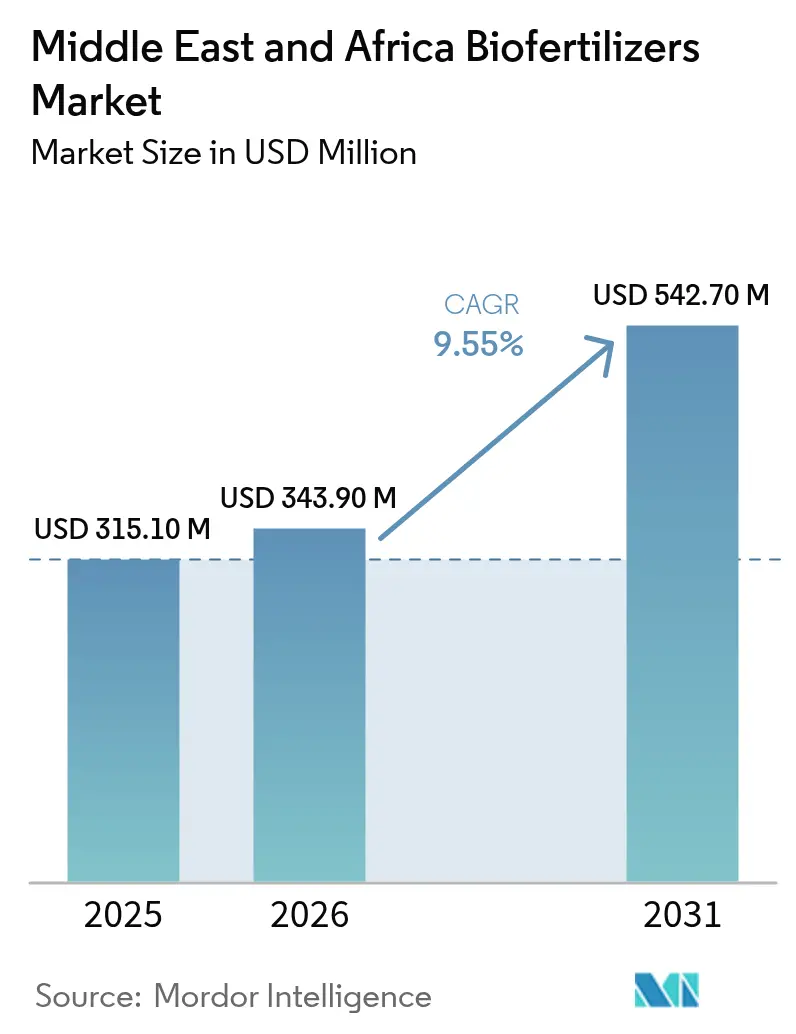
| Base Year Market Size (2025) | USD 315.10 Million |
| Market Size (2026) | USD 343.90 Million |
| Market Size (2031) | USD 542.70 Million |
| Growth Rate (2026 - 2031) | 9.55% CAGR |
| Fastest Growing Market | Middle East |
| Largest Market | Africa |
Major Players *Disclaimer: Major Players sorted in no particular order Image © Mordor Intelligence. Reuse requires attribution under CC BY 4.0. | |
Middle East And Africa Biofertilizers Market Analysis by Mordor Intelligence
The Middle East and Africa biofertilizers market size was valued at USD 315.10 million in 2025 and estimated to grow from USD 343.90 million in 2026 to reach USD 542.70 million by 2031, at a CAGR of 9.55% during the forecast period (2026-2031). Region-specific agronomic challenges, including soil salinity, phosphate fixation, and the instability of synthetic fertilizer supply chains, are driving growers toward microbial solutions. Africa accounted for the majority of the projected revenue, with significant contributions from Nigeria’s cassava and maize production regions and South Africa’s export-focused citrus and wine industries. Meanwhile, greenhouse operators in Saudi Arabia and the United Arab Emirates have adopted liquid microbial fertigation systems to ensure consistent nutrient delivery. Rhizobium inoculants held the largest market share due to the prevalence of pulse rotations in many rain-fed systems. However, phosphate-solubilizing bacteria are experiencing the fastest growth as growers address rock-phosphate shortages and fluctuating diammonium phosphate prices. Liquid formulations dominate the market, driven by the need for uniform root-zone distribution in drip irrigation systems used in Gulf greenhouses and South African vineyards.
Key Report Takeaways
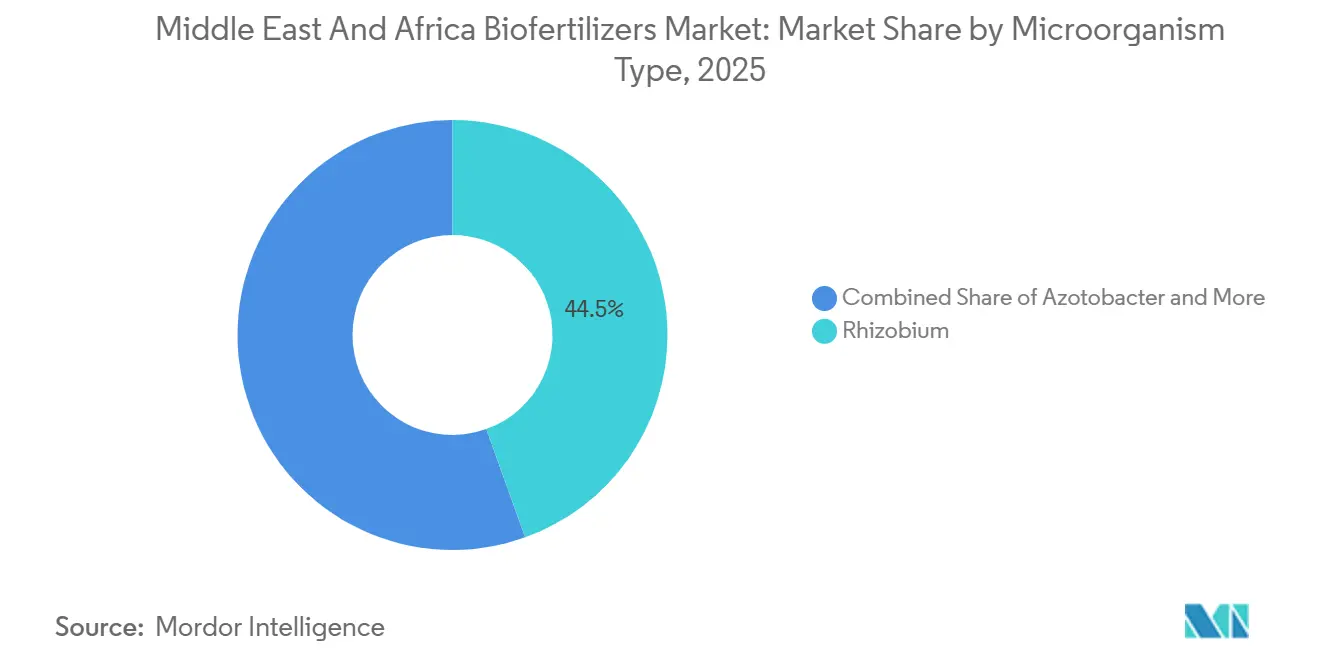
- By microorganism type, rhizobium products captured 44.5% of the Middle East and Africa biofertilizers market share in 2025, and are the fastest-growing segment, with a 9.8% CAGR from 2026-2031.
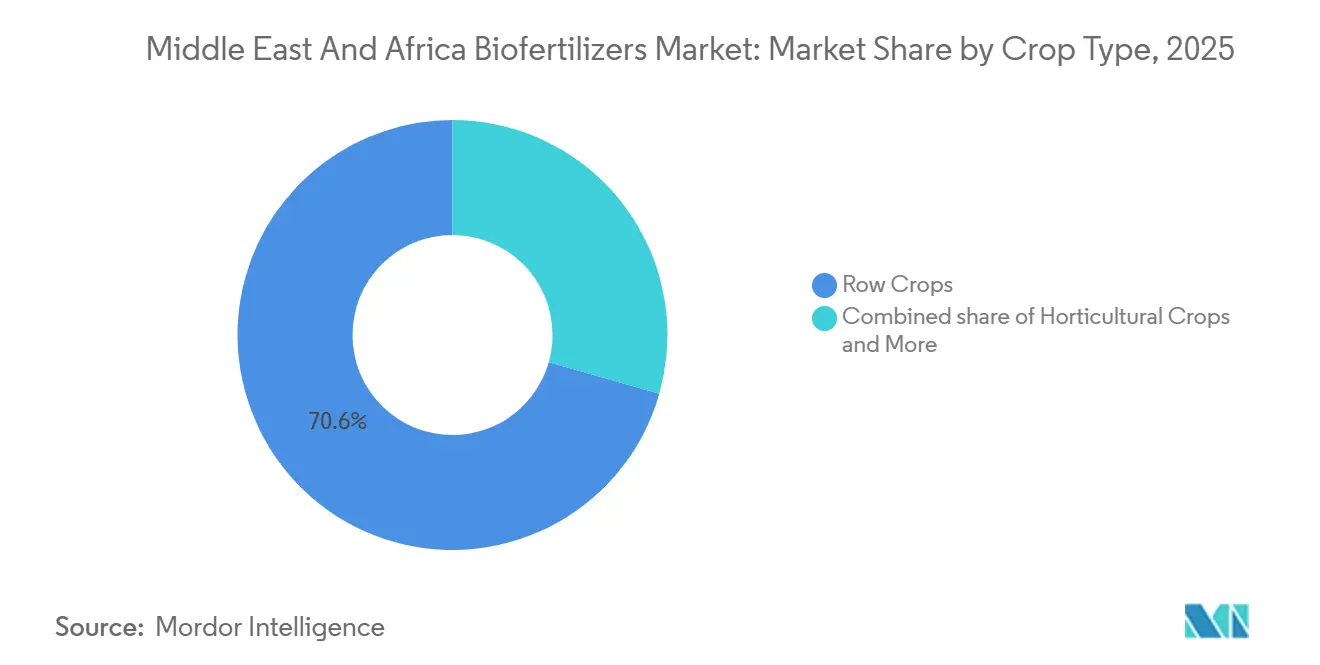
- By crop type, row crops command 70.6% market share in 2025, while horticultural crops represent the fastest-growing crop segment at 9.7% CAGR from 2026-2031.
- By geography, Africa captured 78.3% of the Middle East and Africa biofertilizers market share in 2025, while the Middle East represents the fastest-growing segment at 9.8% CAGR 2026-2031.
Note: Market size and forecast figures in this report are generated using Mordor Intelligence’s proprietary estimation framework, updated with the latest available data and insights as of 2026.
Middle East And Africa Biofertilizers Market Trends and Insights
Drivers Impact Analysis*
| Driver | (~) % Impact on CAGR Forecast | Geographic Relevance | Impact Timeline |
|---|---|---|---|
| Rapid expansion of organically certified farmland | +1.8% | East Africa and North Africa | Medium term (2-4 years) |
| Government subsidies and preferential import-duty waivers for bio-inputs | +1.5% | Gulf states and North Africa | Short term (≤2 years) |
| Volatile synthetic fertilizer prices driving input substitution | +2.1% | Sub-Saharan Africa and Gulf economies | Short term (≤2 years) |
| Salinity-mitigation programs in Gulf soils | +1.2% | UAE, Qatar, Saudi Arabia | Long term (≥ 4 years) |
| Boom in high-tech greenhouse acreage in arid economies | +1.6% | Gulf states and North Africa | Medium term (2-4 years) |
| Carbon-credit pilots for soil microbiome projects | +0.9% | Kenya, South Africa, Morocco | Long term (≥ 4 years) |
| Source: Mordor Intelligence | |||
Rapid Expansion of Organically Certified Farmland
The "World of Organic Agriculture 2025" report states that certified organic farmland in Africa has reached 3.4 million hectares in 2023, recording a 24% increase in organic farmland[1]Source: Research Institute of Organic Agriculture, “World of Organic Agriculture 2025,” fibl.org. Certified organic acreage across key Middle East and Africa markets expanded between 2019 and 2024, with Egypt, Kenya, and South Africa leading adoption rates. This growth trajectory accelerates biofertilizer demand as organic certification standards mandate biological inputs over synthetic alternatives. The organic rule set prohibits most synthetic nutrients and has pushed grower cooperatives to adopt Rhizobium and Azospirillum inoculants for nitrogen and phosphorus management. Trade harmonization under the African Continental Free Trade Area is letting Kenyan suppliers reach North and West African buyers without duplicate registrations, further widening the addressable customer base. Morocco's Green Morocco Plan has allocated significant resources to organic transition support, creating regulatory frameworks that favor biological inputs and establish quality certification pathways. The enlarged distribution footprint directly lifts demand for biobased inputs within the Middle East and Africa biofertilizers market.
Government Subsidies and Preferential Import Duty Waivers for Bio Inputs
Government subsidy schemes across the region increasingly favor biological inputs, with Morocco's organic-input subsidy program reducing farmer adoption costs compared to unsubsidized synthetic alternatives. Saudi Arabia's Ministry of Environment, Water, and Agriculture has implemented targeted support for greenhouse operators adopting biological nutrient management systems, aligning with Vision 2030 sustainability objectives. These policy shifts reflect strategic recognition that biological inputs support food security goals while reducing import dependency. The UAE's National Food Security Strategy 2051 explicitly prioritizes local production technologies, including microbial inoculants for controlled environment agriculture. South Africa's regulatory framework under the Fertilizers, Farm Feeds, Agricultural Remedies and Stock Remedies Act provides clear pathways for biofertilizer registration. These fiscal incentives shrink the cost gap with subsidized urea and encourage first-time trials, accelerating penetration across the Middle East and Africa biofertilizers market.
Volatile Synthetic Fertilizer Prices Driving Input Substitution
Fertilizer prices, including urea, have shown volatility. According to the World Bank, fertilizer prices are projected to be approximately 21% higher in 2025 compared to 2024, with some instances of significant price spikes, after gas supply disruptions and export curbs from Russia and China. Import-dependent Middle East and Africa countries experienced synthetic fertilizer price spikes during 2022-2024, redirecting agricultural spending toward locally available biological alternatives. This volatility particularly impacts smallholder farmers who lack buffer capacity for input cost fluctuations. The African Development Bank's Africa Fertilizer Financing Mechanism has recognized price instability as a structural constraint, promoting domestic production of both mineral and biological fertilizers. The price differential creates market entry windows for regional biofertilizer producers who can offer cost-competitive alternatives with acceptable agronomic performance.
Boom in High Tech Greenhouse Acreage in Arid Economies
The Abu Dhabi Registration Authority (ADRA) reported the issuance of 152 new agricultural licenses between January and September 2025, representing a 29% increase compared to the 118 licenses issued during the same period in 2024. This highlights significant growth in local food production infrastructure. Controlled environment acreage across the Gulf increased significantly, primarily concentrated in the United Arab Emirates, Saudi Arabia, and Qatar[2]Source: International Finance Corporation, “Greenhouse Expansion in the Gulf,” ifc.org . Greenhouse operators in the region utilize drip fertigation systems, which are compatible with liquid microbial blends designed for automated injectors. Qatar's National Food Security Strategy targets 70% greenhouse-based self-sufficiency, driving demand for specialized microbial formulations adapted to soilless growing systems. The use of mycorrhizal inoculants mixed into coco coir substrates has been shown to reduce phosphorus runoff and lower fertilizer costs, while also assisting growers in obtaining Global G.A.P. certification for exports. This growth in protected cultivation channels steadily increases incremental sales into the Middle East and Africa biofertilizers market.
Restraints Impact Analysis*
| Restraint | (~) % Impact on CAGR Forecast | Geographic Relevance | Impact Timeline |
|---|---|---|---|
| Dominance of subsidized synthetic fertilizers | -2.8% | Nigeria, Egypt, Algeria, and Morocco | Short term (≤ 2 years) |
| Low farmer awareness and weak extension networks | -2.1% | Sub-Saharan Africa | Medium term (2-4 years) |
| Counterfeit / low-quality inoculants from regulatory gaps | -1.6% | West and East Africa | Short term (≤ 2 years) |
| Cold-chain logistics hurdles for liquid formulations | -1.4% | Inland Africa, high-temperature routes | Medium term (2-4 years) |
| Source: Mordor Intelligence | |||
Dominance of Heavily Subsidized Synthetic Fertilizers
National fertilizer subsidy programs in countries such as Nigeria and Egypt provide structural advantages to synthetic inputs, limiting the adoption of biological alternatives in price-sensitive market segments. In Nigeria, the fertilizer subsidy program, while aimed at enhancing food security, unintentionally restricts the use of biofertilizers by sustaining artificial price advantages for imported synthetic fertilizers. Similarly, Egypt enforces a controlled price for urea, which is significantly lower than the free-market price, creating a cost barrier for microbial alternatives. These pricing policies encourage farmers to favor fertilizers with quick nutrient release, despite stewardship programs promoting practices for improved soil health. However, the fiscal burden of maintaining these subsidy programs may present future opportunities for biological inputs, as governments explore cost-effective solutions to enhance agricultural productivity while alleviating budgetary pressures.
Low Farmer Awareness and Weak Extension Networks
Extension services in Sub-Saharan Africa currently reach less than 15% of smallholder farmers, providing inadequate technical support for the adoption of biological inputs. This limited coverage poses significant challenges to market growth. The lack of extension capacity hinders farmer education on critical aspects such as proper application techniques, storage requirements, and performance expectations for biofertilizer products. The knowledge gap is particularly pronounced for liquid formulations, which require specific handling and precise application timing. While private agribusinesses deploy their own field teams, their services are primarily concentrated on export-oriented horticulture, leaving staple grain-growing regions underserved. Digital advisory platforms provide SMS-based tips, however, their effectiveness is limited by inconsistent data coverage and low smartphone penetration. Consequently, low technical literacy continues to impede demand growth in the biofertilizers market across the Middle East and Africa.
*Our forecasts treat driver/restraint impacts as directional, not additive. The impact forecasts reflect baseline growth, mix effects, and variable interactions.
Segment Analysis
By Microorganism Type: Rhizobium Anchors Legume Rotations
Rhizobium inoculants captured 44.5% of the Middle East and Africa biofertilizers market share in 2025 and exhibited the fastest growing CAGR of 9.8% from 2026-2031, reflecting the dominance of chickpea, lentil, and soybean rotations in Kenya, Morocco, and South Africa. Phosphate-solubilizing bacteria are being sought by growers to unlock native phosphorus in soils facing high diammonium phosphate prices. Azospirillum and Azotobacter segments are expanding in cereal systems where nitrogen fixation can trim synthetic urea without yield losses. Mycorrhizal products are penetrating Gulf and North African horticulture because they improve water-use efficiency in saline soils.
Rhizobium seed treatments now dominate mechanized farms because coating lines ensure uniform coverage and rapid nodulation. Soil-applied granular blends remain popular among smallholders who broadcast microbes during land preparation, even though field performance varies with moisture. Bundled consortia that pair nitrogen fixers with phosphate solubilizers are gaining favor because they deliver multiple nutrients in one pass, lowering labor. The diversity of microbial modes of action broadens the customer base and supports steady volume growth for the Middle East and Africa biofertilizers market.


By Crop Type: Row Crops Dominate while Horticulture Accelerates
Row crops, including maize, wheat, and pulses, generated a market share of 70.6% in market revenue in 2025 as broad-acre farms adopted Rhizobium and Azospirillum to curb nitrogen costs. Horticultural crops are set to expand at the fastest 9.7% CAGR from 2026-2031 because controlled-environment acreage in the Gulf and North Africa is rising quickly and demands residue-free nutrition. Export growers report that biofertilizer use helps them meet strict European residue limits and secure premiums for tomatoes and peppers. Commercial crops such as cotton and sugarcane use microbes more selectively, yet show promising trials that cut phosphorus runoff into waterways.
Coffee estates in Kenya and Ethiopia add mycorrhizal blends to improve drought resilience and bean flavor for specialty buyers. South African wine producers integrate Trichoderma and Rhizobium combinations into cover crops to raise organic matter and support biodiversity certification. Gulf fodder producers test salt-tolerant nitrogen fixers to raise yields of alfalfa fed to dairy herds. The widening set of crop use cases lifts overall demand inside the Middle East and Africa biofertilizers market.
Geography Analysis
Africa holds the largest market share of 78.3% in 2025, driven by key agricultural regions such as Nigeria’s cassava and maize belt, South Africa’s citrus and wine export clusters, and Kenya’s horticultural corridor along the Rift Valley. South Africa is projected to achieve significant growth through 2031, as commercial growers integrate biofertilizers with precision soil mapping and variable rate spreaders. Kenya is anticipated to grow rapidly, supported by government programs that reimburse a portion of microbial input costs for certified export cooperatives. The rest of Africa, including Nigeria, Ethiopia, Ghana, and Uganda, is anticipated to expand steadily, driven by subsidy reforms and donor-funded extension programs that increase awareness across staple crop regions.
The Middle East is forecast to grow at the fastest regional growth rate of 9.8% CAGR from 2026-2031 within the Middle East and Africa biofertilizers market. In Saudi Arabia, greenhouse tunnels and date-palm plantations are scaling up, utilizing mycorrhizal and phosphate-solubilizing blends to address soil salinity and reduce reliance on imported fertilizers. The United Arab Emirates is advancing vertical farming in Abu Dhabi and Dubai, where liquid microbial consortia are applied through closed-loop fertigation systems, reducing nutrient losses[3]Source: Pure Harvest Smart Farms, “Fertigation Systems,” pureharvest.ae. The rest of the Middle East, including Qatar, Kuwait, and Bahrain, is adopting microbial solutions in protected vegetable systems, although high synthetic fertilizer subsidies continue to limit market penetration.
Cross-border trade is increasing as localized production shortens freight times and preserves product viability, boosting the biofertilizers market size across both subregions. Kenyan and South African producers now ship liquid biofertilizer packs to North and West Africa within a short timeframe under continental free-trade agreements. In the Gulf region, distributors import concentrated mother cultures from Europe and repackage them locally, avoiding heat stress that previously reduced shelf life during ocean transit. The market's geographic expansion is thus supported by shorter supply chains, harmonized regulations, and government food-security policies that promote biologically based agricultural inputs.
Competitive Landscape
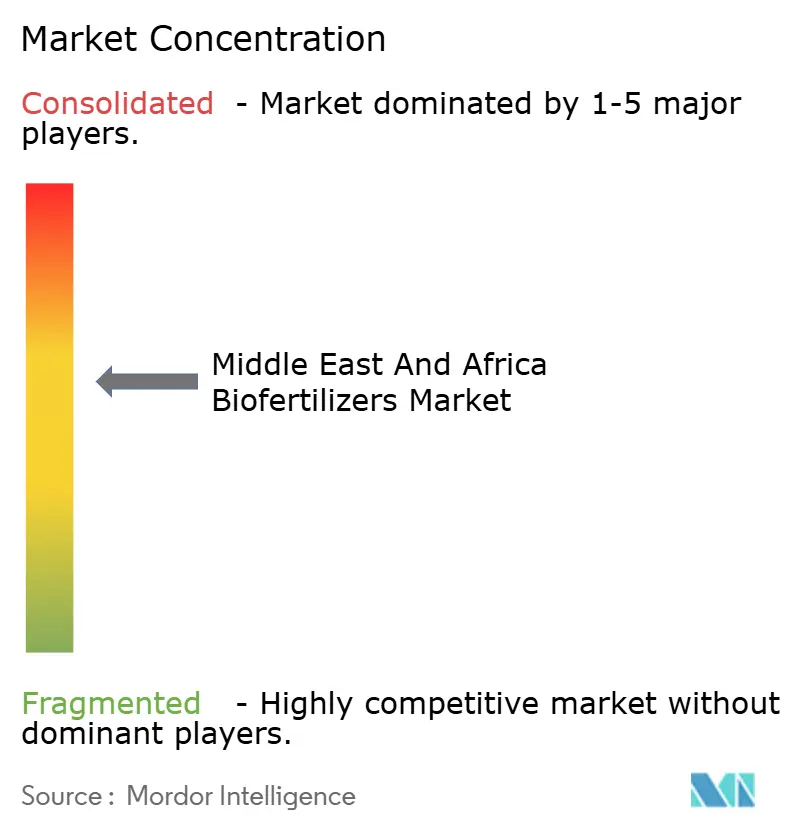
The Middle East and Africa biofertilizers market is moderately concentrated in 2025, with the top suppliers accounting for a significant share of the projected revenue. Companies such as Novonesis Group, UPL Ltd, and Rizobacter Argentina S.A. operate blending plants in Egypt, Kenya, and South Africa, enabling delivery to most commercial hubs within a short timeframe. BASF SE and Bayer AG incorporate microbial lines into digital soil diagnostics, which provide recommendations on optimal dosage and timing, thereby increasing switching costs for growers. Smaller firms, including BioNitrogen Holdings and Symborg, are piloting salt-tolerant nitrogen fixers targeted at Gulf irrigation projects, where soil electrical conductivity is high.
Localization is a key strategy in the region due to the limited availability of reliable chilled logistics outside major cities. UPL’s Cairo facility produces both liquid and powder biofertilizers and ensures delivery to farms in Upper Egypt within a short period, reducing product spoilage significantly. Corteva Agriscience’s joint venture in Morocco focuses on coating chickpea and lentil seeds with Rhizobium, combining microbial nutrition with drought-tolerant genetics to enhance yields on rain-fed plots. Lallemand’s acquisition of a South African blending facility introduced shelf-stable indigenous strains and doubled its production capacity in sub-Saharan Africa.
Digital enablement is emerging as a critical area of competition. Bayer AG integrates mycorrhizal seed treatments with its Climate FieldView platform, allowing farmers to track soil carbon improvements for voluntary credit markets. Novonesis Group includes QR codes on product packaging, directing users to dosage calculators and multilingual chat support in English, Arabic, and Swahili, which enhances correct application and encourages repeat purchases. FMC Corporation supports village-level agents in Kenya by combining liquid biofertilizer deliveries with microloans, improving affordability for smallholder farmers. Competitive intensity is anticipated to increase as Asian biological specialists, such as Seipasa and AgriLife, enter the market with locally adapted strains.
Middle East And Africa Biofertilizers Industry Leaders
UPL Limited
Lallemand Inc
Corteva Agriscience
Novonesis Group
Rizobacter Argentina S.A. (Bioceres Crop Solutions Corp.)
- *Disclaimer: Major Players sorted in no particular order

Recent Industry Developments
- August 2024: Biogrand, an Egyptian biofertilizer manufacturer, has allocated SAR 25 million (USD 6.6 million) for a new venture in Saudi Arabia. In collaboration with Saudi investors, they established a factory by the end of February 2025. This project aims to fulfill the demand in the Saudi market and export 50% of its production to four Arab countries.
- August 2024: Legume Technology, an agri-biotech firm, has received approval to manufacture biofertilizers tailored for African markets. This initiative aims to make biofertilizer technology a cost-effective and readily available agricultural resource for small-scale producers across Africa.
- May 2024: Del Monte Kenya Ltd., a leading producer, marketer, and distributor of high-quality fresh fruits and prepared foods in Europe, Africa, and the Middle East, has partnered with Vellsam Materias Bioactivas, a top-tier producer of biotechnological solutions, to launch an innovative biofertilizer plant in Kenya. The plant will operate under the brand name De lOra Bio.


Middle East And Africa Biofertilizers Market Report Scope
A biofertilizer is a substance that contains living microorganisms that promote plant growth by increasing the availability of nutrients to the plant. The Middle East and Africa Biofertilizers Market is Segmented by Microorganism Type (Rhizobium, Azospirillum, Azotobacter, Mycorrhiza, Phosphate Solubilizing Bacteria, and Other Microorganism Types), by Crop Type (Commercial Crops, Fruits and Vegetables, Grains and Cereals, and More), and by Geography (Africa and the Middle East). The Market Forecasts are Provided in Terms of Value (USD) and Volume (Metric Tons).
By Microorganism Type
| Rhizobium |
| Azotobacter |
| Azospirillum |
| Phosphate-solubilizing Bacteria |
| Mycorrhiza |
| Other Microorganisms |
By Crop Type
| Row Crops |
| Horticultural Crops |
| Cash Crops |
By Geography
| Africa | South Africa |
| Nigeria | |
| Egypt | |
| Rest of Africa | |
| Middle East | Iran |
| Saudi Arabia | |
| Rest of Middle East |
| By Microorganism Type | Rhizobium | |
| Azotobacter | ||
| Azospirillum | ||
| Phosphate-solubilizing Bacteria | ||
| Mycorrhiza | ||
| Other Microorganisms | ||
| By Crop Type | Row Crops | |
| Horticultural Crops | ||
| Cash Crops | ||
| By Geography | Africa | South Africa |
| Nigeria | ||
| Egypt | ||
| Rest of Africa | ||
| Middle East | Iran | |
| Saudi Arabia | ||
| Rest of Middle East | ||


Key Questions Answered in the Report
What is the projected value of the Middle East and Africa biofertilizers market by 2031?
The market is projected to reach USD 542.7 million by 2031, growing at 9.55% CAGR.
Which microorganism type currently leads adoption in the region?
Rhizobium products lead with 44.5% market share in 2025, mainly due to widespread legume cultivation and established efficacy.
Why are liquid biofertilizers gaining traction in GCC countries?
Greenhouse and controlled environment agriculture systems favor liquid formulations that integrate seamlessly with fertigation lines and deliver high CFU counts under precision dosing.
How do subsidy programs affect biofertilizer uptake?
Subsidies for synthetic fertilizers in markets such as Nigeria and Egypt depress biological adoption by maintaining lower mineral fertilizer prices, though rising fiscal pressure may open doors for biofertilizers.
What is the main restraint limiting adoption in sub-Saharan Africa?
Heavy government subsidies on synthetic urea and compound blends keep their prices far below market cost, discouraging biofertilizer trials among price-sensitive growers.
Page last updated on:


