Market Overview
| Study Period | 2021 - 2031 |
|---|---|
| Forecast Data Period | 2026 - 2031 |
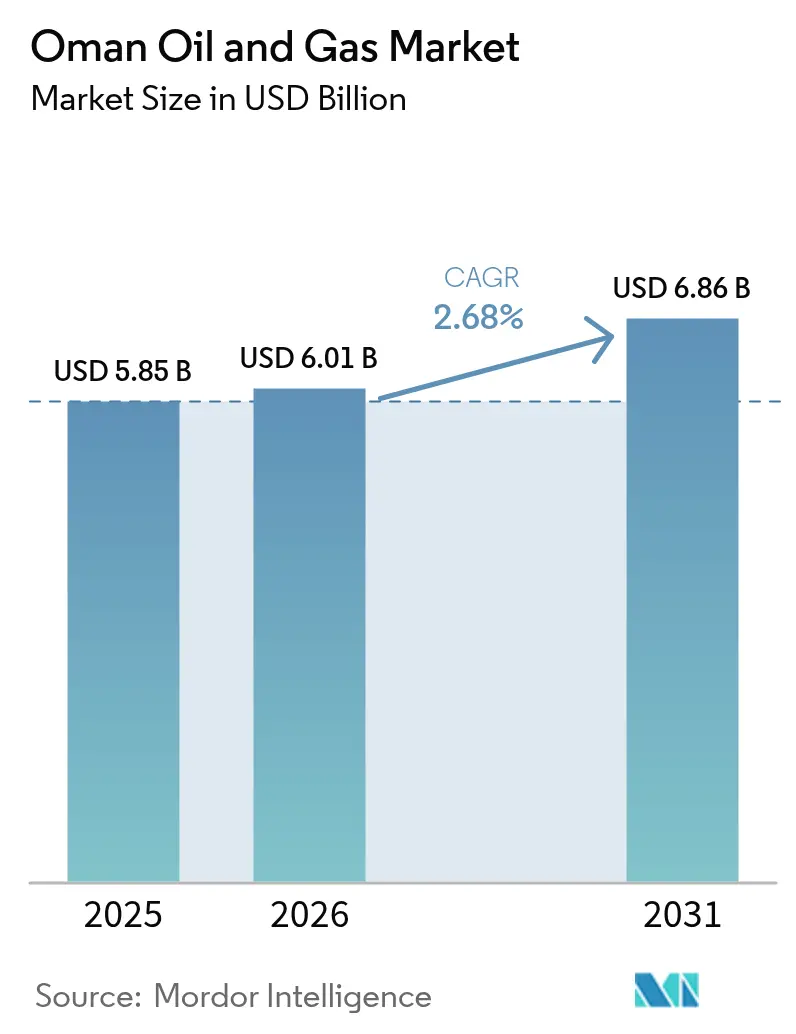
| Base Year Market Size (2025) | USD 5.85 Billion |
| Market Size (2026) | USD 6.01 Billion |
| Market Size (2031) | USD 6.86 Billion |
| Growth Rate (2026 - 2031) | 2.68% CAGR |
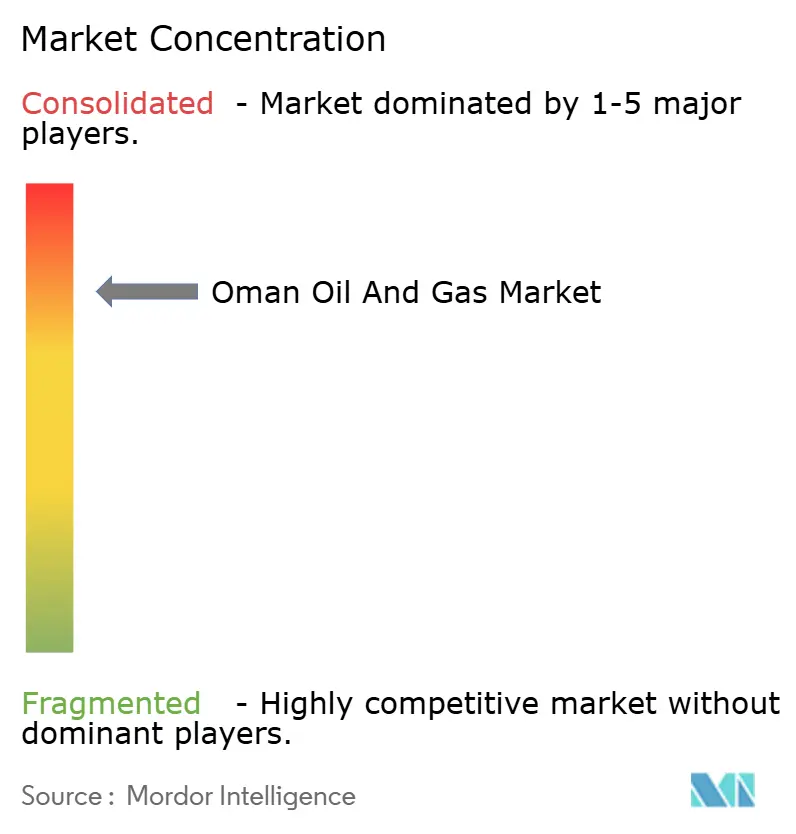
| Market Concentration | High |
Major Players*Disclaimer: Major Players sorted in no particular order Image © Mordor Intelligence. Reuse requires attribution under CC BY 4.0. | |
Oman Oil And Gas Market Analysis by Mordor Intelligence
The Oman Oil And Gas Market size is expected to grow from USD 5.85 billion in 2025 to USD 6.01 billion in 2026 and is forecast to reach USD 6.86 billion by 2031 at 2.68% CAGR over 2026-2031.
Production stability across mature onshore fields, tighter project economics for discoveries, and rising gas demand from power and petrochemicals underpin this measured trajectory. Enhanced Oil Recovery (EOR) programs and the Block 61 tight-gas expansion sustain upstream volumes, while downstream refinery debottlenecking and petrochemical integration add value to each exported barrel. International operators leverage liberalized Production Sharing Contracts (PSCs) to deploy advanced digital solutions that lift recovery factors and curb operating costs. At the same time, green-hydrogen investments exceeding USD 20 billion align the sector with Oman Vision 2040’s diversification goals without derailing near-term hydrocarbon revenue streams.
Key Report Takeaways
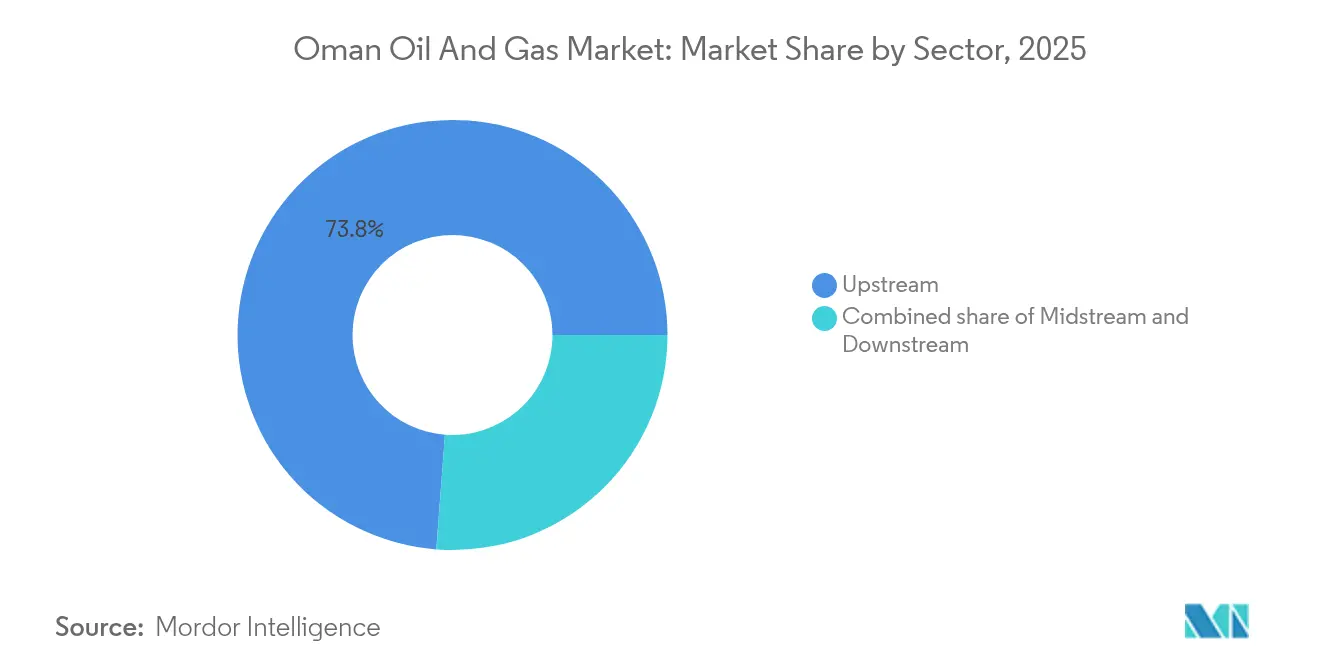
- By sector, upstream operations held 73.80% of the Oman oil and gas market share in 2025 and are projected to grow at a 2.78% CAGR through 2031.
- By location, onshore assets commanded 78.20% of the Oman oil and gas market share in 2025, while offshore developments are forecast to post the fastest growth rate of 5.32% from 2025 to 2031.
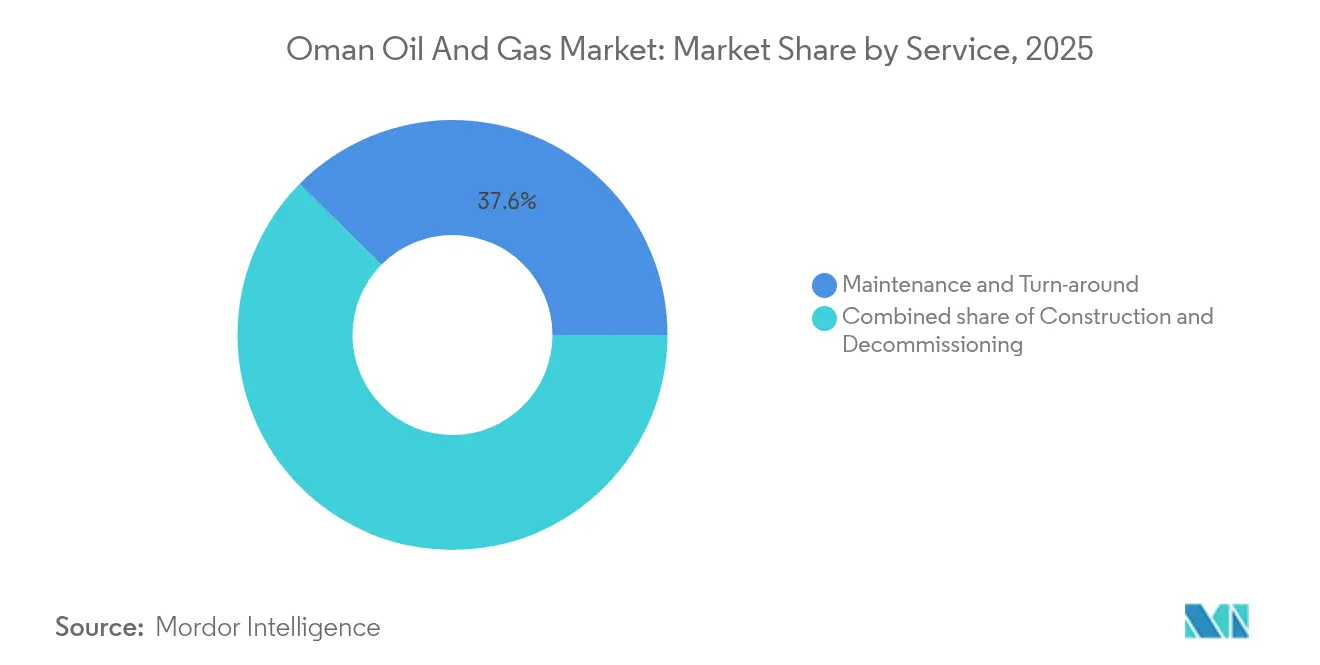
- By service, decommissioning represented 29.60% of the Oman oil and gas market size in 2025 and is expected to advance at a 5.88% CAGR to 2031.
Note: Market size and forecast figures in this report are generated using Mordor Intelligence’s proprietary estimation framework, updated with the latest available data and insights as of 2026.
Oman Oil And Gas Market Trends and Insights
Drivers Impact Analysis*
| Driver | (~) % Impact on CAGR Forecast | Geographic Relevance | Impact Timeline |
|---|---|---|---|
| Block 61 gas expansion & other tight-gas assets | +0.80% | National – Khazzan & Ghazeer fields | Medium term (2-4 years) |
| Liberalized PSC terms attracting foreign investment | +0.60% | National – frontier exploration blocks | Long term (≥ 4 years) |
| Rising domestic demand from power & petrochemicals | +0.40% | Muscat–Sohar industrial corridor | Short term (≤ 2 years) |
| Downstream capacity build-out (Duqm, Sohar) | +0.30% | Duqm SEZ and Sohar Port | Medium term (2-4 years) |
| Green-hydrogen & blue-ammonia pipeline | +0.20% | Duqm and Salalah export hubs | Long term (≥ 4 years) |
| Solar-steam EOR & AI-enabled field optimization | +0.20% | Amal and Marmul complexes | Short term (≤ 2 years) |
| Source: Mordor Intelligence | |||


Block 61 Gas Expansion Reshapes Supply Dynamics
Block 61 supplies 1.2 billion cubic feet per day (bcf/d) and targets 1.5 bcf/d by 2026, confirming the commercial development of tight gas in the Middle East. Phase 2 adds 500 million cubic feet per day, utilizing multi-stage hydraulic fracturing, and directly supports Oman LNG’s Train 4 project. Water-recycling systems limit freshwater intake, addressing concerns about scarcity in the desert interior. Success at Khazzan-Ghazeer has catalyzed analogous investment in Blocks 77 and 40, collectively assessed at more than 2 bcf/d potential. These volumes underpin domestic power supply and sustain LNG exports, shielding fiscal revenues against oil-price swings. The project’s digital twin platform has already reduced unplanned downtime by 10%, illustrating the technology’s role in enhancing the resilience of the Oman oil and gas market.
Production Sharing Contract Liberalization Accelerates Capital Inflow
The 2024 PSC overhaul reduced the government's take from 85% to 75% for discoveries and extended the cost-recovery period to 10 years. The auction of 15 blocks secured USD 1.2 billion in signature bonuses, leading to a 40% increase in exploration spending to USD 800 million. Streamlined environmental approvals now trim typical project lead times by 18 months. Operators welcome a clear local-content target of 35%, which nurtures domestic supply-chain capacity without stalling project schedules. The updated regime, therefore, attracts technology-intensive majors that can monetize frontier acreage and share digital expertise with national partners, thereby strengthening the competitive landscape of the Oman oil and gas market.
Domestic Power and Petrochemical Demand Sustains Gas Consumption
Natural gas fuels 94% of Oman’s electricity fleet, whose installed capacity is expected to reach 8.2 GW by 2025.(1)Oman Electricity Transmission Company, “Capacity Expansion Plan 2025,” oetc.om First-half 2025 gas use reached 27.58 billion m³, up 5.3% year-on-year as new combined-cycle turbines lifted efficiency by 15%. OQ Chemicals’ expanding methanol and ethylene units add stable baseload demand, while seasonal cooling needs boost summer gas burn by 20%. GCC grid interconnection enables surplus exports to the UAE during shoulder months, smoothing dispatch patterns. The firm’s offtake commitments anchor long-cycle gas projects, securing steady cash flows even during periods of weaker crude prices.
Downstream Capacity Build-Out Bolsters Regional Hub Status
Duqm Refinery reached 255,000 barrels per day (b/d) in 2025 after debottlenecking, while Sohar now processes 230,000 b/d, resulting in a combined throughput of 485,000 b/d.(2)OQ Group, “Duqm Refinery Performance Report,” oq.com Both complexes integrate with polypropylene and aromatics lines that earn premiums over crude exports. Deep-water access reduces freight costs by USD 2-3 per barrel for Asian customers, thereby widening margins. The Duqm Special Economic Zone further waives selected tariffs, attracting USD 15 billion in follow-on petrochemical and storage investments. These additions diversify revenue streams, helping the Oman oil and gas market navigate the headwinds of the energy transition.
Restraints Impact Analysis*
| Restraint | (~) % Impact on CAGR Forecast | Geographic Relevance | Impact Timeline |
|---|---|---|---|
| Oil-price volatility curbing CAPEX | -0.40% | National – all upstream assets | Short term (≤ 2 years) |
| Global energy-transition dampening oil demand | -0.30% | Global export markets | Long term (≥ 4 years) |
| Rising cost of recovery at mature fields | -0.20% | Central Oman | Medium term (2-4 years) |
| Water-scarcity risks for steam-based EOR | -0.10% | Amal and Marmul fields | Short term (≤ 2 years) |
| Source: Mordor Intelligence | |||
Oil-Price Volatility Clouds Capital Allocation
Brent’s 2024 range of USD 70-90/bbl complicates the sanctioning of EOR projects that require USD 45-50/bbl breakevens.(3)Petroleum Development Oman, “Annual Report 2024,” pdo.co.om Developers employ modular concepts to stagger funding and trim initial outlays by up to 40%. Hedging shields 40-60% of production but reduces returns by 2-3 percentage points. The treasury, therefore, prioritizes quick-payout gas schemes over heavier oil projects. Lower-cost digital monitoring mitigates some volatility, yet fluctuating prices remain the most immediate headwind for the Oman oil and gas market.
Energy-Transition Pressure Narrows Long-Term Oil Window
IEA scenarios place global peak oil demand between 2028 and 2030, thereby squeezing the investment runway for 15- to 20-year EOR assets.(4)International Energy Agency, “World Energy Outlook 2024,” iea.orgOman accelerates mature-field depletion and channels surplus cash toward blue-hydrogen, carbon-capture, and solar-EOR pilots. Alignment with Paris targets necessitates constant emissions audits and incremental CO₂ abatement. Downstream operators retrofit renewable feedstocks and circular-economy processes, extending asset life without violating future carbon budgets. This dual-track approach cushions the Oman oil and gas industry against a structurally lower-carbon future.
*Our forecasts treat driver/restraint impacts as directional, not additive. The impact forecasts reflect baseline growth, mix effects, and variable interactions.
Segment Analysis
By Sector: Upstream Dominance Anchors Cash Flow
Upstream activities accounted for 73.80% of Oman's oil and gas market share in 2025, generating the bulk of fiscal receipts that fund diversification programs. Polymer flooding and miscible-gas injection at Amal, Marmul, and Harweel lifted aggregate rates by 39,000 b/d, lengthening field life by about a decade. Midstream pipelines, at 18.40% share, trail upstream in revenue but enjoy stable tariffs linked to take-or-pay agreements. Targeted investments strengthen feedstock security for polypropylene and polyethylene facilities serving GCC manufacturers, thereby embedding greater domestic value addition along the twin 42-inch pipelines that channel Block 61 output to coastal LNG and petrochemical hubs, while reducing transport costs by approximately USD 1.50 per barrel.
Downstream assets capture just 7.80% of the Oman oil and gas market size today, yet the segment's integrated business model earns higher margins per barrel than crude exports. Duqm's complex now runs 11% above nameplate, validating process-control upgrades and workforce skill transfer. Continuous emissions monitoring and flare-gas recovery meet Oman Environmental Authority thresholds without impeding throughput. The build-out also enhances feedstock security for polypropylene and polyethylene plants that supply GCC manufacturers, thereby embedding domestic value addition within the broader Oman oil and gas market.


By Location: Offshore Growth Rebalances Portfolio
Onshore basins accounted for 78.20% of Oman's oil and gas market share in 2025, utilizing 4,200 km of pipelines and 850 gathering stations to achieve sub-USD 35/bbl breakevens. Digital twin rollouts across 200 wells have pushed average uptime above 95%, while drone-enabled inspections have reduced lifting costs by USD 3-4/bbl. Yet production from maturing reservoirs inches lower, prompting operators to test solar-generated steam that cuts gas consumption by 80%.
Offshore projects, although accounting for only 21.80% of current revenue, are projected to capture the highest 5.32% CAGR through 2031 within the broader Oman oil and gas market size. Three new platforms, Bukha, West Bukha, and Yumna, unlock deeper reservoirs at a water depth of 200 meters. Subsea boosting and compact processing reduce topside footprints, thereby curbing installation costs. Regulatory oversight by the Oman Maritime Authority ensures compliance with IMO-aligned safety codes, thereby mitigating investor perception risks. Over the forecast horizon, offshore gains diversify asset exposure and smooth the country's production profile.
By Service: Decommissioning Takes Center Stage
Maintenance and turnaround captured 37.60% of the Oman oil and gas market size in 2025, reflecting aging infrastructure that requires 45- to 60-day shutdowns every four to five years. Specialized contractors mobilize up to 3,000 technicians for each Sohar or Duqm campaign, while predictive analytics condense outage duration by roughly one week. Construction services, with a 32.80% share, continue to rise on the back of new midstream links and compressor upgrades, although fewer mega-projects are expected beyond 2027.
Decommissioning accounts for 29.60% of revenue but posts an unrivaled 5.88% CAGR through 2031, reflecting stringent rules for well plugging and site remediation. More than 150 injection wells need reclassification by 2026, creating a steady workflow for robotics-enabled cutting, cleaning, and recycling units that recover up to 90% of structural steel. The segment thus morphs from a compliance cost into a growth niche that attracts engineering firms equipped for circular-economy execution.
Geography Analysis
Oman's hydrocarbons lie mainly in the interior Fahud-Natih-Al Huwaisah triangle, an area that has yielded over 7 billion barrels since the 1960s. These mature onshore fields currently supply 75% of the national output; however, rising water cuts and higher lift costs are prompting the wider adoption of polymer and solar-steam EOR to maintain production above 800,000 b/d. The centrality of existing gathering lines keeps operating expenditures competitive, even as incremental recovery challenges multiply.
Coastal governorates from Muscat to Sohar host 85% of the petrochemical capacity and 60% of the gas processing infrastructure. Pipeline tie-ins to the interior ensure real-time gas allocation between LNG liquefaction, power generation, and methanol trains. Deep-draft ports enable the loading of Very Large Crude Carriers (VLCCs), making Duqm a cost-efficient springboard for Asian deliveries. Proximity to sea lanes shortens voyages to India and China by up to 800 nautical miles versus Persian Gulf ports, a distinct freight advantage that reinforces the Oman oil and gas market's export competitiveness.
Southern Dhofar Governorate hosts the 6.7 million-tpa Salalah LNG complex and emerging green-hydrogen clusters. Synergy between gas feedstock, desalinated water, and high solar irradiance attracts proposals for blue ammonia and green methanol, targeting Japanese and Korean buyers. Cross-border grid links with Saudi Arabia stabilize power supply during summer peaks, reflecting a broader GCC push toward shared infrastructure. As interior reservoirs mature and offshore output scales up, supply chains will continue to pivot toward the coast, cementing Oman's role as a hybrid hydrocarbons-and-renewables export platform within the broader Oman oil and gas market.
Regulatory Landscape
Oman’s oil and gas sector is governed by the Oil and Gas Law (Royal Decree 8/2011). Upstream rights are granted through exploration and production sharing agreements (EPSAs) that require a Sultani (Royal) Decree to take effect. The Ministry of Energy and Minerals (MEM), established under Royal Decree 96/2020, is the primary regulator overseeing hydrocarbons, with responsibility also extending to renewable energy and hydrogen. This consolidates policy direction for conventional production, gas development, and energy-transition initiatives under one portfolio.
In 2026, Oman continued to formalize concession activity through Sultani Decrees that approve petroleum agreements and amendments, reinforcing the decree-driven basis for license entry and changes. Royal Decree 37/2026 approved a concession agreement for Block 18 involving OQ Exploration and Production Batinah Offshore LLC. Royal Decree 25/2026 approved Agreement No. 1 attached to the petroleum agreement for Block 5 involving Mazoon Petrogas (BVI) Limited and Mazoon Petroleum and Gas SAOC. Together, these updates strengthen regulatory certainty for upstream participation and project execution timelines.
Competitive Landscape
The market is moderately concentrated: Petroleum Development Oman accounts for roughly 70% of crude output, while BP, Shell, TotalEnergies, and Occidental dominate gas, EOR, and digital initiatives. A technology investment of USD 2-3 billion per year is targeting artificial intelligence, blockchain logistics, and autonomous inspection fleets, collectively increasing field efficiency by 12-15%. Government policy mandates 35% local content, spurring joint ventures that transfer know-how to Omani suppliers.
White-space plays emerge in tight-gas delineation, offshore deepwater, and carbon capture usage. Equinor and ExxonMobil acquired new exploration acreage in 2024, underscoring renewed appetite for frontier prospects under the friendlier PSC regime. Independent power producers likewise enter the gas-to-power chain, contracting long-term offtake that stabilizes revenues.
Digital differentiation grows sharper: operators deploy digital twins across complex facilities, shrinking unscheduled downtime, and remote-sensing drones that cut pipeline inspection costs by 40-50%. OQ aligns upstream profits with downstream expansion and renewable spin-offs, minimizing earnings volatility. Collectively, these strategies underscore a balanced race where scale, technology, and local partnerships determine standing in the Oman oil and gas market.
Oman Oil And Gas Industry Leaders
BP Plc
Eni SpA
China National Petroleum Corporation
Shell PLC
Oman Oil Marketing Company SAOG
- *Disclaimer: Major Players sorted in no particular order

Market Opportunities and Future Outlook
Upstream licensing and portfolio turnover support demand for exploration and appraisal services, subsurface studies, and early-phase field development work. In April 2026, the Ministry of Energy and Minerals launched the 2026 Oman Licensing Round, offering five onshore blocks (12, 16, 45, 42, 55) totaling about 48,000 square kilometers. This expands the addressable pipeline for seismic, drilling, well services, and local-content aligned supply chains. Offshore participation also broadened through a June 2026 concession agreement for offshore Block 80, signed with OQ Exploration and Production and Turkish Petroleum Overseas Company.
Midstream and gas-processing investment opportunities are tied to domestic gas optimization and liquids recovery. In February 2026, OQ Group issued a FEED tender for the Saih Nihayda natural gas liquids extraction facility, designed to process up to 48 million cubic metres of natural gas per day, which expands scope for EPC, rotating equipment, process controls, and debottlenecking solutions. Decarbonization-linked opportunities are being operationalized through named programs as well: in July 2026, Nama Power and Water Procurement Company issued an RFQ for a technical consultant for a 4 GW utility-scale solar PV program (including the 1 GW Adam Solar IPP project). In parallel, the MEM’s May 2026 net-zero roadmap and carbon-market framework supports demand for CCUS, electrification, and emissions measurement capabilities that can be applied within oil and gas assets and adjacent industrial hubs.
Recent Industry Developments
- July 2026: Oman Oil Marketing Company secured a government fuel supply contract with a multi-year term, effective from July 1, 2026 through June 30, 2031. The award improves downstream volume visibility and supports planning for depot, logistics, and retail network utilization.
- May 2026: Oman Oil Marketing Company signed a memorandum of understanding with OQ Basic Industries to collaborate on clean energy solutions, including solar energy and electric vehicle charging infrastructure. The collaboration expands the company’s positioning beyond conventional fuels toward infrastructure-linked energy services that connect mobility demand with Oman’s broader decarbonization agenda.
- October 2024: Petroleum Development Oman launched a USD 600 million carbon capture and storage pilot project at the Harweel field targeting 500,000 tonnes per year of CO2 sequestration capacity. The project incorporates CCUS into upstream operating models and increases demand for subsurface storage appraisal, compression, monitoring, and long-term integrity services.


Research Methodology Framework and Report Scope
Market Definition and Coverage
For this study, the Oman oil and gas market is defined as the value generated from oil and gas activities in the Sultanate of Oman, covering upstream production, midstream handling and transport, and downstream processing that supports domestic supply and exports.
Scope exclusions: We exclude purely financial trading of crude and refined products, and we also exclude power generation and utilities revenue that sits outside oil and gas operations.
Segmentation Overview
- By Sector
- Upstream
- Midstream
- Downstream
- By Location
- Onshore
- Offshore
- By Service
- Construction
- Maintenance and Turn-around
- Decommissioning
Data Sources, Market Sizing, and Validation
Desk Research
Desk work starts with building a clean fact base on Oman production, reserves, exports, and project timelines, which then gets tied back to value generation across the chain. Public sources were used as anchors, such as the Ministry of Energy and Minerals (Oman), National Centre for Statistics and Information, OPEC and the IEA, and EIA country data for cross-checking oil and gas balances.
We also reviewed annual reports and investor presentations, project disclosures, and reputed press to validate commissioning dates, shutdowns, and major capacity adds. Where needed, paid subscriptions for company financials and news screening, and a shipment-level import export database were used to verify activity signals like equipment flows and export movements. These examples are not exhaustive, and many other public sources were also used for collection, validation, and clarification.
Primary Interviews and Surveys
Primary work was used to pressure-test the desk assumptions on what drives revenue in Oman, especially pricing pass-through, service intensity, and the timing of field and plant work. We spoke with a mix of operators, EPC and maintenance providers, logistics and midstream participants, and downstream stakeholders, and then aligned inputs across APAC, EMEA, and the Americas to capture different views on costs, schedules, and expected utilization.
Distribution of primary research fieldwork respondents
| Company type | Respondent position | Region |
|---|---|---|
| Top tier: 33% | CXOs: 16% | |
| Mid tier: 51% | Functional/Unit leaders: 38% | |
| Smaller Players: 16% | Managers: 46% |
Market-Sizing & Forecasting
Sizing starts with a top-down build where Oman production and processing activity is reconstructed from public oil and gas balances, and then translated into value using observed price bands and service intensity for key activities. Results are then checked through selective bottom-up approximations, such as sampled revenue run-rates from disclosed financials, channel checks on typical contract pricing, and volume times average realized price logic where suitable.
Key inputs that shape the model include crude and gas output trends, export volumes and destination mix, refinery throughput and utilization, drilling and well intervention cadence, and the share of volumes produced under enhanced oil recovery programs. Project start-up timing and maintenance turn-around cycles are treated carefully because they can create step changes that look like trend breaks if they are not separated.
For forecasting, scenario analysis is used to reflect how changes in output targets, gas demand pull from industry, and commissioning delays can move the market within a reasonable range. When a data series is missing, we fill gaps by using adjacent indicators like field production proxies or capacity utilization ranges from interviews, and then we revisit the assumption during validation.
Data Validation & Update Cycle
Model outputs are checked against independent signals, including Oman production totals, export movement patterns, and refinery throughput, so major mismatches are caught early. Variance checks are done at each step, and outliers are reviewed to confirm whether they are real events such as turn-arounds, new capacity, or temporary shutdowns.
Before sign-off, the work goes through multi-step analyst reviews, and follow-up calls are triggered when a key assumption moves or when new public announcements change the supply or demand outlook. Reports are refreshed annually, and interim updates are made when material events occur, followed by a final pre-delivery review so clients receive the latest updated view.
Mordor Intelligence's Oman Oil and Gas Market Sizing Compared With Other Published Estimates
Published market numbers for Oman oil and gas can look different even when the topic name sounds similar, because each publisher draws the line between operational revenue, capex, and commodity value in its own way. Differences also come from the year chosen as the base, the price deck used for oil and gas, and whether project timing is treated as a smooth trend or as step changes.
In our checks, the biggest gap drivers were whether downstream value is counted as throughput-based operational revenue versus being approximated through broader sector contribution, and whether midstream activity includes LNG processing and storage as a separate value pool. Some estimates also mix longer forecast horizons with more aggressive growth, and they may not re-check assumptions when new field plans or refinery utilization guidance shifts.
Benchmark comparison
| Source | Market Size | Gaps in Research Methodology |
|---|---|---|
| Mordor Intelligence | USD 5.85 B (2025) | |
| Industry Research Firm A | USD 4.36 B (2024) | Uses a 2024 starting point and appears to apply a tighter revenue pool, which can undercount midstream and downstream operational value when price pass-through and service intensity are not expanded. |
| Industry Publisher B | USD 1.89 B (2026) | Anchors the series on 2026 and a longer horizon, and the lower near-term number suggests a narrower definition that likely emphasizes selected upstream and infrastructure spend rather than the full oil and gas value chain. |
The spread mainly comes from scope and timing choices, not just math, and the cleanest way to interpret it is to compare like-for-like value pools by year. When upstream, midstream, and downstream are kept inside one consistent operational revenue frame, and project step changes are applied only when commissioning is evidenced, the 2025 total stays traceable to Oman activity signals, a modeling choice applied by Mordor Intelligence.


Key Questions Answered in the Report
How large is the Oman oil and gas market in 2026?
The Oman oil and gas market size is valued at USD 6.01 billion for 2026 and is projected to grow toward USD 6.86 billion by 2031.
What is the expected growth rate for Oman’s upstream segment?
Upstream activities are projected to expand at a 2.78% CAGR between 2026 and 2031, underpinned by tight-gas developments and EOR programs.
Which service segment is growing the fastest in Oman?
Decommissioning services post the highest 5.88% CAGR through 2031 as stricter regulations drive well-plugging and site remediation demand.
How much gas will Block 61 produce after Phase 3?
Phase 3 lifts Block 61 capacity to roughly 1.5 billion cubic feet per day, supporting both domestic power generation and LNG exports.
What role do refineries play in Oman’s diversification strategy?
The 485,000 b/d combined capacity at Duqm and Sohar enables higher-margin petrochemical exports and anchors the country’s regional processing hub ambitions.
Page last updated on:


