Continuous Positive Airway Pressure (CPAP) Devices Market Size and Share
Market Overview
| Study Period | 2020 - 2031 |
|---|---|
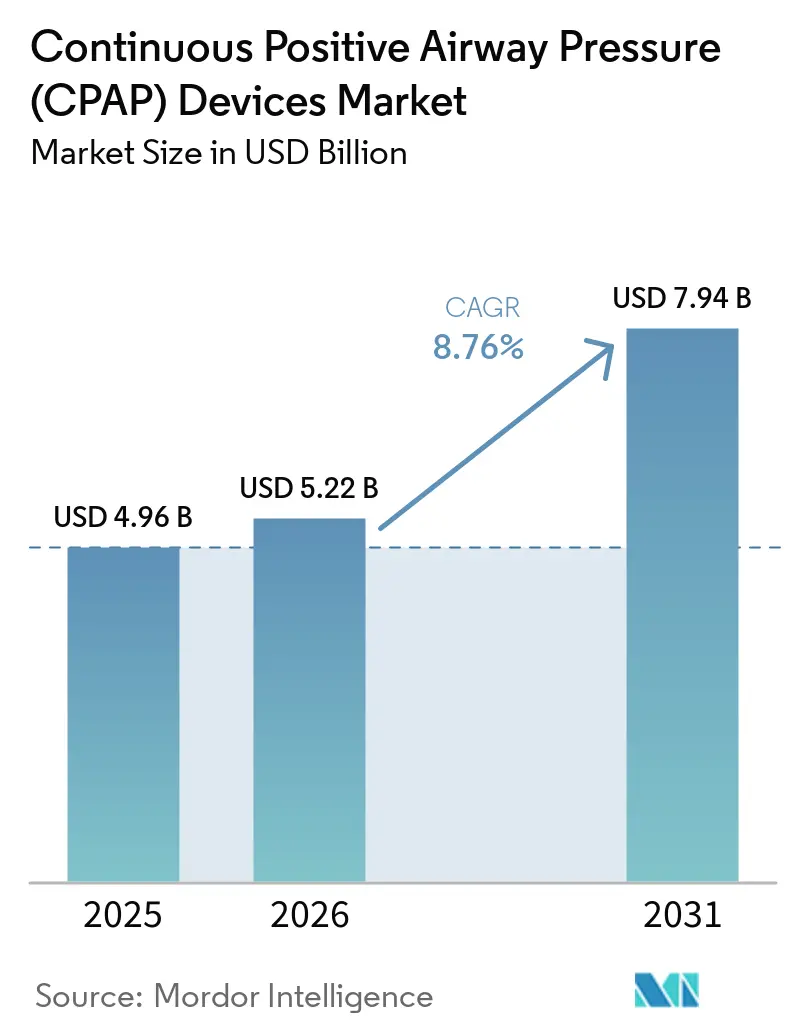
| Market Size (2026) | USD 5.22 Billion |
| Market Size (2031) | USD 7.94 Billion |
| Growth Rate (2026 - 2031) | 8.76% CAGR |
| Fastest Growing Market | Asia Pacific |
| Largest Market | North America |
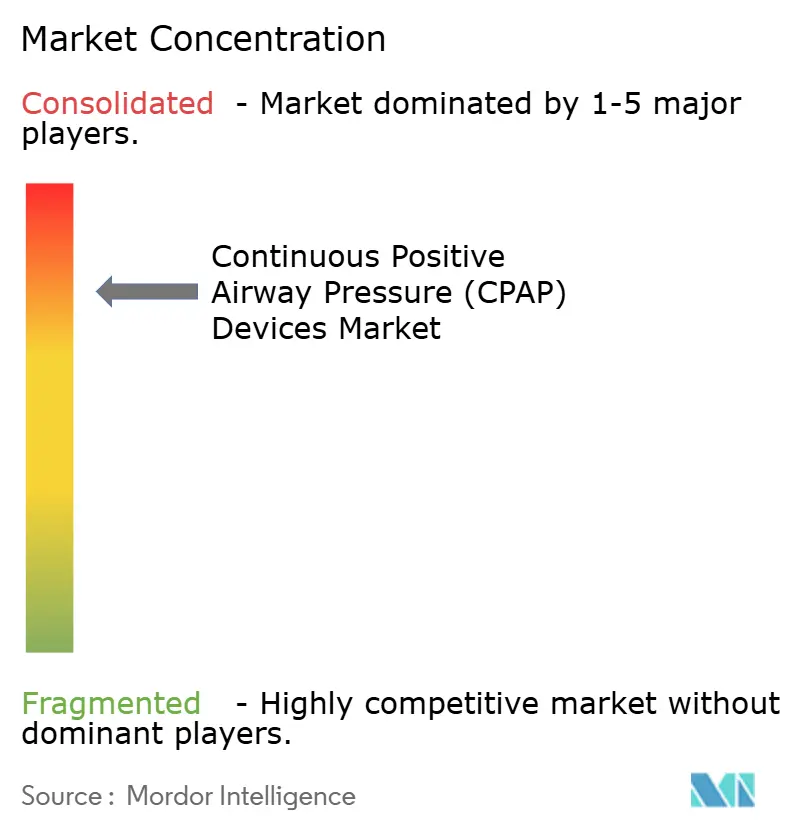
| Market Concentration | High |
Major Players *Disclaimer: Major Players sorted in no particular order Image © Mordor Intelligence. Reuse requires attribution under CC BY 4.0. | |
Continuous Positive Airway Pressure (CPAP) Devices Market Analysis by Mordor Intelligence
The Continuous Positive Airway Pressure Devices Market size is expected to increase from USD 4.96 billion in 2025 to USD 5.22 billion in 2026 and reach USD 7.94 billion by 2031, growing at a CAGR of 8.76% over 2026-2031.
Expansion stems from reimbursement reforms that move sleep-apnea management into the home, replacement demand triggered by large-scale product recalls, and rising obesity prevalence that lifts the global pool of obstructive sleep-apnea patients to more than 936 million. Tighter quality-control rules now shape product pipelines, while ultra-quiet micro-blowers and AI-enabled adherence platforms differentiate offerings and attract payer contracts. Manufacturers increasingly steer customers toward consumable accessories, creating predictable revenue flows that shield margins from hardware replacement cycles. Online direct-to-consumer channels, which feature subscription mask-replacement plans and flexible-spending-account payments, are quickening device adoption and altering traditional distribution economics.
Key Report Takeaways
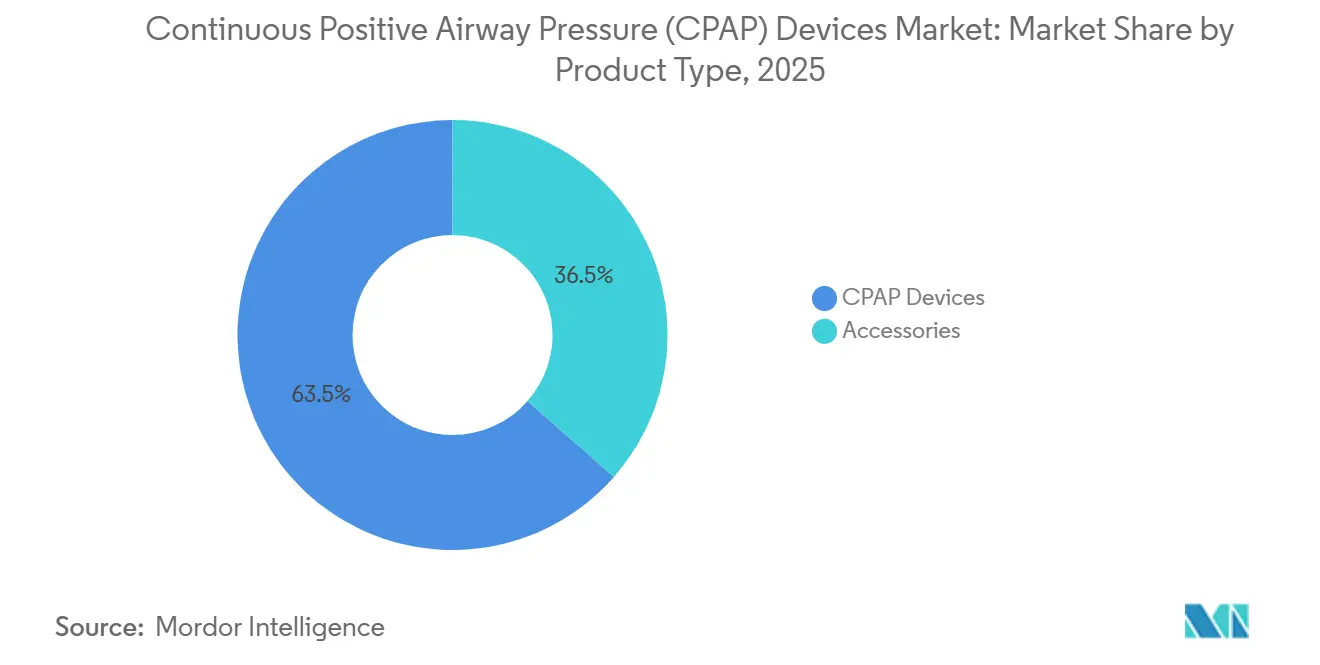
- By product type, CPAP devices led with 63.52% revenue share in 2025; accessories are projected to expand at an 11.46% CAGR through 2031.
- By interface, nasal masks held 44.26% of 2025 revenue, while nasal-pillow masks are set to grow at 10.57% CAGR to 2031.
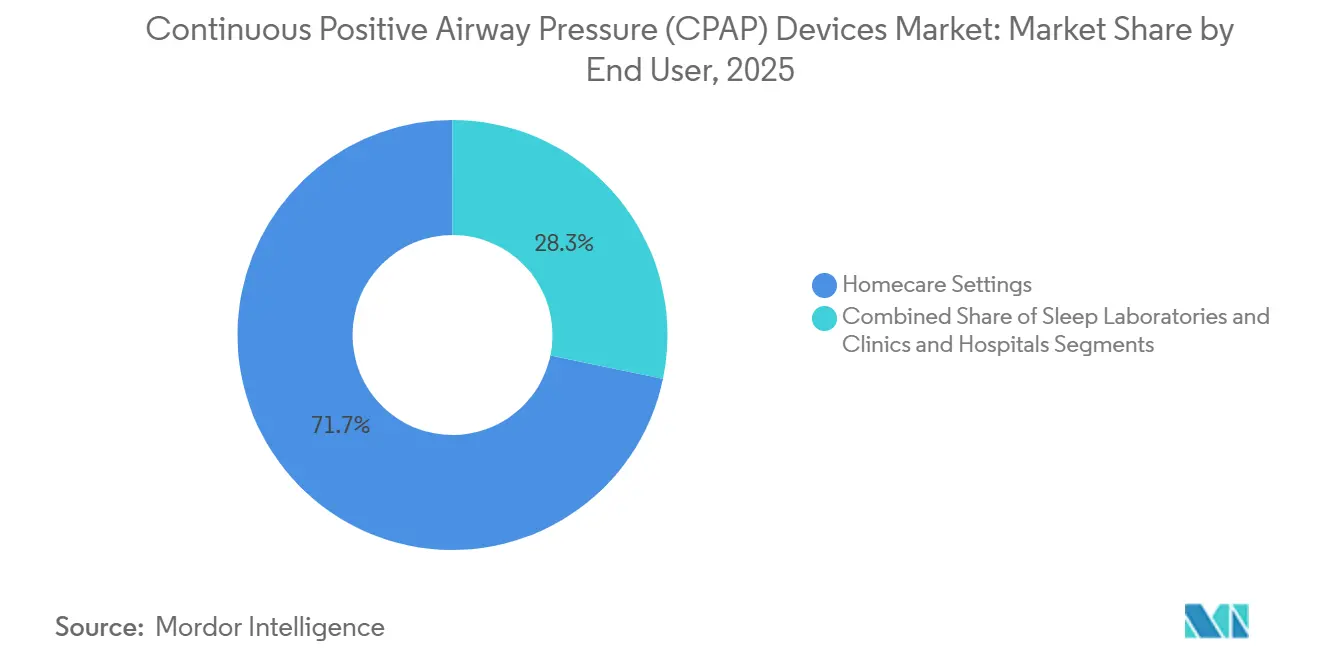
- By end-user, homecare accounted for 71.73% of 2025 demand, whereas hospitals are forecast to post a 10.78% CAGR through 2031.
- By distribution channel, offline outlets captured 58.22% of 2025 sales; online platforms are advancing at 12.56% CAGR to 2031.
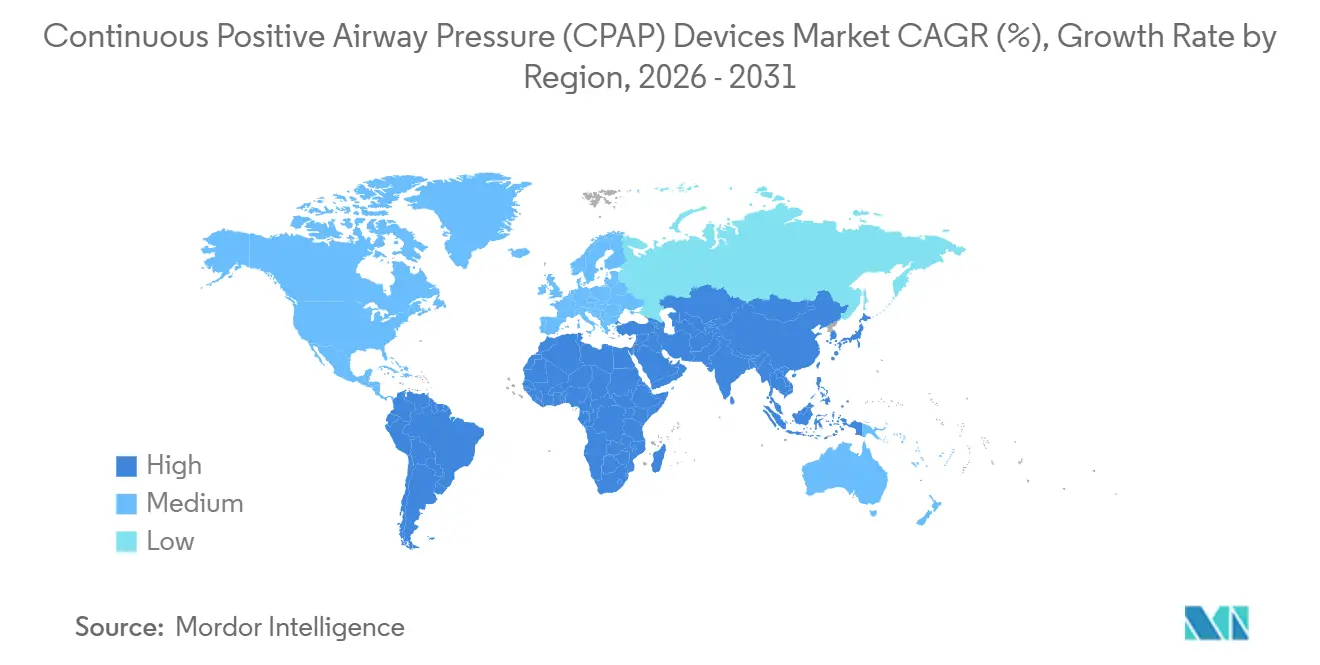
- By geography, North America held 34.54% revenue share in 2025; Asia-Pacific is the fastest-rising region with a 10.36% CAGR forecast to 2031.
Note: Market size and forecast figures in this report are generated using Mordor Intelligence’s proprietary estimation framework, updated with the latest available data and insights as of January 2026.
Global Continuous Positive Airway Pressure (CPAP) Devices Market Trends and Insights
Drivers Impact Analysis*
| Driver | (~) % Impact on CAGR Forecast | Geographic Relevance | Impact Timeline |
|---|---|---|---|
| Reimbursement shift toward home-based therapy | +1.8% | North America, Western Europe, Australia | Medium term (2-4 years) |
| Rising prevalence of obesity-linked OSA | +2.1% | Global, highest in North America, Middle East, Pacific | Long term (≥ 4 years) |
| Post-COVID tele-sleep programs | +1.3% | North America, Europe, urban Asia-Pacific hubs | Short term (≤ 2 years) |
| Ultra-quiet micro-blowers for travel CPAPs | +0.9% | Global, early in North America and Western Europe | Medium term (2-4 years) |
| AI-driven adherence analytics | +1.5% | North America, Europe, Australia, urban Asia | Medium term (2-4 years) |
| Retail and tech-led home-sleep-testing kits | +1.2% | North America, Western Europe, Latin America, SE Asia | Short term (≤ 2 years) |
| Source: Mordor Intelligence | |||
Reimbursement Shift Toward Home-Based Sleep Apnea Treatment
Payer policies now direct funding away from overnight polysomnography toward in-home titration, cutting per-patient diagnostic costs by up to 60% while expanding access in underserved areas. In 2024 Medicare dropped prior-authorization hurdles for auto-titrating units, a move quickly mirrored by large private insurers. The streamlined path from suspicion to prescription accelerates device uptake but compresses margins for suppliers competing under Medicare’s revived competitive-bidding framework. The Veterans Health Administration proved the model at scale by enrolling more than 20,000 beneficiaries into a tele-sleep program that pairs remote titration with real-time monitoring.[1]U.S. Department of Veterans Affairs Telehealth Office, “Tele-Sleep Program Expansion,” Department of Veterans Affairs, va.gov Together, these policies have reshaped demand toward portable devices configured for at-home initiation.
Rising Prevalence of Obesity-Linked Obstructive Sleep Apnea
Global obesity rates continue to climb; the World Health Organization now estimates more than 936 million adults meet clinical thresholds for OSA, up 15% since 2019. In the United States, 42.4% of adults were classified as obese in 2024, creating a direct link between body-mass index and apnea severity.[2]Centers for Disease Control and Prevention Epidemiology Team, “Adult Obesity Facts 2024,” Centers for Disease Control and Prevention, cdc.gov Gulf Cooperation Council states report obesity prevalence above 35%, compounding regional sleep-apnea incidence. Despite rising diagnoses, fewer than 20% of patients in most markets receive therapy, leaving a sizeable treatment gap manufacturers target through consumer advertising and weight-management partnerships.[3]American Academy of Sleep Medicine Research Committee, “CPAP Therapy Adherence Trends 2025,” American Academy of Sleep Medicine, aasm.org Pharmacological weight-loss therapies will eventually taper device reliance, yet current prescription trends indicate sustained CPAP demand over the medium term across the broader positive air pressure device market.
Post-COVID Tele-Sleep Programs Accelerating CPAP Adoption
Telehealth consultations for sleep disorders surged from 5% of visits in 2019 to more than 40% in 2024, and many pandemic-era waivers that permitted cross-state practice are now permanent. The Veterans Health Administration’s virtual titration pathway achieves a 68% 90-day adherence rate, matching in-clinic results. CVS Health’s HealthHUB format embeds screening kiosks and same-day home-test kit pickup, cutting the diagnosis-to-therapy timeline from weeks to days. This combination of remote diagnostics and retail distribution especially benefits rural regions that lack sleep-lab density. Faster patient throughput lifts unit volumes and shifts payer focus toward documented adherence.
Introduction of Ultra-Quiet Micro-Blowers Enabling Travel-Size CPAPs
Miniaturized blowers have created a travel segment defined by devices that weigh less than 0.5 pounds and emit under 30 decibels. Somnetics International’s Transcend Micro, launched in 2024, retails for USD 779–928 and fits inside a carry-on toiletries pouch. Lightweight units appeal to business travelers and younger users seeking portability, expanding the addressable base beyond traditional bedside systems. ResMed’s earlier AirMini validated demand, but newer entrants press on price while preserving core therapeutic performance. Travel devices generate incremental sales to existing users and mitigate lapses in treatment when patients are away from home, contributing to innovation across the positive air pressure devices market.
Restraints Impact Analysis*
| Restraint | (~) % Impact on CAGR Forecast | Geographic Relevance | Impact Timeline |
|---|---|---|---|
| Frequent device recalls and supply-chain disruptions | −1.4% | Global, acute in North America and Europe | Short term (≤ 2 years) |
| Patient non-adherence stemming from mask discomfort | −1.7% | Global | Long term (≥ 4 years) |
| Surgical and oral alternatives siphoning CPAP patients | −0.8% | North America, Western Europe, Australia | Medium term (2-4 years) |
| Medicare DMEPOS competitive-bidding pressure | −1.1% | United States, with spillover to Canada and Australia | Short term (≤ 2 years) |
| Source: Mordor Intelligence | |||
Frequent Device Recalls and Supply-Chain Disruptions
The Philips DreamStation recall withdrew more than 15 million units between 2021 and 2024 because of degrading sound-abatement foam. Philips agreed to a USD 1.1 billion settlement in April 2024 and now operates under a consent decree that mandates independent oversight, slowing new product launches. The episode highlighted vulnerabilities in component sourcing and spurred competitors to audit supply chains. Semiconductor shortages and elevated freight costs compounded the disruption, squeezing mid-tier manufacturers lacking vertical integration. Heightened regulatory scrutiny raises compliance costs industry-wide and lengthens development timelines.
Patient Non-Adherence Due to Mask Discomfort and Claustrophobia
Thirty to fifty percent of patients discontinue therapy within 12 months, citing issues such as leaks, skin irritation, and claustrophobia. Nasal-pillow masks grow at 10.57% per year yet remain unsuitable for mouth breathers or high-pressure regimes. Fisher & Paykel’s Vitera mask introduces a RollFit seal that adapts to facial contours, and ResMed’s AirFit F30i routes the hose over the head to aid side sleepers. Despite these advances, psychological barriers persist, curbing lifetime accessory revenue and limiting payer return on diagnostic investment.
*Our forecasts treat driver/restraint impacts as directional, not additive. The impact forecasts reflect baseline growth, mix effects, and variable interactions.
Segment Analysis
By Product Type: Accessories Sustain Recurring Revenue
The accessories segment generated 36.48% of 2025 revenue and is expanding at 11.46% CAGR, well above the 8.76% growth for devices. Filters, tubing, and masks require regular replacement, creating subscription-like cash flows that soften cyclicality in hardware demand. Auto-titrating units are gaining favor for their comfort advantages, while bilevel machines remain niche due to higher prices. Compliance with ISO 80601-2-70 standards and stricter FDA review processes elevate entry barriers for newcomers.
CPAP devices market share leadership in devices remains intact, yet manufacturers increasingly subsidize hardware to secure downstream accessory sales. The CPAP devices market size for accessories is projected to add USD 1.2 billion during the forecast, lifting gross-margin profiles across the value chain.


By Interface: Nasal Pillow Masks Lead Growth on Comfort
Nasal masks retained 44.26% interface revenue in 2025, but nasal-pillow masks are projected to capture the highest share of incremental sales, expanding at 10.57% CAGR. Lightweight construction and reduced facial coverage ease claustrophobia and improve adherence. Full-face masks remain essential for mouth breathers yet face leakage challenges that spur design innovation.
Improved comfort is key to reducing abandonment. As patients shift toward smaller interfaces, the CPAP devices market expects substitution rather than absolute growth, yet premium pricing and rapid replacement cycles buoy revenue. The CPAP devices industry is likely to witness intensified competition among interface suppliers seeking differentiation through fit and noise reduction.
By End-User: Hospitals Emerge as a Growth Frontier
Homecare still dominates with 71.73% of 2025 demand, reflecting payer preference for outpatient therapy. Hospitals, however, are set to grow 10.78% annually as CPAP therapy gains traction for post-operative care, acute-respiratory support, and COVID-19 recovery pathways.
Hospital adoption raises average selling prices because facilities favor auto-titrating and humidification-enabled models that meet stricter infection-control standards. The CPAP devices market size generated by hospitals is forecast to climb sharply, shifting competitive focus toward clinical-grade performance and integration with electronic health-record systems.

By Distribution Channel: Online Platforms Disrupt Durable Medical Equipment Stores
Offline outlets retained 58.22% of 2025 revenue, yet online platforms are on a steeper 12.56% growth curve. Transparent pricing, subscription refills, and rapid order fulfillment appeal to cash-pay and high-deductible patients. Amazon hosts hundreds of listings, and manufacturer-run e-shops capture loyalty data to personalize offers.
Despite faster growth online, brick-and-mortar stores still provide vital mask-fitting and insurance-billing support. Hybrid models like CVS Health’s HealthHUB combine both, preserving service quality while leveraging e-commerce efficiency. The CPAP devices market share held by online channels is projected to surpass 45% by 2031 if reimbursement parity continues.
Geography Analysis
North America generated 34.54% of 2025 revenue, underpinned by Medicare coverage expansion, a robust durable-medical-equipment network, and the Veterans Health Administration’s tele-sleep enrollment of more than 20,000 patients. The Philips recall shook regional confidence but simultaneously opened share for ResMed and Fisher & Paykel. Competitive bidding, however, is squeezing smaller distributors and slowing unit growth. The US continuous positive airway pressure CPAP devices market continues to account for the largest share of regional demand.
Europe ranks second, with Germany, France, and the United Kingdom leading demand amid universal health-care coverage and strict quality standards. Germany reimburses devices with minimal co-pay, while France updated guidelines in 2024 to prioritize auto-titration. Southern European nations lag on treatment penetration but are investing in sleep-medicine infrastructure to close the gap.
Asia-Pacific is the growth engine, forecast at 10.36% CAGR. South Korea’s national insurance expansion aims for 1.5 million treated users by 2030. Chinese firms supply sub-USD 300 units domestically and abroad, but quality concerns limit penetration in premium segments. India’s urban centers are adopting tele-sleep diagnostics, while Australia shows steady replacement demand among an aging yet mobile population.

Competitive Landscape
The Continuous Positive Airway Pressure (CPAP) Devices market is highly concentrated. ResMed’s AirSense 11 integrates cellular connectivity and AI-powered coaching, features now mandatory in many payer contracts. Fisher & Paykel advances mask design with the Vitera RollFit seal and expands device sales through bundled humidification.
Somnetics International capitalizes on the travel segment with a 0.48-pound Transcend Micro that targets frequent flyers. Inspire Medical Systems secured broader Medicare coverage for hypoglossal-nerve stimulation, offering a surgical route for CPAP-intolerant patients. Chinese entrants undercut on price but lack the cloud-connectivity ecosystems favored by developed-market payers.
Competition increasingly centers on ecosystem depth rather than hardware alone. Accessory lineups, adherence analytics, and retail partnerships differentiate suppliers. Heightened regulatory oversight, especially the Philips consent decree, raises compliance costs and favors companies with sophisticated quality-management systems.
Continuous Positive Airway Pressure (CPAP) Devices Industry Leaders
ResMed Inc.
Koninklijke Philips N.V.
Fisher & Paykel Healthcare Ltd.
Drive DeVilbiss Healthcare
Apex Medical Corp.
- *Disclaimer: Major Players sorted in no particular order

Recent Industry Developments
- January 2026: Inogen launched Aurora CPAP masks, extending its respiratory-care lineup to serve obstructive sleep-apnea patients.
- December 2025: ResMed secured FDA clearance for Smart Comfort, the first AI-enabled device that recommends individualized settings to boost CPAP adherence.
- December 2025: SleepRes received FDA 510(k) clearance for the Kricket PAP device powered by Kairos Positive Airway Pressure.
- August 2025: FDA approved the Genio system for treating moderate to severe obstructive sleep apnea with an apnea-hypopnea index of 15–65.


Research Methodology Framework and Report Scope
Market Definitions and Key Coverage
Our study defines the continuous positive airway pressure (CPAP) devices market as all newly manufactured machines that deliver steady airflow through a mask to keep the upper airway open during sleep, together with matched masks, tubing, humidifiers, filters, and other single-use disposables sold to hospitals, sleep clinics, and home-care channels worldwide. According to Mordor Intelligence, revenue values are expressed in constant 2024 USD.
Scope Exclusions: BiPAP, APAP, diagnostic sleep-apnea equipment, rental fleets, and second-hand units are excluded.
Segmentation Overview
- By Product Type
- CPAP Devices
- Fixed-pressure CPAP
- Auto-titrating (APAP)
- Bilevel PAP
- Accessories
- Masks
- Tubing & Filters
- Humidifiers
- CPAP Devices
- By Interface (Mask Type)
- Nasal Mask
- Nasal Pillow Mask
- Full-face Mask
- Oral Mask
- By End-User
- Homecare Settings
- Sleep Laboratories & Clinics
- Hospitals
- By Distribution Channel
- Offline (DME Stores, Hospital Pharmacies)
- Online (E-commerce, Company Webshops)
- By Geography
- North America
- United States
- Canada
- Mexico
- Europe
- Germany
- France
- United Kingdom
- Italy
- Spain
- Rest of Europe
- Asia-Pacific
- China
- Japan
- India
- South Korea
- Australia
- Rest of Asia-Pacific
- Middle East & Africa
- GCC
- South Africa
- Rest of Middle East & Africa
- South America
- Brazil
- Argentina
- Rest of South America
- North America
Detailed Research Methodology and Data Validation
Primary Research
Analysts speak with sleep-medicine physicians, respiratory therapists, durable medical-equipment distributors, and payer-policy specialists across North America, Europe, Asia, and Latin America. The interviews confirm diagnosis patterns, average replacement cycles, and typical selling prices, which are then used to close information gaps and triangulate desk findings.
Desk Research
We begin with open datasets from the World Health Organization, the Centers for Disease Control and Prevention, the European Respiratory Society, and national customs codes tracking HS 9019 imports. Company 10-K filings, investor decks, and major medical-device associations supply price brackets and installed-base clues. Paid portals such as D&B Hoovers and Dow Jones Factiva then help our analysts benchmark vendor revenues and cross-check news on recalls or reimbursement shifts. The sources listed illustrate the breadth of material consulted; many additional publications underpin the final database.
Market-Sizing & Forecasting
A top-down prevalence-to-treated-patient pool model converts country-level obstructive sleep-apnea prevalence into addressable demand and values it with weighted average selling prices. Bottom-up checks based on sampled supplier revenues, channel shipment data, and import volumes validate totals and adjust for gray-market leakages. Key variables include diagnosed prevalence, therapy-adherence rate, device-replacement interval, average price drift, and telemonitoring uptake. Forecasts rely on multivariate regression coupled with scenario analysis that blends demographic aging, obesity trends, and policy changes flagged by our experts.
Data Validation & Update Cycle
Outputs pass a three-layer review that screens anomalies, revisits assumptions, and compares figures with fresh shipment or reimbursement signals. Models refresh every twelve months, with interim updates triggered by material regulatory or competitive events, before a final analyst pass signs off the numbers that reach clients.
Why Mordor's CPAP Devices Baseline Commands Confidence
Published estimates often diverge because each publisher chooses its own product basket, pricing assumption, and refresh cadence, and some quote only factory-gate machines while others fold in accessories.
Key gap drivers include narrower geographic scope, omission of disposables, and unverified average-price inputs.
Benchmark comparison
| Market Size | Anonymized source | Primary gap driver |
|---|---|---|
| USD 5.09 B (2025) | Mordor Intelligence | - |
| USD 2.01 B (2025) | Global Consultancy A | Counts machines only, excludes masks and consumables, limited country set |
| USD 5.56 B (2025) | Industry Bulletin B | Uses list prices, assumes uniform three-year replacement |
| USD 4.50 B (2024) | Regional Consultancy C | Base year predates 2021 recall, spot-rate currency conversion |
These contrasts show that Mordor's disciplined scope selection, annual refresh, and dual-check modeling give decision-makers a balanced, transparent baseline that can be replicated and stress-tested with ease.


Key Questions Answered in the Report
What is the CPAP devices market size in 2026?
It is USD 5.22 billion, with a forecast to reach USD 7.94 billion by 2031.
How fast is demand growing for accessories?
Accessories revenue is expanding at an 11.46% CAGR through 2031, outpacing devices.
Which region leads revenue?
North America holds 34.54% of 2025 global revenue, driven by broad reimbursement coverage.
Why are travel-size CPAP units gaining traction?
Ultra-quiet micro-blowers make devices under 0.5 pounds, appealing to travelers who previously skipped therapy.
What role does AI play in CPAP adherence?
Cloud platforms such as ResMed’s myAir raise 90-day adherence by around 30% through personalized coaching.
Page last updated on:


